





ML Workflow Made Simple: How to Automate ML Experiment Tracking with Vertex AI Experiments Autologging

1276
Of your peers have already read this article.
3:30 Minutes
The most insightful time you'll spend today!
Practical machine learning (ML) is a trial and error process. ML practitioners compare different performance metrics by running ML experiments till you find the best model with a given set of parameters. Because of the experimental nature of ML, there are many reasons for tracking ML experiments and making them reproducible including debugging and compliance.
But tracking experiments is challenging: you need to organize experiments so that other team members can quickly understand, reproduce and compare them. That adds overhead that you don’t need.
We are happy to announce Vertex AI Experiments autologging, a solution which provides automated experiment tracking for your models, which streamlines your ML experimentation
With Vertex AI Experiments autologging, you can now log parameters, performance metrics and lineage artifacts by adding one line of code to your training script without needing to explicitly call any other logging methods.
How to use Vertex AI autologging
As a data scientist or ML practitioner, you conduct your experiment in a notebook environment such as Colab or Vertex AI Workbench. To enable Vertex AI Experiments autologging, you call aiplatform.autolog() in your Vertex AI Experiment session. After that call, any parameters, metrics and artifacts associated with model training are automatically logged and then accessible within the Vertex AI Experiment console.
Here’s how to enable autologging in your training session with a Scikit-learn model.
# Enable autologging
aiplatform.autolog()

# Build training pipeline
ml_pipeline = Pipeline(...)

# Train model
ml_pipeline.fit(x_train, y_train)
This video shows parameters and training/post-training metrics in the Vertex AI Experiment console.
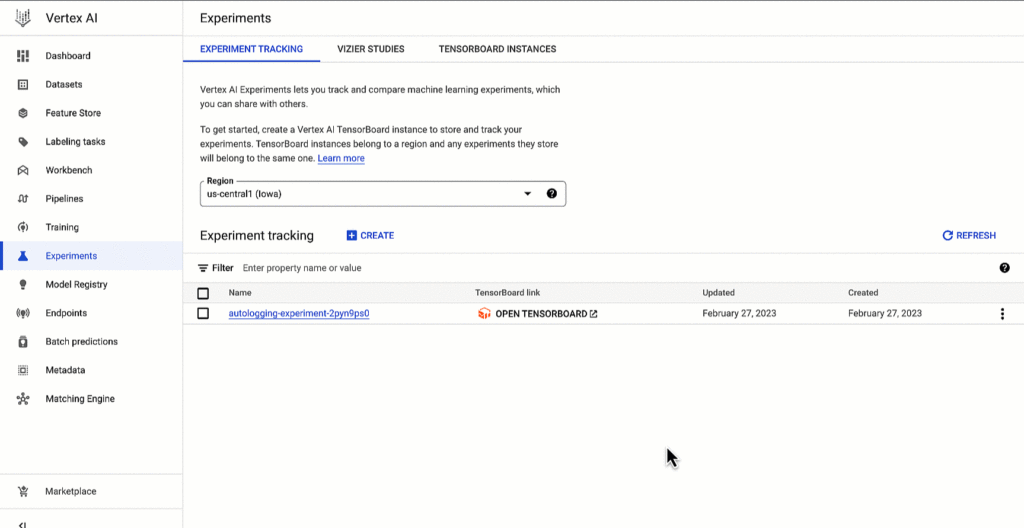
Vertex AI SDK autologging uses MLFlow’s autologging in its implementation and it supports several frameworks including XGBoost, Keras and Pytorch Lighting. See documentation for all supported frameworks.
Vertex AI Experiments autologging automatically logs model time series metrics when you train models along multiple epochs. That’s because of the integration between Vertex AI Experiments autologging and Vertex AI Tensorboard.
Furthermore, you can adapt Vertex AI Experiments autologging to your needs. For example, let’s say your team has a specific experiment naming convention. By default, Vertex AI Experiments autologging automatically creates Experiment Runs for you without requiring you to call `aiplatform.start_run()` or `aiplatform.end_run()`. If you’d like to specify your own Experiment Run names for autologging, you can manually initialize a specific run within the experiment using aiplatform.start_run() and aiplatform.end_run() after autologging has been enabled.
What’s next
You can access Vertex AI Experiments autologging with the latest version of Vertex AI SDK for Python. To learn more, check out these resources :
- Documentation: Autolog data to an experiment run
- Github: Get started with Vertex AI Experiments autologging
While I’m thinking about the next blog post, let me know if there is Vertex AI content you’d like to see on Linkedin or Twitter.
Streamlining Business Processes with Google’s Document AI: Invoices, Contracts, and Beyond

1151
Of your peers have already read this article.
3:30 Minutes
The most insightful time you'll spend today!
Editor’s note: In this post, I’ll be showing some amazing ways Document AI can help you extract meaning from your documents – keep reading, or jump directly into a tutorial using the Cloud Console!
Documents are a crucial part of most businesses, used to store and communicate important information. The variety is vast: invoices, contracts, receipts, applications, plus documents unique within industries and geographies. Unfortunately, making the information contained in these documents accessible can be a time-consuming and manual process.
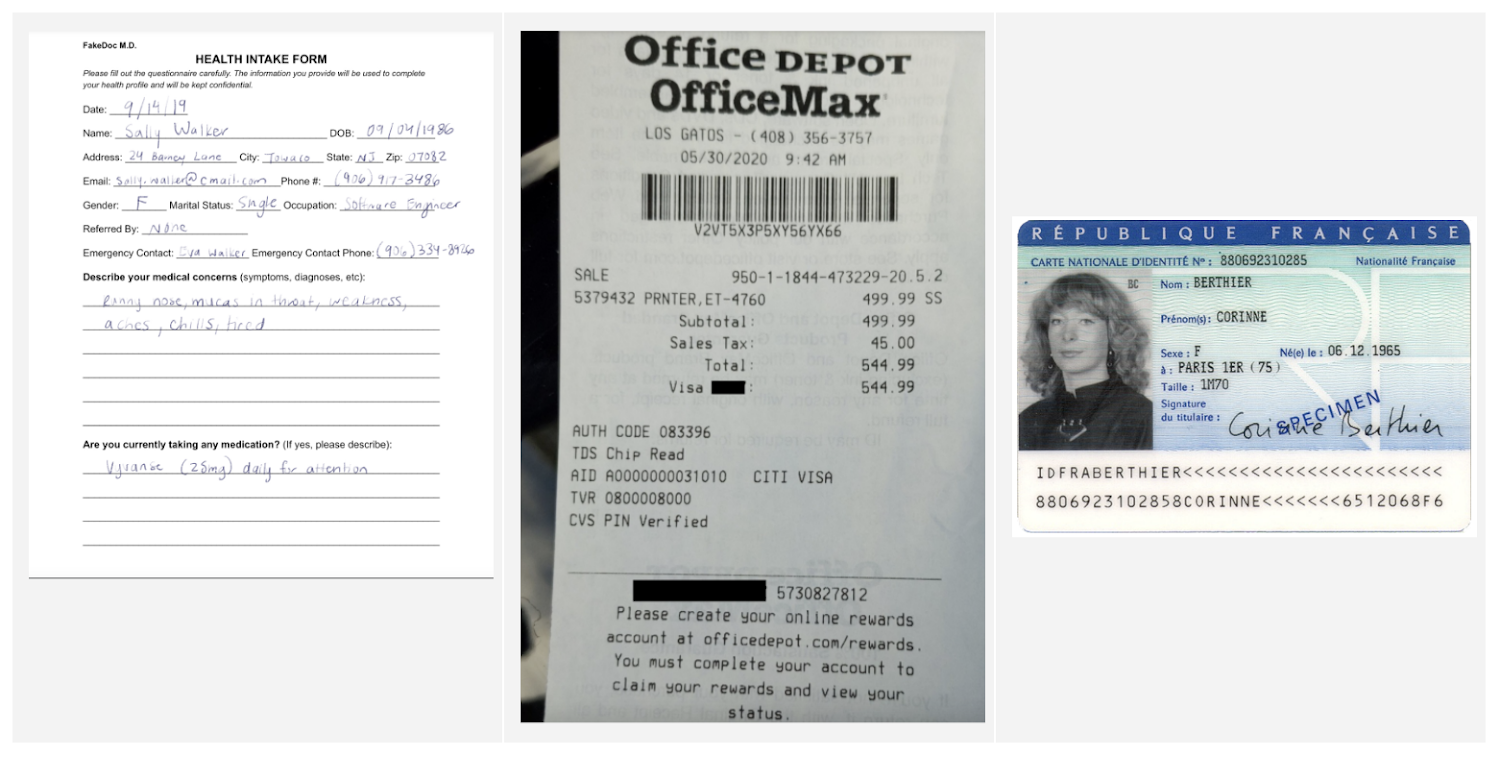
Document AI is a document understanding platform in Google Cloud that takes unstructured data from documents and transforms it into structured data, making them easier to understand, analyze, and consume. By using this technology, you can streamline your document processing workflows, reduce errors, and unlock insights that were previously buried in mountains of paperwork.
Whether you’re a small business owner or an enterprise looking to bring efficiency to your operations, Document AI has something to offer. So let’s take a look and see what it can do!
Understanding documents with Document AI
When we say that Document AI can understand documents, we mean that it is able to analyze the content within documents and derive meaningful insights from it. This goes beyond simply recognizing the characters and words within a document (which is what traditional OCR technology does) – Document AI can actually comprehend the meaning behind the text.
For example, let’s say you have a contract that needs to be processed. Traditional OCR technology might be able to extract the text from the document, but it would not be able to understand the legal terms and clauses within it. Document AI, on the other hand, can actually interpret the meaning of the text and extract key information such as parties involved, terms and conditions, dates, and signatures.
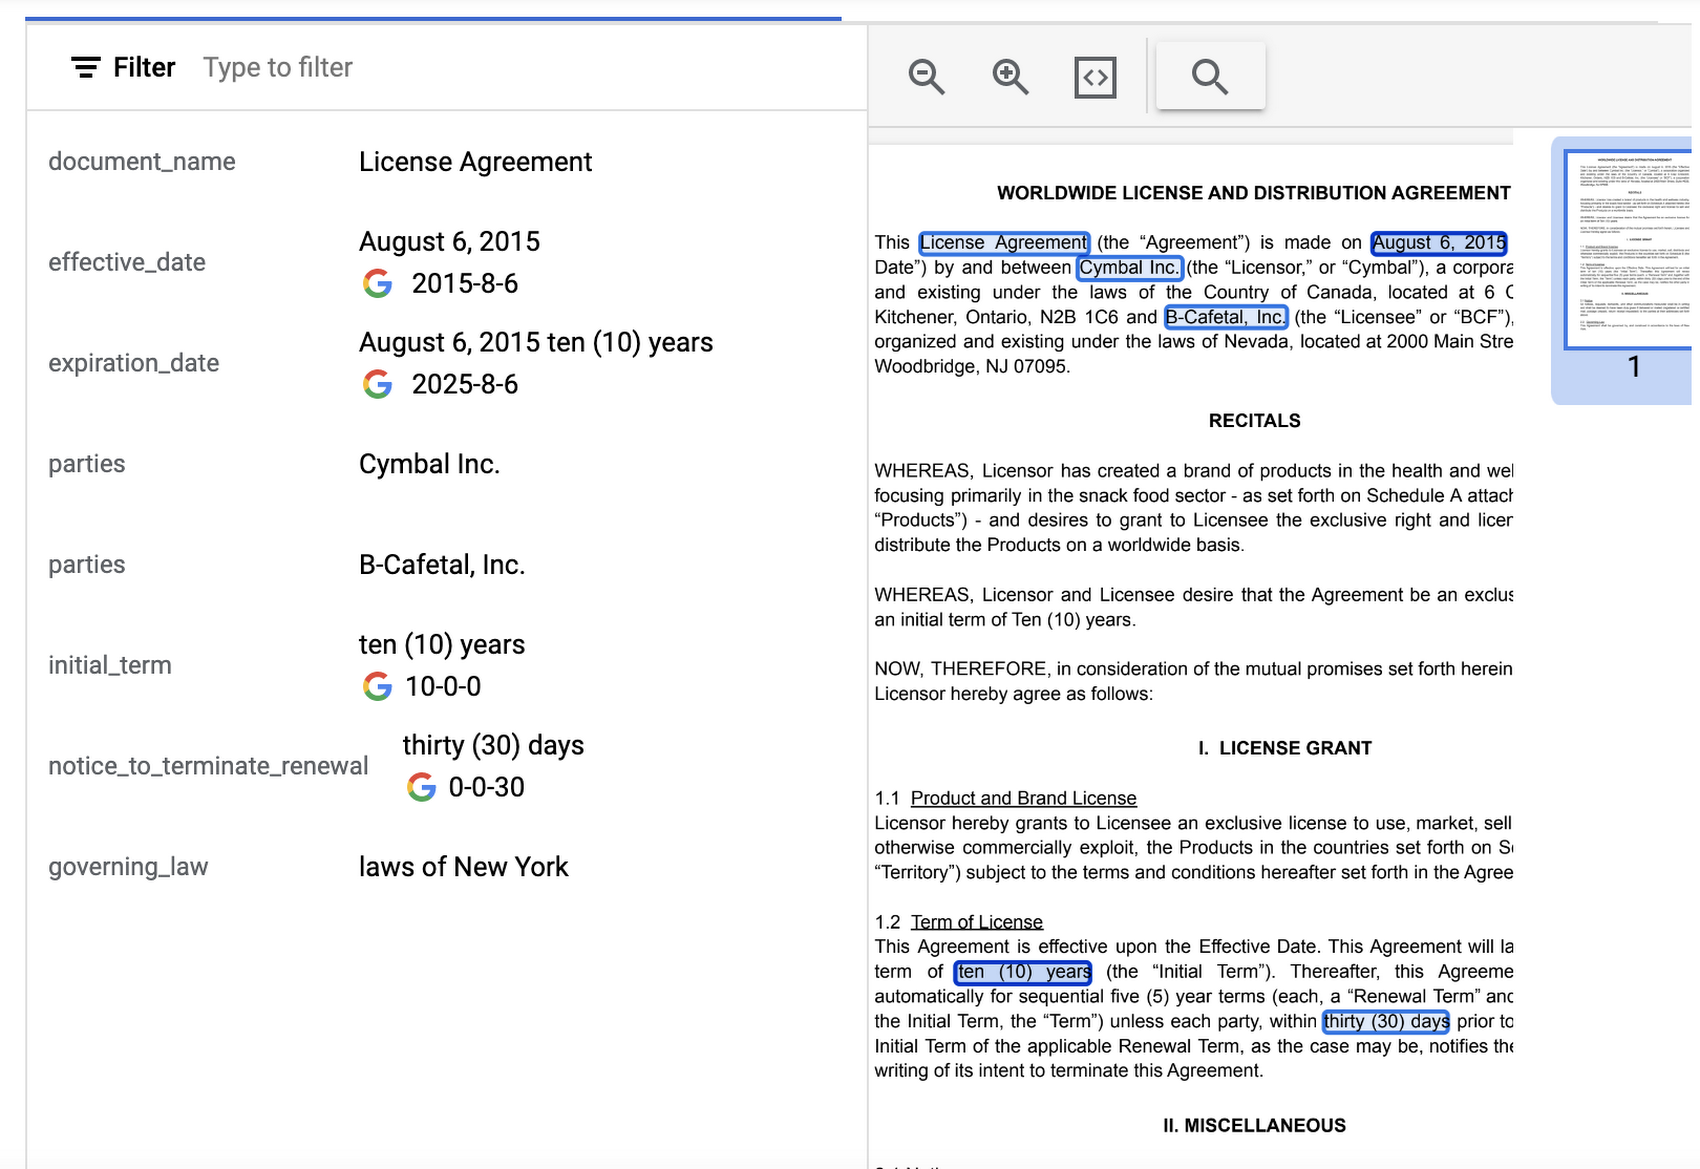
Document AI offers several pre-built models and processors that are specifically designed to extract different types of data from various document types. Within the specific document types, the processors can perform several tasks such as Optical Character Recognition (OCR), form parsing, splitting, classification or entity extraction. These processors can be customized and combined to create powerful document processing workflows that are tailored to a business’s unique needs.
Let’s look closer at a few of the processors available in Document AI, including the Form Parser, Invoice Parser, Expense Parser, Identity Document Proofing Parser, and Intelligent Document Quality Processor.
Form Parser
This general processor is designed to extract structured data from forms such as application forms, surveys, and questionnaires. It automatically identifies and extracts data from form fields (key-value pairs), such as names, addresses, dates, and other types of structured data; even checkboxes and tables. This processor also leverages deep learning models to extract generic entities that are common in various document types, meaning it can identify if something is an email address, phone number, datetime, organization, quantity, price, person, and more.
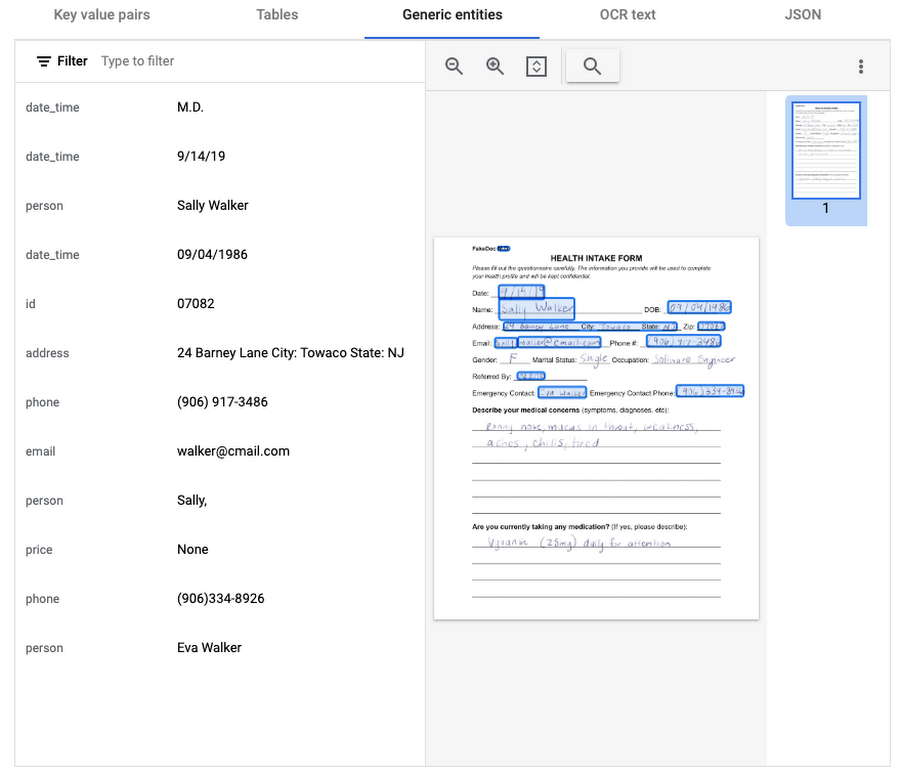
In this visualization of the API response, you can see that Document AI has identified several key value pairs that correspond to the form’s fields and the responder’s answers.
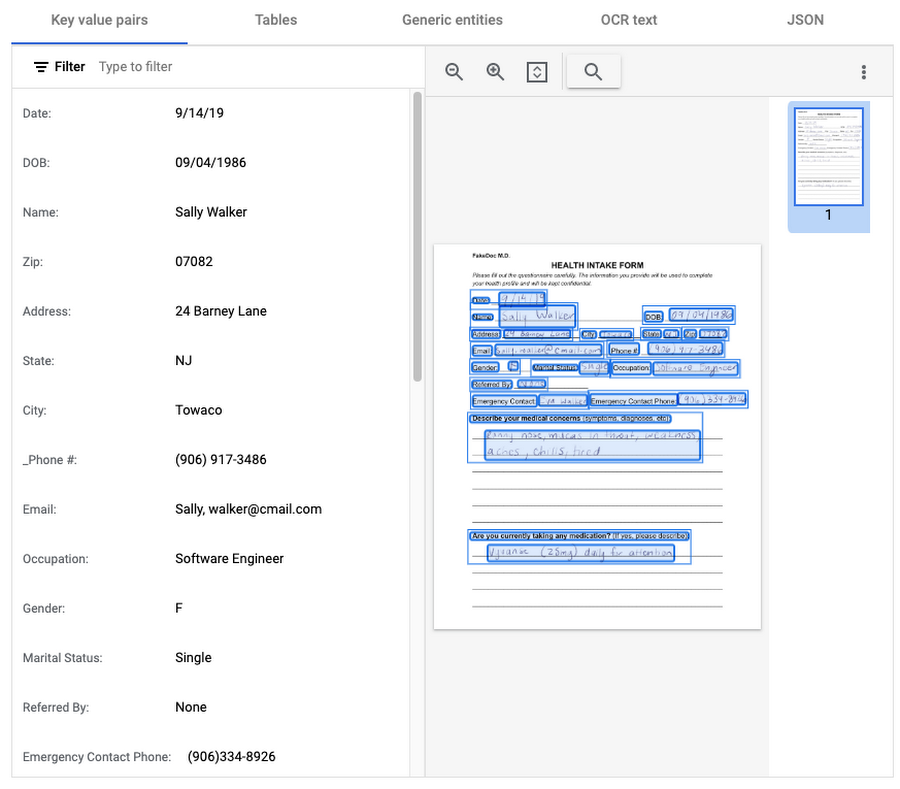
Also of interest is that the form parser recognized certain generic entities including: several dates, an address, phone numbers, email, and two people (the responder and their listed emergency contact).
Invoice Parser
This parser is designed to identify and extract relevant information from invoices including a large number of typical invoice fields, but can also be customized (uptrained) to recognize different invoice layouts, languages, and data fields. Invoices are a critical part of the accounts payable process, making this functionality valuable across industries and companies building A/P features into their products.
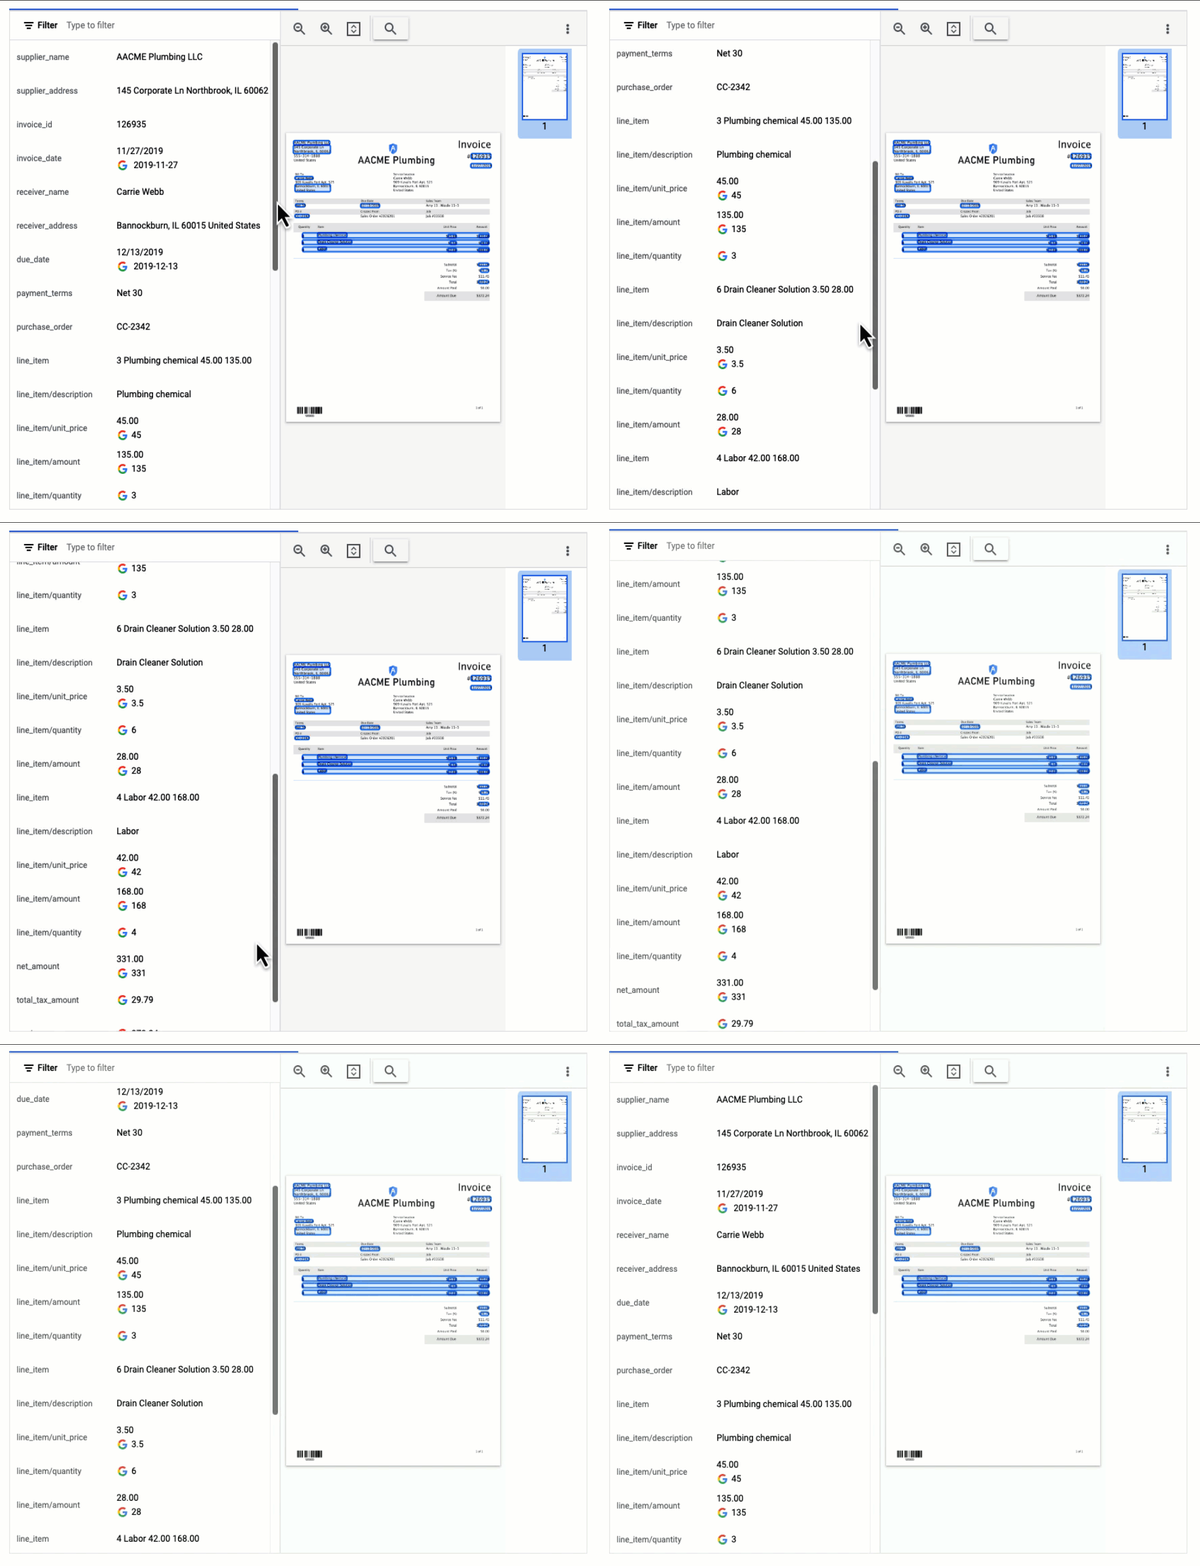
In this visualization of the API response, you can see that Document AI has extracted a large number of key-value pairs and even provided normalized values for several of the fields.
Expense Parser
This specialized processor is designed to extract data from receipts and invoices, such as vendor name, date, and total amount paid. It can also identify line items within an invoice and categorize them based on the type of expense (e.g. meals, travel, office supplies). The expense parser makes it easier for you to process expense reports and other financial documents, and it can integrate with other tools and systems to completely automate the entire expense reporting process.
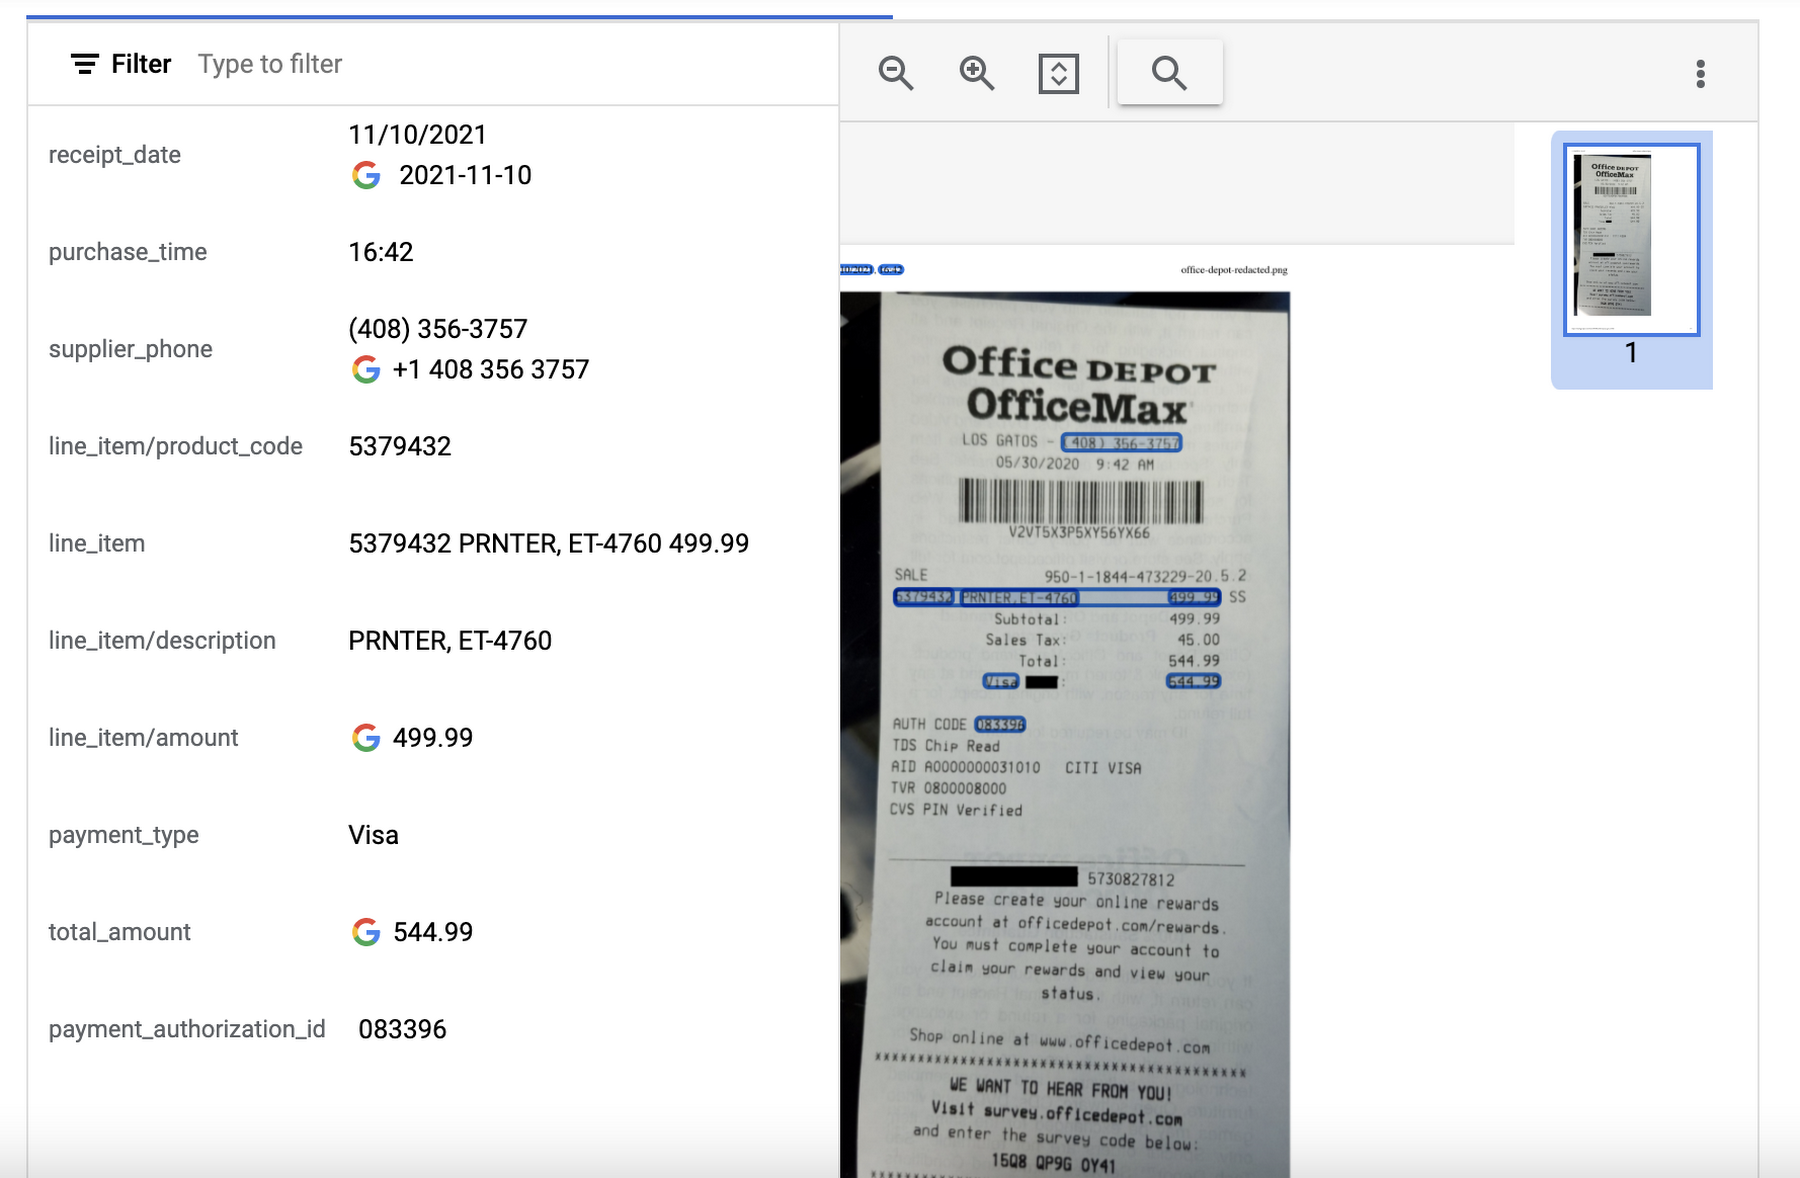
In this visualization of the API response, you can see that Document AI has extracted the text from the receipt and identified several typical entities such as purchase date and time, payment type, and total amount.
Identity Document Proofing Parser
This processor is designed to help predict the validity of ID documents with four different signals.
- is_identity_document detection: Predicts whether an image contains a recognized identity document.
- suspicious_words detection: Predicts whether words are present that aren’t typical on IDs.
- image_manipulation detection: Predicts whether the image was altered or tampered via an image editing tool.
- online_duplicate detection: Predicts whether the image can be found online.
If suspicious words are detected or the image can be found online, additional information is provided to explain these signals.
This can be particularly useful for businesses that need to verify the identity of customers or employees as part of their operations. This processor could be used in conjunction with other processors that extract key information such as name, date of birth, ID number, and expiration date from specific identity documents (US Driver License Parser, US Passport, France National ID Parser, etc.).
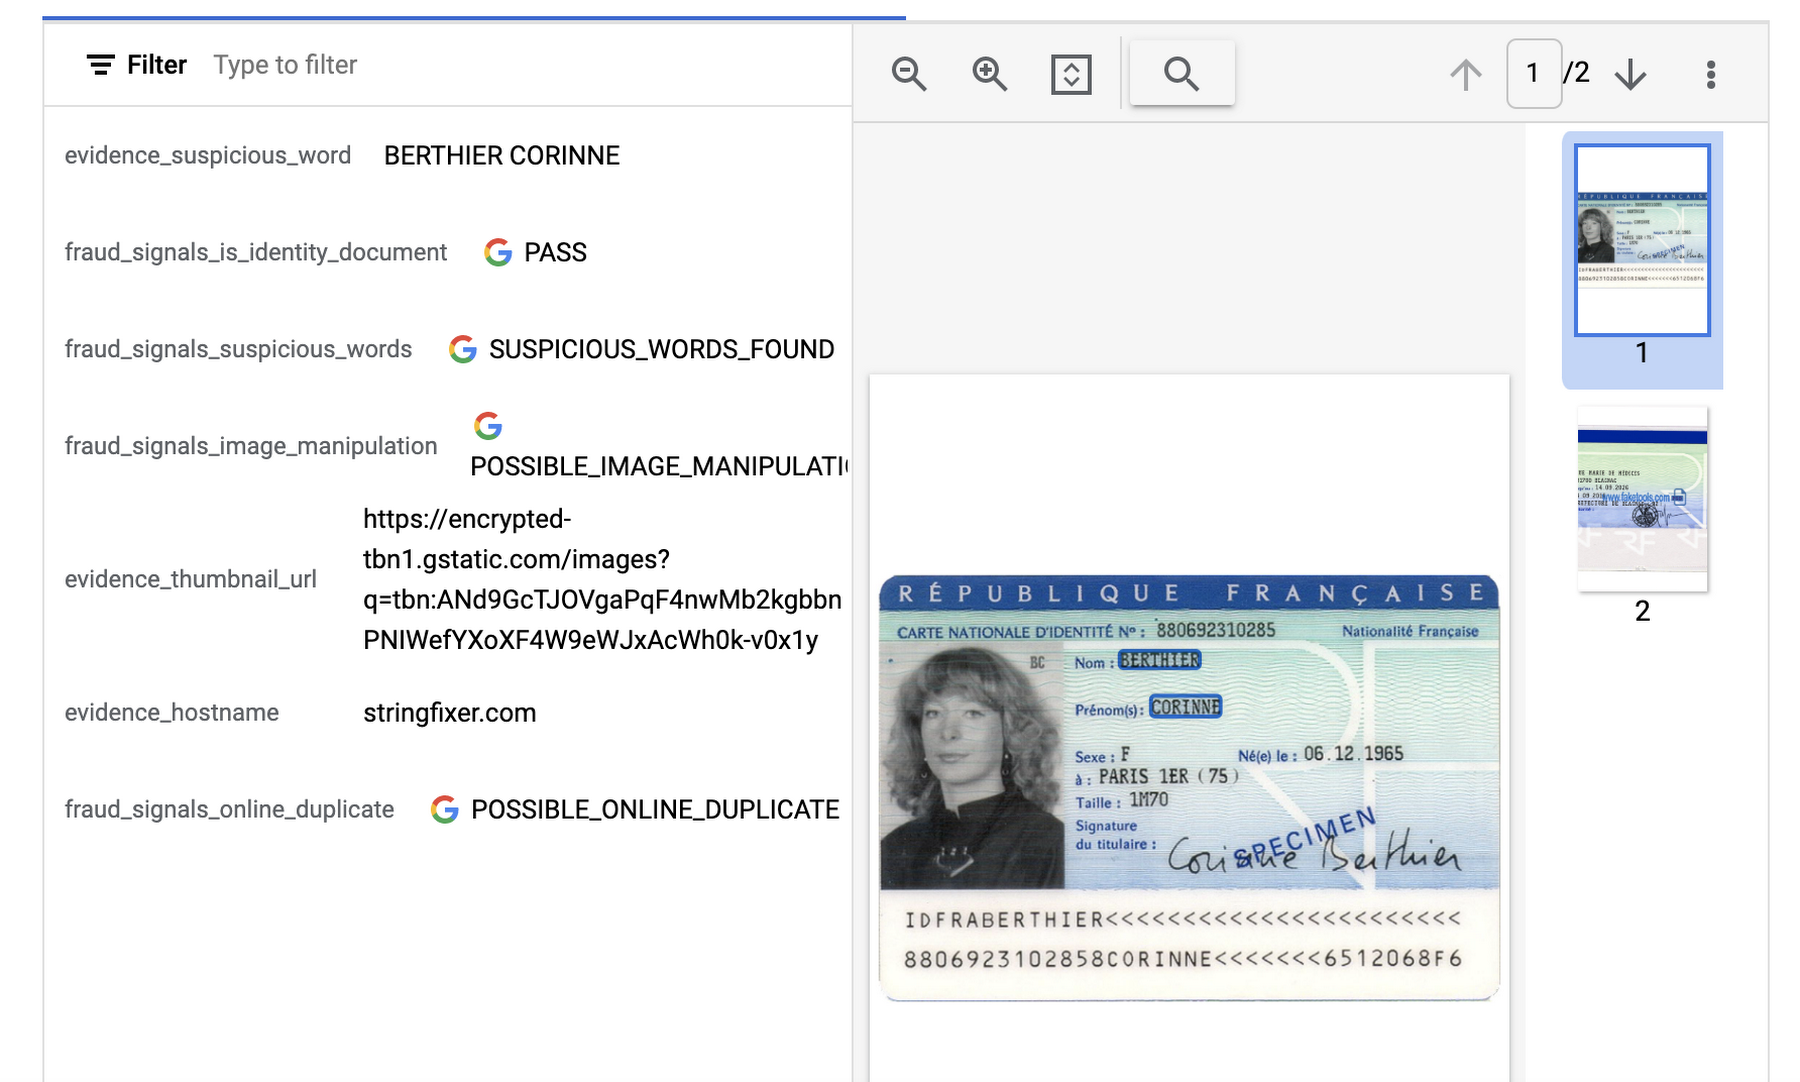
In this visualization of the API response, you can see that Document AI has passed the document on the first detection point (is_identity_document), but failed the document for the other three items and provided additional information in the evidence fields.
Intelligent Document Quality Processor
This general use processor is designed to detect a variety of document quality issues, such as missing pages, blurry images, low contrast, inconsistent formatting, and incorrect data, and flag these potential issues which could affect their usability, accuracy, or compliance. It can also identify sensitive information that has not been redacted or missing information required by regulatory standards.
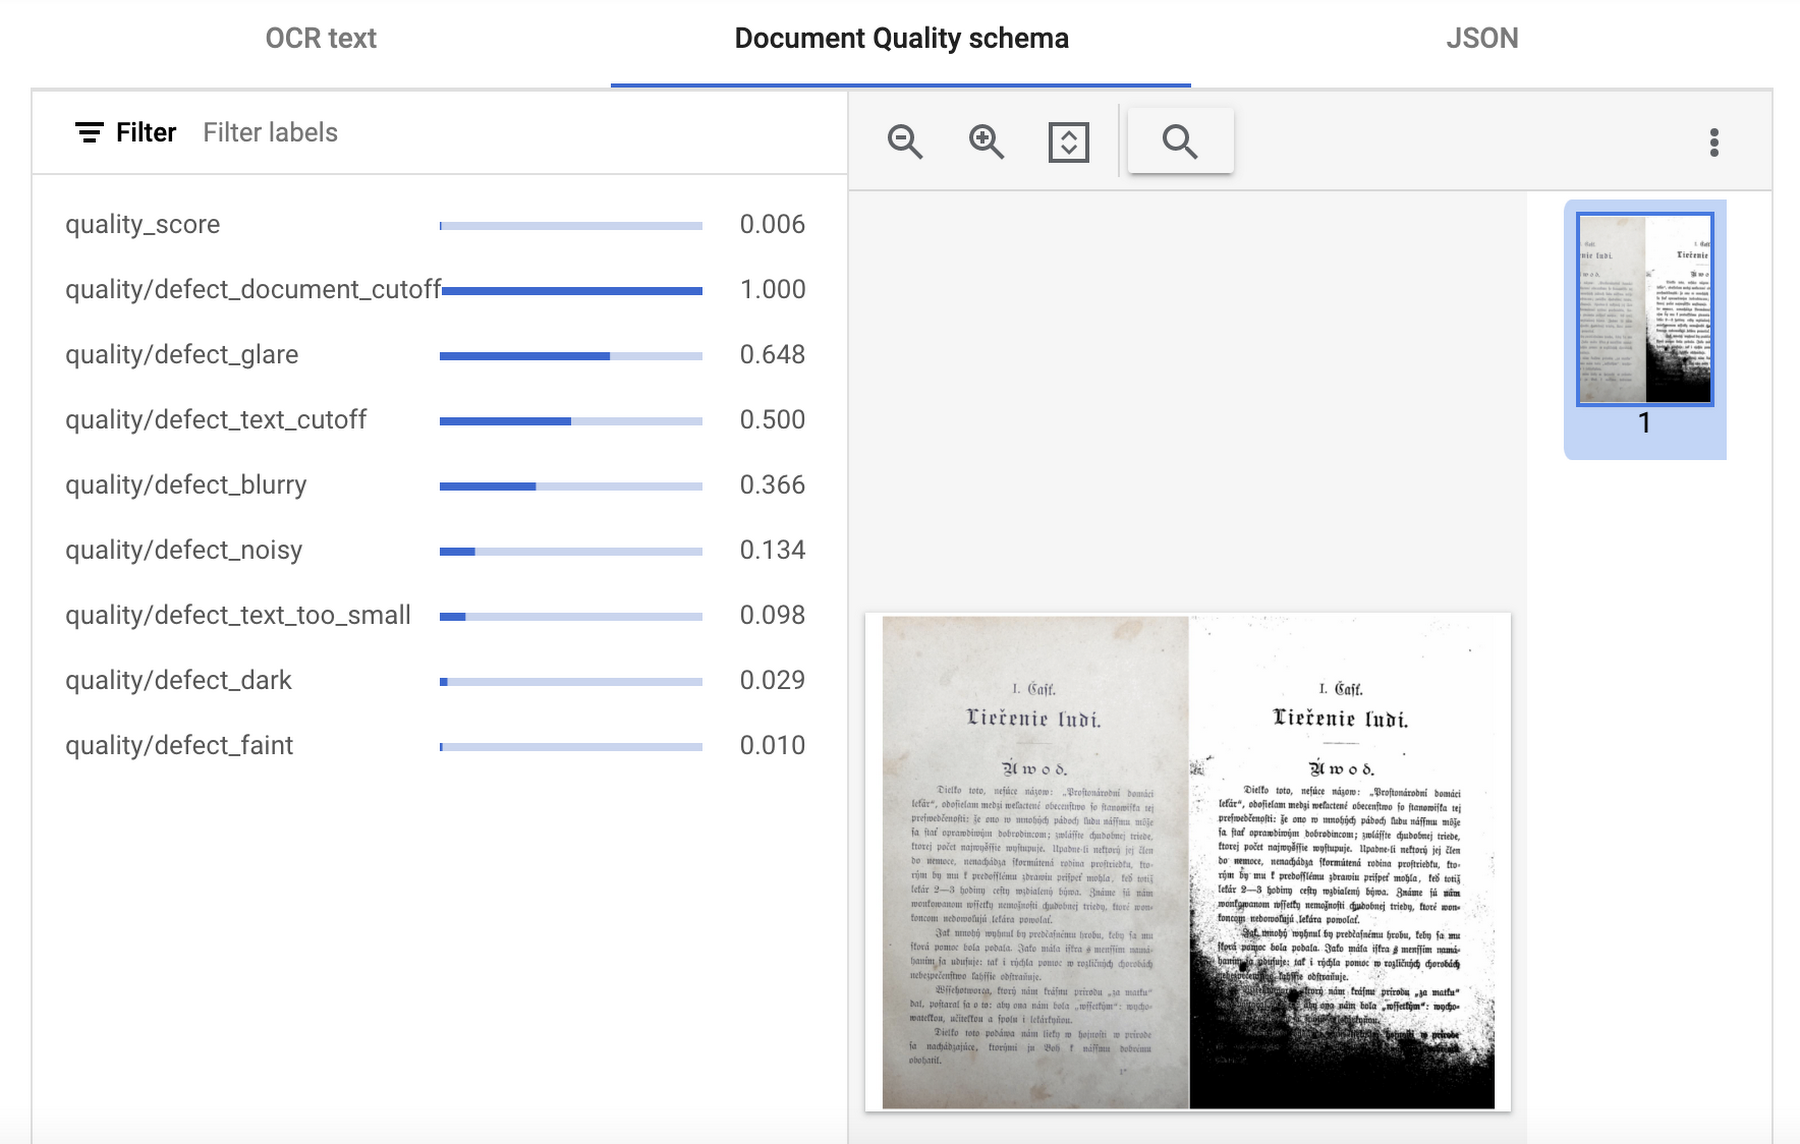
This quality assessment is returned as a quality score from 0 to 1, where 1 means perfect quality. If the quality score detected is lower than 0.5, a list of negative quality reasons (sorted by the likelihood) is also returned.
In this visualization of the API response, you can see that Document AI has determined a quality_score of 0.006 and also provided a list of several reasons including document and text cutoff, blurriness, and glare (among others).
Next steps
These are just a few examples of the types of processors that Document AI offers. Perusing the current documentation, you can find it has more than 40 processors, with each providing several functions, to explore. Document AI also offers you the ability to uptrain certain processors and supports the option to build your own custom processor. Across the board, if a document contains structured or unstructured text, Document AI has the capability to extract valuable data from it.
Get started and learn more by heading to our tutorials in the Cloud Console:
New Capabilities in BigQuery to Ease Anomalies Detection in the Absence of Labeled Data

6349
Of your peers have already read this article.
4:00 Minutes
The most insightful time you'll spend today!
When it comes to anomaly detection, one of the key challenges that many organizations face is that it can be difficult to know how to define what an anomaly is. How do you define and anticipate unusual network intrusions, manufacturing defects, or insurance fraud? If you have labeled data with known anomalies, then you can choose from a variety of supervised machine learning model types that are already supported in BigQuery ML. But what can you do if you don’t know what kind of anomaly to expect, and you don’t have labeled data? Unlike typical predictive techniques that leverage supervised learning, organizations may need to be able to detect anomalies in the absence of labeled data.
Today we are announcing the public preview of new anomaly detection capabilities in BigQuery ML that leverage unsupervised machine learning to help you detect anomalies without needing labeled data. Depending on whether or not the training data is time series, users can now detect anomalies in training data or on new input data using a new ML.DETECT_ANOMALIES function (documentation), with the following models:
- Autoencoder model, now in Public Preview (documentation)
- K-means model, already GA (documentation)
- ARIMA_PLUS time series model, already GA (documentation)
How does anomaly detection with ML.DETECT_ANOMALIES work?
To detect anomalies in non-time-series data, you can use:
- K-means clustering models: When you use
ML.DETECT_ANOMALIESwith a k-means model, anomalies are identified based on the value of each input data point’s normalized distance to its nearest cluster. If that distance exceeds a threshold determined by the contamination value provided by the user, the data point is identified as an anomaly. - Autoencoder models: When you use
ML.DETECT_ANOMALIESwith an autoencoder model, anomalies are identified based on the reconstruction error for each data point. If the error exceeds a threshold determined by the contamination value, it is identified as an anomaly.
To detect anomalies in time-series data, you can use:
- ARIMA_PLUS time series models: When you use
ML.DETECT_ANOMALIESwith an ARIMA_PLUS model, anomalies are identified based on the confidence interval for that timestamp. If the probability that the data point at that timestamp occurs outside of the prediction interval exceeds a probability threshold provided by the user, the datapoint is identified as an anomaly.
Below we show code examples of anomaly detection in BigQuery ML for each of the above scenarios.
Anomaly detection with a k-means clustering model
You can now detect anomalies using k-means clustering models, by running ML.DETECT_ANOMALIES to detect anomalies in the training data or in new input data. Begin by creating a k-means clustering model:
Language: SQL
CREATE MODEL `mydataset.my_kmeans_model`OPTIONS(MODEL_TYPE = 'kmeans',NUM_CLUSTERS = 8,KMEANS_INIT_METHOD = 'kmeans++') ASSELECT* EXCEPT(Time, Class)FROM`bigquery-public-data.ml_datasets.ulb_fraud_detection`;
With the k-means clustering model trained, you can now run ML.DETECT_ANOMALIES to detect anomalies in the training data or in new input data.
To detect anomalies in the training data, use ML.DETECT_ANOMALIES with the same data used during training:
Language: SQL
SELECT*FROMML.DETECT_ANOMALIES(MODEL `mydataset.my_kmeans_model`,STRUCT(0.02 AS contamination),TABLE `bigquery-public-data.ml_datasets.ulb_fraud_detection`);

To detect anomalies in new data, use ML.DETECT_ANOMALIES and provide new data as input:
Language: SQL
SELECT*FROMML.DETECT_ANOMALIES(MODEL `mydataset.my_kmeans_model`,STRUCT(0.02 AS contamination),(SELECT * FROM `mydataset.newdata`));

How does anomaly detection work for k-means clustering models?
Anomalies are identified based on the value of each input data point’s normalized distance to its nearest cluster, which, if exceeds a threshold determined by the contamination value, is identified as an anomaly. How does this work exactly? With a k-means model and data as inputs, ML.DETECT_ANOMALIES first computes the absolute distance for each input data point to all cluster centroids in the model, then normalizes each distance by the respective cluster radius (which is defined as the standard deviation of the absolute distances of all points in this cluster to the centroid). For each data point, ML.DETECT_ANOMALIES returns the nearest centroid_id based on normalized_distance, as seen in the screenshot above. The contamination value, specified by the user, determines the threshold of whether a data point is considered an anomaly. For example, a contamination value of 0.1 means that the top 10% of descending normalized distance from the training data will be used as the cut-off threshold. If the normalized distance for a datapoint exceeds the threshold, then it is identified as an anomaly. Setting an appropriate contamination will be highly dependent on the requirements of the user or business.
For more information on anomaly detection with k-means clustering, please see the documentation here.
Anomaly detection with an autoencoder model
You can now detect anomalies using autoencoder models, by running ML.DETECT_ANOMALIES to detect anomalies in the training data or in new input data.
Begin by creating an autoencoder model:
Language: SQL
CREATE MODEL `mydataset.my_autoencoder_model`OPTIONS(model_type='autoencoder',activation_fn='relu',batch_size=8,dropout=0.2,hidden_units=[32, 16, 4, 16, 32],learn_rate=0.001,l1_reg_activation=0.0001,max_iterations=10,optimizer='adam') ASSELECT* EXCEPT(Time, Class)FROM`bigquery-public-data.ml_datasets.ulb_fraud_detection`;
To detect anomalies in the training data, use ML.DETECT_ANOMALIES with the same data used during training:
Language: SQL
SELECT*FROMML.DETECT_ANOMALIES(MODEL `mydataset.my_autoencoder_model`,STRUCT(0.02 AS contamination),TABLE `bigquery-public-data.ml_datasets.ulb_fraud_detection`);

To detect anomalies in new data, use ML.DETECT_ANOMALIES and provide new data as input:
Language: SQL
SELECT*FROMML.DETECT_ANOMALIES(MODEL `mydataset.my_autoencoder_model`,STRUCT(0.02 AS contamination),(SELECT * FROM `mydataset.newdata`));

How does anomaly detection work for autoencoder models?
Anomalies are identified based on the value of each input data point’s reconstructed error, which, if exceeds a threshold determined by the contamination value, is identified as an anomaly. How does this work exactly? With an autoencoder model and data as inputs, ML.DETECT_ANOMALIES first computes the mean_squared_error for each data point between its original values and its reconstructed values. The contamination value, specified by the user, determines the threshold of whether a data point is considered an anomaly. For example, a contamination value of 0.1 means that the top 10% of descending error from the training data will be used as the cut-off threshold. Setting an appropriate contamination will be highly dependent on the requirements of the user or business.
For more information on anomaly detection with autoencoder models, please see the documentation here.
Anomaly detection with an ARIMA_PLUS time-series model

With ML.DETECT_ANOMALIES, you can now detect anomalies using ARIMA_PLUS time series models in the (historical) training data or in new input data. Here are some examples of when might you want to detect anomalies with time-series data:
Detecting anomalies in historical data:
- Cleaning up data for forecasting and modeling purposes, e.g. preprocessing historical time series before using them to train an ML model.
- When you have a large number of retail demand time series (thousands of products across hundreds of stores or zip codes), you may want to quickly identify which stores and product categories had anomalous sales patterns, and then perform a deeper analysis of why that was the case.
Forward looking anomaly detection:
- Detecting consumer behavior and pricing anomalies as early as possible: e.g. if traffic to a specific product page suddenly and unexpectedly spikes, it might be because of an error in the pricing process that leads to an unusually low price.
- When you have a large number of retail demand time series (thousands of products across hundreds of stores or zip codes), you would like to identify which stores and product categories had anomalous sales patterns based on your forecasts, so you can quickly respond to any unexpected spikes or dips.
How do you detect anomalies using ARIMA_PLUS? Begin by creating an ARIMA_PLUS time series model:
Language: SQL
CREATE OR REPLACE MODEL mydataset.my_arima_plus_modelOPTIONS(MODEL_TYPE='ARIMA_PLUS',TIME_SERIES_TIMESTAMP_COL='date',TIME_SERIES_DATA_COL='total_amount_sold',TIME_SERIES_ID_COL='item_name',HOLIDAY_REGION='US') ASSELECTdate,item_description AS item_name,SUM(bottles_sold) AS total_amount_soldFROM`bigquery-public-data.iowa_liquor_sales.sales`GROUP BYdate,item_nameHAVINGdate BETWEEN DATE('2016-01-04') AND DATE('2017-06-01')AND item_name IN ("Black Velvet", "Captain Morgan Spiced Rum","Hawkeye Vodka", "Five O'Clock Vodka", "Fireball Cinnamon Whiskey");
To detect anomalies in the training data, use ML.DETECT_ANOMALIES with the model obtained above:
Language: SQL
SELECT*FROMML.DETECT_ANOMALIES(MODEL `mydataset.my_arima_plus_model`,STRUCT(0.8 AS anomaly_prob_threshold));

To detect anomalies in new data, use ML.DETECT_ANOMALIES and provide new data as input:
Language: SQL
WITHnew_data AS (SELECTdate,item_description AS item_name,SUM(bottles_sold) AS total_amount_soldFROM`bigquery-public-data.iowa_liquor_sales.sales`GROUP BYdate,item_nameHAVINGdate BETWEEN DATE('2017-06-02')AND DATE('2017-10-01')AND item_name IN ('Black Velvet','Captain Morgan Spiced Rum','Hawkeye Vodka',"Five O'Clock Vodka",'Fireball Cinnamon Whiskey') )SELECT*FROMML.DETECT_ANOMALIES(MODEL `mydataset.my_arima_plus_model`,STRUCT(0.8 AS anomaly_prob_threshold),(SELECT*FROMnew_data));

For more information on anomaly detection with ARIMA_PLUS time series models, please see the documentation here.
Thanks to the BigQuery ML team, especially Abhinav Khushraj, Abhishek Kashyap, Amir Hormati, Jerry Ye, Xi Cheng, Skander Hannachi, Steve Walker, and Stephanie Wang.
Collateral IT: Leveraging Google Cloud for Enhanced Asset Allocation at HSBC

2600
Of your peers have already read this article.
2:30 Minutes
The most insightful time you'll spend today!
Have you ever heard of an optimization problem? Imagine you have a million marbles, all of different sizes, colors, patterns, and weights. You need to fill up 1,000 jars of different sizes with them, but each jar has restrictions as to which colors, patterns, and how many marbles of each type it can hold. After filling all the jars, you may keep any leftover marbles, so you want to ensure that these are the shiniest ones in the bunch. How do you go about solving this puzzle? There are many possibilities, but what would be the most efficient way to guarantee you’ll reach the best possible outcome every time?
At HSBC, our Collateral Treasury desk and Collateral Management team have been solving a similar problem, but instead of marbles and jars, we work with around 50,000 assets that can be used as collateral, and 1,000s of collateral accounts.
Our Collateral Treasury Trading desk helps finance our Markets business by providing the required collateral, such as certain debt or equities, to cover its obligations to a client. The collateral could be used by HSBC for its margin requirements, CCPs (Central Counterparty Clearing Houses), or for securities financing transactions. Each obligation can have different eligibility criteria about what assets can be used as collateral for each client. These rules and restrictions revolve around the type of asset allowed or daily liquidity factors.
The process of matching collateral to obligations is known as an allocation, and it can get complicated the more diverse the collateral pool and the more customers you have. It is important to allocate collateral in the most efficient way and, traditionally, this business problem has been managed manually or by a third party against a set of simple rules.
But by collaborating with Google Cloud, we can improve collateral allocation through automation. Even small efficiency gains have the potential to make a significant difference when the amount of collateral inventory managed is tens of billions of dollars. It means the Collateral Treasury desk is much more efficient when managing its own funding costs or regulatory ratios such as the Liquidity Coverage Ratio (a key financial resource measure for banks that ensures sufficient high quality assets are readily available to survive periods of liquidity stress).
Leveraging AI to tackle a complex business problem
Our solution is OPTIC, a HSBC platform utilizing Google Operation Research Tools, or OR-Tools, an open-source optimization library provided by Google AI. Its main goal is to allow the Collateral Treasury desk to automate the collateral allocation process in the most optimal way on any given day. OPTIC’s architecture is based on microservices and provides the ability to handle large volumes of data, for which a scalable and self-managed infrastructure is needed. OPTIC runs on Google Kubernetes Engine, which provides it with workload rebalancing, auto-scaling capabilities, and high availability.
Additionally, we collaborated with Google Operations Research, which gave us access to the experience of Google AI engineers who were able to advise us on the best way to implement their optimization libraries to solve our business problem.
We’ve found that using linear programming solvers such as Google OR-Tools is the best way to achieve the optimization capability that fundamentally changes how we manage our inventory. It enables us to optimize for multiple outcomes and be certain that we are doing this in the most efficient way possible.
Finding the optimal way forward with automation
OPTIC works by consuming data feeds from a multitude of systems, then it standardizes the data, and combines with decision-making parameters and weightings Google OR-Tools can use, to understand and arrive at an optimal outcome. OPTIC can also provide insights and metrics that help optimize business decisions such as which assets can be added or removed in the future to make collateral allocation even more efficient.
Looking forward, this project makes us optimistic about using Google Kubernetes Engine to manage more of our microservices in other platforms. This will mean that we can scale without worrying about hardware or making big changes to our environment. With this solution, we’ll be able to mobilize and optimize our collateral according to our own view of the value and quality of the collateral, as well as the best fit for our exposures at any given time.
Over time, the project can bring visible long-term benefits to HSBC’s Markets business, including decreased operational risks and potential to save significant funding costs. Next, we will continue to add new capabilities and data sources to our solution to continue solving some of the most complex business challenges in our industry.
Google is a Leader in the 2023 Gartner® Magic Quadrant™ for Enterprise Conversational AI Platforms

1299
Of your peers have already read this article.
1:30 Minutes
The most insightful time you'll spend today!
We’re excited to share that Gartner has recognized Google as a Leader in the 2023 Gartner® Magic Quadrant™ for Enterprise Conversational AI Platforms, authored by Bern Elliot and Gabriele Rigon.
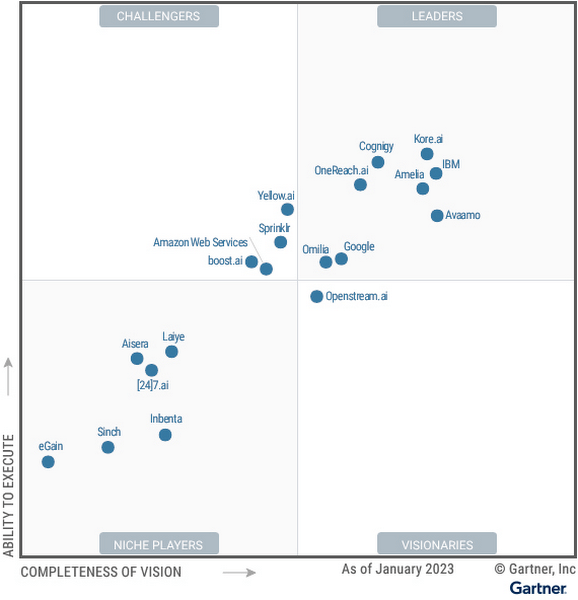
We believe this recognition is a testament to Google Cloud’s robust investments and commitment to innovation in AI, coupled with a deep understanding of enterprise customer needs. Enterprises are increasingly investing in AI-driven solutions that balance addressing customer expectations with operational efficiency. At a time when the demand for quality, performant, and trustworthy conversational AI has never been higher, we’re thrilled to continue to deliver best-in-class technologies, purpose-built to solve our customers’ most critical use cases.
In 2022, Google Cloud delivered cutting-edge conversational AI technologies with many launches to our Conversational AI API portfolio. Together, these enabled developers to leverage Google’s technologies to power their applications with our end-to-end Contact Center AI (CCAI) suite, designed to solve the needs of Customer Experience (CX) and contact center leaders.
Google Cloud’s Conversational AI APIs include pre-trained models for Speech to Text, Text to Speech and Natural Language Understanding. This conversational AI core leverages Google Research’s technology for speech, understanding and interaction, enabling and orchestrating high-quality conversational experiences at scale.
With Contact Center AI, organizations see improved customer satisfaction, higher agent productivity and reduced costs through increased agent efficiency. By focusing on user needs, Google Cloud provides comprehensive and integrated solutions that are ready for the enterprise. CCAI encompasses a comprehensive set of offerings to address the needs of the contact center.
In 2022, we launched Contact Center AI Platform, our AI-first, mobile-first, user-first contact center as a service (CCaaS), providing AI-powered experiences, CRM-centered design and deployment flexibility in a single platform without the need for multiple providers. Contact Center AI Platform auto-scales on the backend, with capacity for up to 100k concurrent users on a single tenant. It also offers multi-provider voice resiliency with global low-latency routing for best possible call quality and is optimized for enhanced customer/business data security, reduced downtime, and increased agent productivity. Segra, one of the largest independent fiber infrastructure bandwidth companies in the Eastern U.S., is leveraging CCAI Platform to reimagine their customer experience through predictive flows for common experiences and greatly expanding their channels for customer interaction.
CCAI also includes Dialogflow for building virtual agents, enabling businesses to meet their customers across multiple channels. It offers robust, flexible self-service voice and chat interactions that are just as natural as a live agent. Dialogflow enables both a great customer experience and a cost-effective way to scale services.
Our Agent Assist service gives businesses the ability to transition a call from a virtual agent to a human agent while maintaining context. It efficiently guides the agent to an accurate response, while providing real-time suggestions, more accurate responses and informed recommendations.
To improve contact center operations, CCAI Insights analyzes all customer conversations to provide leaders with real-time, actionable data points on customer queries, agent performance, and sentiment trends. Its topic modeling capabilities enable deeper understanding of key investment areas and greater classification accuracy.
To ensure our enterprise customers deploying CCAI realize value faster, Google Cloud offers CCAI through three defined transformation stages with out-of-the-box packages. The first stage starts with efficiency basics in the first week that include transcription and summarization. The second stage covers automation basics within six months using Agent Assist and Insights. The final stage is full automation within a year with industry use cases and pre-built components. All of this leads to higher agent efficiency, improved customer satisfaction and increased containment.
As we look forward to the rest of 2023 and beyond, elevating the customer experience through user-first design, AI-first capabilities and accelerating time-to-value will be our north star. We plan to announce exciting new capabilities over the next few months to enable that vision to become a reality for many more organizations.
We are honored to be a Leader in the 2023 Gartner® Magic Quadrant™ for Enterprise Conversational AI Platforms, and look forward to continuing to innovate and partner with customers on their digital transformation journeys.
Download the complimentary copy of the report: 2023 Gartner® Magic Quadrant™ for Enterprise Conversational AI Platforms.
Learn more about how organizations are transforming their business with Google Cloud solutions with Contact Center AI.
GARTNER is a registered trademark and service mark of Gartner and Magic Quadrant is a registered trademark of Gartner, Inc. and/or its affiliates in the U.S. and internationally and are used herein with permission. All rights reserved.
This graphic was published by Gartner, Inc. as part of a larger research document and should be evaluated in the context of the entire document. The Gartner document is available upon request from Google.
Gartner does not endorse any vendor, product or service depicted in its research publications and does not advise technology users to select only those vendors with the highest ratings or other designation. Gartner research publications consist of the opinions of Gartner’s research organization and should not be construed as statements of fact. Gartner disclaims all warranties, expressed or implied, with respect to this research, including any warranties of merchantability or fitness for a particular purpose.
How TeamSnap Improved Return on Ad Spend Significantly

5628
Of your peers have already read this article.
3:30 Minutes
The most insightful time you'll spend today!
Anyone who has ever coached or played on a sports team, or had a child involved in sports, knows how difficult scheduling and logistics can be. From game and practice schedules, to uniforms and who’s bringing the snacks, it can be a lot for coaches, administrators, parents, and players to manage.
It’s no wonder that TeamSnap, a sports team, club, and tournament management app, has exploded in popularity worldwide. By syncing events to everyone’s personal calendars and providing messaging and payment tracking, TeamSnap makes communication and organization easy.
TeamSnap markets its app to coaches, players, and clubs via targeted YouTube ads. It also uses Google AdWords and DoubleClick to advertise on search results and run programmatic campaigns. These methods have been highly effective, helping TeamSnap grow to millions of users worldwide and become one of the most popular apps in the iOS app store.
As its business and data grew, TeamSnap was challenged to track ROI and measure the customer journey across channels and devices over time. The company’s marketing budget grew quickly, making it even more important to spend wisely. With data in Google Analytics 360, DoubleClick Campaign Manager, Google AdWords, and Salesforce, TeamSnap needed a way to link and correlate those data sources in a scalable, timely, and cost-effective way to understand the true impact of its digital marketing across websites and mobile apps.
To avoid the painstaking manual process of pulling data from multiple sources, TeamSnap began using Google Analytics 360, which integrates with Google BigQuery, to provide a fully managed big data analysis service. TeamSnap analyzes the data using Tableau, which connects directly to Google BigQuery for fast analytics and helps the company share and collaborate on that information with self-service ease.
The combination allows TeamSnap to easily track the activity of millions of users with self-service ease, without worrying about the scalability or availability of the big data platform.
“Before Google Analytics 360, Google BigQuery, and Tableau, tracking our return on ad spend was difficult because we had so much data,” says Ken McDonald, Chief Growth Officer at TeamSnap. “We didn’t always have insights to make the best choices. We don’t have that problem anymore because we’ve moved to real-time reporting. We find additional revenue growth opportunities almost daily.”
Making Ad Dollars Work Harder
TeamSnap now automatically imports unsampled Google Analytics 360 logs into the Google BigQuery data warehouse. To import data from other sources such as Google AdWords, DoubleClick, and YouTube, TeamSnap uses Google BigQuery Data Transfer Service. With all relevant data consolidated in Google BigQuery, TeamSnap can use Tableau to perform advanced analytics on its digital marketing, executing ad-hoc analyses in seconds, while eliminating data sampling issues, to improve accuracy. These analyses can also be reused and shared with internal and external stakeholders via Tableau Online, promoting governed reuse and consistency.
“Using Google Analytics 360 and Google BigQuery with Tableau to track our return on ad spend is ideal,” says Ken. “It’s easy to use SQL to query the data or explore it with drag-and-drop ease.”
With Google BigQuery, Ken and his team can bring all the data from the TeamSnap billing systems, internal CRM, and other Google services into one straightforward dataset that everyone uses. With Tableau, users are able to perform self-service analytics on this data and provision analyses via shared dashboards that communicate the same consistent truth across the company. These dashboards provide a single view of the business to discover new patterns and questions worth analyzing.
All of this results in enormous time savings because no one is re-inventing the wheel. “Using these tools, we immediately reallocated $300,000 of ad spend that was performing poorly, generating 200% ROI in the first two days,” says Ken.
Ken now spends his time analyzing data instead of trying to pull it all together, identifying pockets of inefficient spend in real time and reallocating those marketing dollars toward better performing campaigns.
“Before, we could only focus on the largest campaign-level datasets because it was so time consuming to pull the data,” he says. “With Google BigQuery and Tableau, we can examine our advertising ROI much more granularly and reallocate more than $10 million in ad spend annually to grow the company faster and more efficiently.”
More Effective A/B Testing
To make sure it is delivering the best customer experiences, TeamSnap uses Google Optimize to run A/B tests on its website. It uses Google BigQuery and Tableau to verify and supplement these findings by measuring longer-term customer behavior across devices, spanning both web and mobile apps.
By pulling in data from Google Optimize, Google Analytics 360, Salesforce, and in-house billing and CRM systems, and understanding it with Tableau, TeamSnap has increased the accuracy and effectiveness of its A/B testing, gaining a more complete picture of customer onboarding and activity. In some cases, it found that short-term indicators it previously trusted were actually poor predictors of long-term behavior.
“Integration between Google Analytics 360 and Google BigQuery is seamless, giving us much more confidence in our A/B testing,” says Ken. “We’re constantly finding new and interesting ways to use our digital marketing data. Often, making a simple change can increase revenue by hundreds of thousands of dollars a year.”
Improving Product Quality
TeamSnap also uses Google BigQuery and Tableau to improve its own product, tracking customer activity at such a granular level that usability and functionality issues can be exposed and addressed faster. It’s also increasing customer engagement by verifying that potential customers are coming in through the right onboarding path—for example, a coach versus a player, or a consumer versus a club or other sports business. Using A/B testing to make sure customers are routed to the appropriate flow, TeamSnap drove $4 million in additional customer value each year.
“We initially chose Google BigQuery and Tableau to help with marketing, but we realized quickly that they could help us on the product side as well,” says Ken. “Most of the testing we do is about making things better and easier for our customers, and we’re accelerating that process with Google BigQuery and Tableau.”
More Relevant Stories for Your Company

Two Ad Agencies Leverage BigQuery to Support Next-gen Ad Campaigns
Advertising agencies are faced with the challenge of providing the precision data that marketers require to make better decisions at a time when customers’ digital footprints are rapidly changing. They need to transform customer information and real-time data into actionable insights to inform clients what to execute to ensure the

Partnering with Google Cloud is the Key Behind Recent Healthcare Innovations
It’s simply amazing to witness how some of our systems integrators employ Google Cloud solutions to drive innovation in ways we at Google may never have considered—especially in healthcare. According to analyst firm MarketsandMarkets, the market for the Cloud in healthcare is projected to grow 43% between 2020 and 2025

Cloud TPU v4: powerful and efficient ML infrastructure anywhere
Today, ML-driven innovation is fundamentally transforming computing, enabling entirely new classes of internet services. For example, recent state-of-the-art lage models such as PaLM and Chinchilla herald a coming paradigm shift where ML services will augment human creativity. All indications are that we are still in the early stages of what



Productionizing TensorFlow on Google Cloud with TensorFlow Enterprise
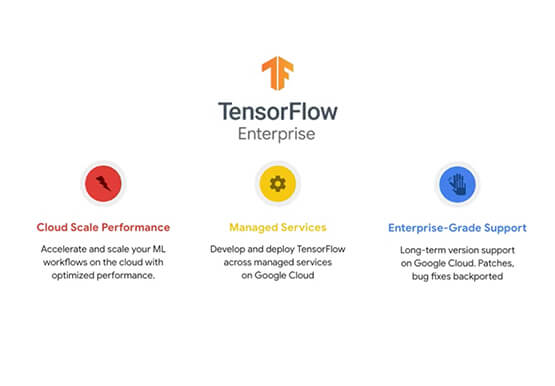
Machine learning is transforming every aspect of our lives and developers and enterprises are using ML to build impactful solutions that drive business value. TensorFlow is one of the most widely used production-ready frameworks for machine learning and it's open-sourced by Google so that everyone can take advantage of these
