





Mid-Sized B2B Firm Achieves the Business Trifecta with a Single Strategy

6900
Of your peers have already read this article.
2:45 Minutes
The most insightful time you'll spend today!
Thirteen years’ experience in e-commerce has given Teddy Chan, Chief Executive Officer and Chief Technology Officer, AfterShip, a deep understanding of the challenges of shipping and tracking packages to customers worldwide.
“The key problem many merchants face is customers asking ‘where is my order?’ and ‘when I will get the package?’” Chan says. “When I considered this issue, I came up with the idea of AfterShip.” Chan helped found AfterShip in 2011 to enable merchants to keep track of packages sent to customers via a web portal or an API. AfterShip also allows merchants to notify customers of anticipated delivery times.
“Using AfterShip, merchants can provide the same experience to buyers regardless of which couriers they use,” Chan says. “Merchants can also improve their customer engagement by including up-selling or marketing content with their delivery notifications.”
Hong Kong-headquartered AfterShip continues to grow quickly and now has a 40-person team. Thirty members of this team are based on the China special administrative region and 10 are based in India.
“Google Cloud Platform has a network of global datacentres with deep connectivity that enables us to put our infrastructure close to our customers. In addition, the ability to horizontally scale our global database using tools such as Google Cloud Spanner eliminates any limits on our geographic expansion.”
—Teddy Chan, Chief Executive Officer and Chief Technology Officer, AfterShip
By October 2017, the business was tracking about 30 million packages per month and had expanded its services to include label and rate calculation and self-service return. Revenue, package transaction numbers and team size have doubled every year for the past three years, while more than 300,000 merchants and 426 couriers are signed up to the service. Key customers include Wish, Etsy and Groupon.
Close to half AfterShip’s customers are based in the United States, about one third in Europe and the remainder are located in Asia. AfterShip had initially delivered its applications and services from an incumbent public cloud service. However, the company wanted to continue its growth trajectory while automating key infrastructure processes, implementing a continuous deployment model and controlling costs.
The business needed to achieve these objectives while maintaining a global presence and high-quality service. AfterShip started reviewing its options and decided to migrate to Google Cloud Platform (GCP). “Google Cloud Platform has a network of global datacentres with deep connectivity that enables us to place our infrastructure close to our customers,” Chan says.
“In addition, the ability to horizontally scale our global database using tools such as Google Cloud Spanner eliminates any limits to our geographic expansion. Furthermore, the managed services provided through GCP would allow us to focus on building better features for online merchants.” The reliability provided by GCP would also enable AfterShip to meet the stringent service level requirements of large digital marketplaces in the United States, Asia and elsewhere.
“Google Cloud Platform could manage the high volumes and enable us to deliver the service levels that would realise our ambition of becoming the number one tracking API platform in the world,” Chan says. “For example, with Google Cloud Platform, we can provide a 99.95% monthly uptime service level to our customers.” Finally, GCP provided managed solutions, including Google Kubernetes Engine powered by open source container orchestrator Kubernetes, that would enable AfterShip to automate processes such as scaling and enable its team to focus on developing applications.
AfterShip has moved its websites into GCP infrastructure in three datacentres around the world and anticipates completing the migration in Q4 2017. “Google provided a lot of assistance, particularly early in the project when we needed it,” Chan says. “They briefed us on several services we hadn’t known about that could replace the equivalents in the public cloud we were using previously.” The business then completed the migration using its own skilled team members. As well as Google Kubernetes Engine and Google Cloud Spanner, AfterShip is using Google BigQuery to store and analyse transaction information.
“Google Cloud Platform could manage the high volumes and enable us to deliver the service levels that would realise our ambition of becoming the number one tracking API platform in the world.”
—Teddy Chan, Chief Executive Officer and Chief Technology Officer, AfterShip
Deployment times down from one hour to two minutes
With deployment times falling from up to one hour in its previous cloud environment to about two minutes in GCP, AfterShip has been able to adopt a continuous deployment model. “This has improved our service levels,” Chan says. “If there are any issues we can fix them quickly, while we can iterate faster to create new features in response to customer requests or changes in the market. “This enables us to continue to lead our competitors.”
Targeting a 30 percent reduction in costs
AfterShip is now targeting a 30% reduction in costs by optimising its use of Docker containerisation technology on GCP.
“By using Docker with Kubernetes, we have been able to fine-tune our use of compute resources and better control our costs,” Chan says. “We’re extremely pleased with Google Cloud Platform as it really is built for engineers,” he adds. “In addition, its documentation is extremely clear, allowing us to troubleshoot or carry out activities on the platform ourselves. “We look forward to continuing to grow and extend our package tracking and associated services with Google Cloud Platform.”
Architecting Multi-region Database Disaster Recovery for MySQL
4093
Of your peers have already read this article.
4:30 Minutes
The most insightful time you'll spend today!
Enterprises expect extreme reliability of the database infrastructure that’s accessed by their applications. Despite your best intentions and careful engineering, database errors happen, whether that’s machine crashes or network partitioning. Good planning can help you stay ahead of problems and recover more quickly when issues do occur.
This blog shows one approach of deploying a database architecture that implements high availability and disaster recovery for MySQL on Compute Engine, using regional disks as well as load balancers.
Any database architecture must provide approaches to tolerate errors and recover from those errors quickly without losing data. These approaches are expressed in RTO (recovery time objective) and RPO (recovery point objective), which offer ways to set and then measure how long a service can be unavailable, and how far back data should be saved.
After a database error, a database must recover as fast as possible with an RTO as small as possible, ideally in seconds. There must be as little data loss as possible—ideally, none at all. The desired RPO is the last consistent database state.
From a database architecture and deployment viewpoint, this can be accomplished with two distinct concepts: high availability and disaster recovery. Use both at the same time in order to achieve an architecture that’s prepared for the widest range of errors or incidents.
Creating a resilient database architecture
A high-availability database architecture has database instances in two or more zones. If a server on a zone fails, or the zone becomes inaccessible, the instances in other zones are available to continue the processing. The figure below shows two instances, one in zone zn1, and one in zone zn2. The load balancer in front supports directing traffic to a healthy database instance available for read and write queries.
A disaster recovery architecture adds a second high-availability database setup in a second region. If one of the regions becomes inaccessible or fails, the other region takes over. The figure below shows two regions, primary and DR. Data is replicated from the primary to the DR region so that the DR region can take over from the latest consistent database state. The load balancer in front of the regions directs traffic to the region in charge of the read and write traffic. Here’s how this architecture looks:
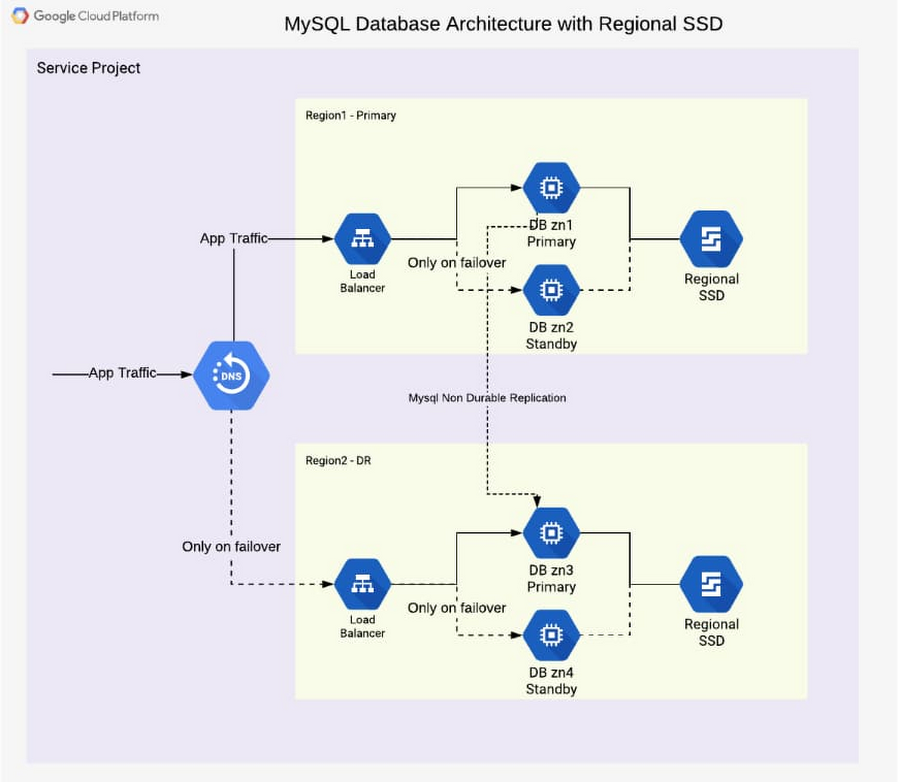
In addition to the database instance setup, a regional disk is deployed so that data is written simultaneously in two zones, proving fail-safe in the event of zone failure. This is a huge advantage of Google Cloud, allowing you to skip MySQL-level replication within a region. Each write operation to disk is done in two zones synchronously. When the primary instance fails, a standby instance is mounted with regional persistent disk(s), and the database service (MySQL) is then started using the same. This brings the peace of mind of not worrying about replication lag or database state for high availability.
From a disaster recovery process view, the following happens over time during a failure situation:
- Normal steady state database operation
- A failure happens and a region becomes unavailable or the database instance inaccessible
- A decision must be made to fail over or not (in case there is the expectation that the region becomes available soon enough or the instance becomes responsive again)
- DNS is updated manually, therefore it redirects application traffic to a second region
- Fallback to the primary region after it becomes available again is optional, as the second region is a fully built-out deployment
From a high-availability process view, the following happens over time during a failure situation:
- Normal steady state database operation
- Database instance fails or becomes unavailable
- Launch the standby instance
- Mount regional SSD and start database
- Automatic redirection of application traffic to the standby via load balancer
- After the failed or unavailable instance becomes available again, a fallback can take place or not
The database architecture shown demonstrates a highly available architecture supporting disaster recovery. With regional disks and load balancers, it is straightforward to provide a resilient database deployment.
Find out more about load balancers and regional disks. Check out general HA and DR processes and detailed steps in the initial part of the reference guide. Try it out to become familiar with the architecture as well as the two major failover processes.
How Deutsche Bank used Cloud Composer to orchestrate workloads for financial services

2978
Of your peers have already read this article.
3:30 Minutes
The most insightful time you'll spend today!
Running time-based, scheduled workflows to implement business processes is regular practice at many financial services companies. This is true for Deutsche Bank, where the execution of workflows is fundamental for many applications across its various business divisions, including the Private Bank, Investment and Corporate Bank as well as internal functions like Risk, Finance and Treasury. These workflows often execute scripts on relational databases, run application code in various languages (for example Java), and move data between different storage systems. The bank also uses big data technologies to gain insights from large amounts of data, where Extract, Transform and Load (ETL) workflows running on Hive, Impala and Spark play a key role.
Historically, Deutsche Bank used both third-party workflow orchestration products and open-source tools to orchestrate these workflows. But using multiple tools increases complexity and introduces operational overhead for managing underlying infrastructure and workflow tools themselves.
Cloud Composer, on the other hand, is a fully managed offering that allows customers to orchestrate all these workflows with a single product. Deutsche Bank recently began introducing Cloud Composer into its application landscape, and continues to use it in more and more parts of the business.
“Cloud Composer is our strategic workload automation (WLA) tool. It enables us to further drive an engineering culture and represents an intentional move away from the operations-heavy focus that is commonplace in traditional banks with traditional technology solutions. The result is engineering for all production scenarios up front, which reduces risk for our platforms that can suffer from reactionary manual interventions in their flows. Cloud Composer is built on open-source Apache Airflow, which brings with it the promise of portability for a hybrid multi-cloud future, a consistent engineering experience for both on-prem and cloud-based applications, and a reduced cost basis.
We have enjoyed a great relationship with the Google team that has resulted in the successful migration of many of our scheduled applications onto Google Cloud using Cloud Composer in production.” – Richard Manthorpe, Director Workload Automation, Deutsche Bank
Why use Cloud Composer in financial services
Financial services companies want to focus on implementing their business processes, not on managing infrastructure and orchestration tools. In addition to consolidating multiple workflow orchestration technologies into one and thus reducing complexity, there are a number of other reasons companies choose Cloud Composer as a strategic workflow orchestration product.
First of all, Cloud Composer is significantly more cost-effective than traditional workflow management and orchestration solutions. As a managed service, Google takes care of all environment configuration and maintenance activities. Cloud Composer version 2 introduces autoscaling, which allows for an optimized resource utilization and improved cost control, since customers only pay for the resources used by their workflows. And because Cloud Composer is based on open source Apache Airflow, there are no license fees; customers only pay for the environment that it runs on, adjusting the usage to current business needs.
Highly regulated industries like financial services must comply with domain-specific security and governance tools and policies. For example, Customer-Managed Encryption Keys ensure that data won’t be accessed without the organization’s consent, while Virtual Private Network Service Controls mitigate the risk of data exfiltration. Cloud Composer supports these and many other security and governance controls out-of-the box, making it easy for customers in regulated industries to use the service without having to implement these policies on their own.
The ability to orchestrate both native Google Cloud as well as on-prem workflows is another reason that Deutsche Bank chose Cloud Composer. Cloud Composer uses Airflow Operators (connectors for interacting with outside systems) to integrate with Google Cloud services like BigQuery, Dataproc, Dataflow, Cloud Functions and others, as well as hybrid and multi-cloud workflows. Airflow Operators also integrate with Oracle databases, on-prem VMs, sFTP file servers and many others, provided by Airflow’s strong open-source community.
And while Cloud Composer lets customers consolidate multiple workflow orchestration tools into one, there are some use cases where it’s just not the right fit. For example, if customers have just a single job that executes once a day on a fixed schedule, Cloud Scheduler, Google Cloud’s managed service for Cron jobs, might be a better fit. Cloud Composer in turn excels for more advanced workflow orchestration scenarios.
Finally, technologies based on open source technologies also provide a simple exit strategy from cloud — an important regulatory requirement for financial services companies. With Cloud Composer, customers can simply move their Airflow workflows from Cloud Composer to a self-managed Airflow cluster. Because Cloud Composer is fully compatible with Apache Airflow, the workflow definitions stay exactly the same if they are moved to a different Airflow cluster.
Cloud Composer applied
Having looked at why Deutsche Bank chose Cloud Composer, let’s dive into how the bank is actually using it today. Apache Airflow is well-suited for ETL and data engineering workflows thanks to the rich set of data Operators (connectors) it provides. So Deutsche Bank, where a large-scale data lake is already in place on-prem, leverages Cloud Composer for its modern Cloud Data Platform, whose main aim is to work as an exchange for well-governed data, and enable a “data mesh” pattern.
At Deutsche Bank, Cloud Composer orchestrates the ingestion of data to the Cloud Data Platform, which is primarily based on BigQuery. The ingestion happens in an event-driven manner, i.e., Cloud Composer does not simply run load jobs based on a time-schedule; instead it reacts to events when new data such as Cloud Storage objects arrives from upstream sources. It does so using so-called Airflow Sensors, which continuously watch for new data. Besides loading data into BigQuery, Composer also schedules ETL workflows, which transform data to derive insights for business reporting.
Due to the rich set of Airflow Operators, Cloud Composer can also orchestrate workflows that are part of standard, multi-tier business applications running non-data-engineering workflows. One of the use cases includes a swap reporting platform that provides information about various asset classes, including commodities, credits, equities, rates and Forex. In this application, Cloud Composer orchestrates various services implementing the business logic of the application and deployed on Cloud Run — again, using out-of-the-box Airflow Operators.
These use cases are already running in production and delivering value to Deutsche Bank. Here is how their Cloud Data Platform team sees the adoption of Cloud Composer:
“Using Cloud Composer allows our Data Platform team to focus on creating Data Engineering and ETL workflows instead of on managing the underlying infrastructure. Since Cloud Composer runs Apache Airflow, we can leverage out of the box connectors to systems like BigQuery, Dataflow, Dataproc and others, making it well-embedded into the entire Google Cloud ecosystem.”—Balaji Maragalla, Director Big Data Platforms, Deutsche Bank
Want to learn more about how to use Cloud Composer to orchestrate your own workloads? Check out this Quickstart guide or Cloud Composer documentation today.
Case Study: When Database Choice Powers New Revenue-driving Product Features

4163
Of your peers have already read this article.
4:30 Minutes
The most insightful time you'll spend today!
Editor’s note: Streak makes a CRM add-on for Gmail, and recently adopted Cloud Spanner to take advantage of its scalability and SQL capabilities to implement a graph data model. Read on to learn about their decision, what they love about the system, and the ways in which it still needs work.]
Streak is a customer relationship management (CRM) tool built directly into Gmail. It is used for sales, marketing, hiring, and just about anything else you can think of.
We built it because out of the box, email is actually a really crummy team sharing system. By adding a layer of organization on top of email, Streak lets you add email threads directly into its spreadsheet view, making it useful as a workflow tool with capabilities including task creation, email template management, and easy data entry.
Streak has been integrated with G Suite (originally Google Apps For Your Domain) since its inception so when choosing a cloud, it made sense to colocate our server stack with Google Cloud.
Likewise, Streak was on Google App Engine from the start, and we slowly added other GCP services as the offerings improved or as our use cases became more complex.
In addition to App Engine, we use Google Kubernetes Engine to run a bunch of our compute workload, including both application servers and our offline processes like indexers and task queue consumers.
We use Cloud Dataflow for both streaming event processing and logs ETL, and BigQuery for all of our analytics queries. We use Cloud Pub/Sub for interacting with the Gmail watch API, as well as Stackdriver (logging, tracing, monitoring, errors) and OpenCensus to dig into any operational issues as they arise.
Then, on the database front, we recently started using Cloud Spanner, Google Cloud’s scalable relational database service. Before that, we stored most of our business data in Cloud Datastore, Google Cloud’s NoSQL document database.
Partially, that was historical, since Cloud Datastore was GCP’s only managed database when we wrote the Streak backend. And we’ve been very happy with how easy Cloud Datastore is to maintain. Between Google App Engine and Cloud Datastore, we’ve never had to have an explicit infrastructure on-call rotation.
But as more users rely on Streak to collaborate with larger and larger teams, we were feeling the pain of not having a fully relational database. We found ourselves having to manually join data in our application, which increased application latency and increased the time developers spent coding workarounds and debugging that complexity.
We found we needed two things out of our database: a scalable relational store and a graph store that could power next-gen Streak features. At the same time, we wanted a single database that could handle both use cases and wouldn’t increase our operational burden. This meant finding a managed service to give us more query flexibility, so we decided to give Cloud Spanner a try.
Of course, we didn’t want to migrate our existing stack to a new data platform without first testing it out (never a smart strategy). But since most of our existing data model required transactional updates with other entities, pulling out a single entity to test was challenging. We did have a feature in our pipeline that necessitated a graph data store and that was removed from our other data: our email metadata indexing system.
How your client software handles email metadata indexing can make or break the useability of a system. Think about how many times somebody forgets to reply-all or that you receive a forwarded thread with thirty emails in reverse-chronological order. Within our own inboxes, we rely on Gmail’s UI to nicely organize email threads, but that organization breaks down when working with a team or across organizational boundaries.
We decided to fix that in the Streak product by organizing metadata (i.e., headers but not message content) from users’ email by using Cloud Spanner as a graph database. Using a graph database lets us answer questions like “What are all the emails on this thread in the inboxes of everybody on my team?” and “Who on my team has previously talked with the organization that this prospect works at?”
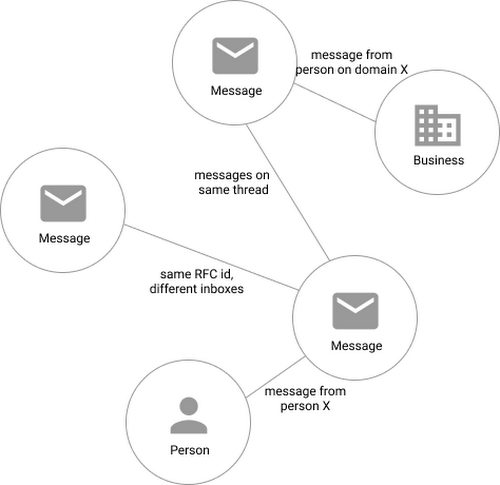
In our model, the nodes of the graph are either an email message, a person (email address) or a company (a domain). Then we have four different types of “edges”— properties by which nodes in a graph connect to one another:
- Message to message (thread): messages that are on the same thread have an edge between them. The reason we do this is because we want to show users a list of threads to answer their questions, not messages, so we need to be able to get the spanning set of messages.
- Message to message (same RFC id): A core value proposition of Streak is being able to see the “unified” version of a thread that shows each person on a team’s version of the email thread. To make sure we are getting each user’s version of a thread when we issue a query, there needs to be an edge between a message in the queryer’s inbox and the same message in their team’s inbox. In case you’re curious, Streak uses the RFC message id to determine that two messages across inboxes are actually the same.
- Email address to message: a message has an edge to an email address if it was either the from, to, cc, or bcc on the message. This edge is crucial for queries that start with: “Show me all threads between this person and our team.”
Domain to message: a message has an edge to a domain if the domain is present in any of the from, to, cc, or bcc addresses on the message. This edge is similarly used for queries that start with “Show me all threads between this company and our team.”
Using Cloud Spanner’s distributed SQL capabilities and scalability to build a graph database also let us answer the important follow-up question: “Which threads have I been granted permission to view?” And while a lot of these questions could be answered per-user by a traditional relational database, scale limitations have to be taken into consideration, especially as we plan for 10x or more data volume growth as both our user base grows and as their inboxes accumulate more emails. A graph database model is simply a better fit for Streak’s collaboration model with many-to-many mappings between users and teams, and will allow us to query the data in any number of configurations, without worrying about scale limitations or having to manually shard a relational database. Cloud Spanner gives us queryability and scalability.
Taking the Cloud Spanner plunge
With so many advantages to it, we went ahead and began building out our metadata system with Cloud Spanner as a back-end.
Adopting Cloud Spanner has been great. Here are some of the high points:
- The fast distributed queries and transactions are absolutely real. We have global indexes across our entire dataset and we haven’t had to spend very much time at all thinking about co-locating data. In particular, we only use interleaved tables for values that would be repeated fields in Cloud Datastore, and that hasn’t been a problem for us yet.
- We haven’t had any reliability problems whatsoever, despite averaging 20K writes/sec in steady state.
- Once we optimized our queries on realistic data, Cloud Spanner scaled up in a surprisingly predictable way. You need to run queries after you’ve populated data, do the explain to figure out how the query planner is executing the query, and add indexes/modify queries to make sure they’re performant.
- Compared to the hoops some traditional relational databases make you jump through, Cloud Spanner’s online schema changes and index builds are magical. There is no downtime for these operations.
Overall, the experience has been encouraging, and we’re planning to move 20 TB of existing data in Cloud Datastore to Cloud Spanner as well. We built out an ORM library for Java on top of Cloud Spanner called Ratchet and are testing a framework for dual-writing entities to both Cloud Datastore and Cloud Spanner to support the rest of the migration. We now store about 40 TB of email metadata in Cloud Spanner, which makes us a large user of Cloud Spanner.
In short, if you’re starting to outgrow your NoSQL database, and want to move to a managed SQL database, give Cloud Spanner a try. You definitely want to model out your costs and try out a proof of concept, both to see how it works on your workload and to get familiar with the quirks of the system. But you don’t need to spend much time worrying about the reliability of the product: it’s there.
Simplifying Unstructured Data Analytics with BigQuery ML and Vertex AI: A Comprehensive Guide

1541
Of your peers have already read this article.
6:30 Minutes
The most insightful time you'll spend today!
Unstructured data such as images, speech and textual data can be notoriously difficult to manage, and even harder to analyze. The analysis of unstructured data includes use cases such as extracting text from images using OCR, sentiment analysis on customer reviews and simplifying translation for analytics. All of this data needs to be stored, managed and made available for machine learning.
The new BigQuery ML inference engine empowers practitioners to run inferences on unstructured data using pre-trained AI models. The results of these inferences can be analyzed to extract insights and improve decision making. This can all be done in BigQuery, using just a few lines of SQL.
In this blog, we’ll explore how the new BigQuery ML inference engine can be used to run inferences against unstructured data in BigQuery. We’ll demonstrate how to detect and translate text from movie poster images, and run sentiment analysis against movie reviews.
BigQuery ML’s new inference engine
Google Cloud is home to a suite of pre-trained AI models and APIs. The BigQuery ML inference engine can call these APIs and manage the responses on your behalf. All you have to do is define the model you want to use and run inferences against your data. All of this is done in BigQuery using SQL. The inference results are returned in JSON format and stored in BigQuery for analysis.
Why run your inferences in BigQuery?
Traditionally, working with AI models to run inferences required expertise in programming languages like Python. The ability to run inferences in BigQuery using just SQL can make generating insights from your data using AI simple and accessible. BigQuery is also serverless, so you can focus on analyzing your data without worrying about scalability and infrastructure.
The inference results are stored in BigQuery, which allows you to analyze your unstructured data immediately, without the need to move or copy your data. A key advantage here is that this analysis can also be joined with structured data stored in BigQuery, giving you the opportunity to deepen your insights. This can simplify data management and minimize the amount of data movement and duplication required.
Which models are supported?
For now, the BigQuery ML inference engine can be used with these pre-trained Vertex AI models:
- Vision AI API: This model can be used to extract features from images managed by BigQuery Object Tables and stored on Cloud Storage. For example, Vision AI can detect and classify objects, or read handwritten text.
- Translation AI API: This model can be used to translate text in BigQuery tables into over one hundred languages.
- Natural Language Processing API: This model can be used to derive meaning from textual data stored in BigQuery tables. For example, features like sentiment analysis can be used to determine whether the emotional tone of text is positive or negative.
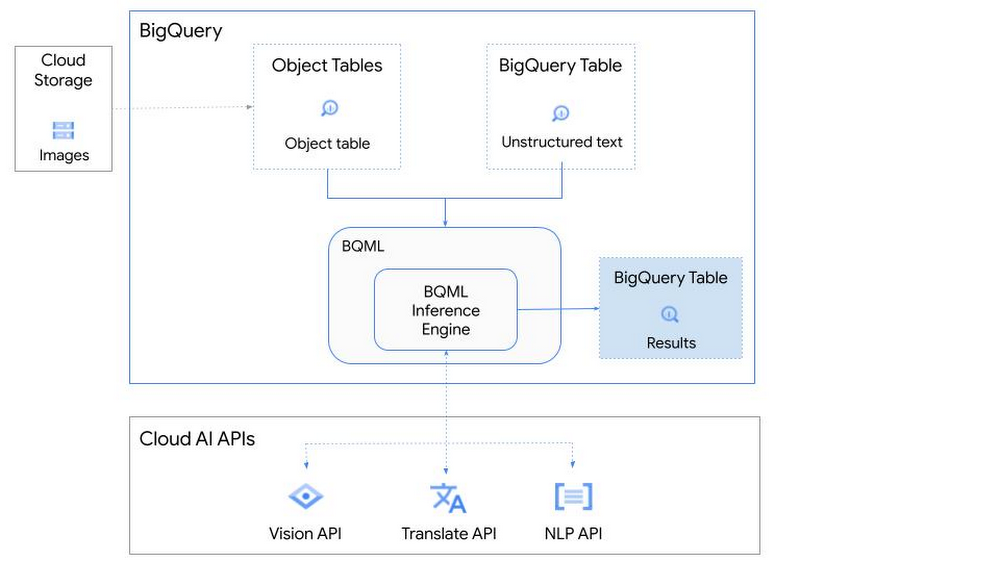
So, how does this work in practice? Let’s look at an example using images of movie posters

- We will define our pre-trained models for Vision AI, Translation AI and NLP AI in BigQuery ML.
- We’ll then use Vision AI to detect the text from some classic movie posters images.
- Next, we’ll use Translation AI to detect any foreign posters and translate them to a language of our choosing – English in this case.
- Finally, we’ll combine our unstructured data with structured data in BigQuery.
We’ll use the extracted movie titles from our movie posters to look up the viewer reviews from the BigQuery IMDB public dataset. We can then run sentiment analysis against these reviews using NLP AI.
Note: The BigQuery ML inference engine is currently in Preview. You will need to complete this enrollment form to have your project allowlisted for use with the BQML Inference Engine.
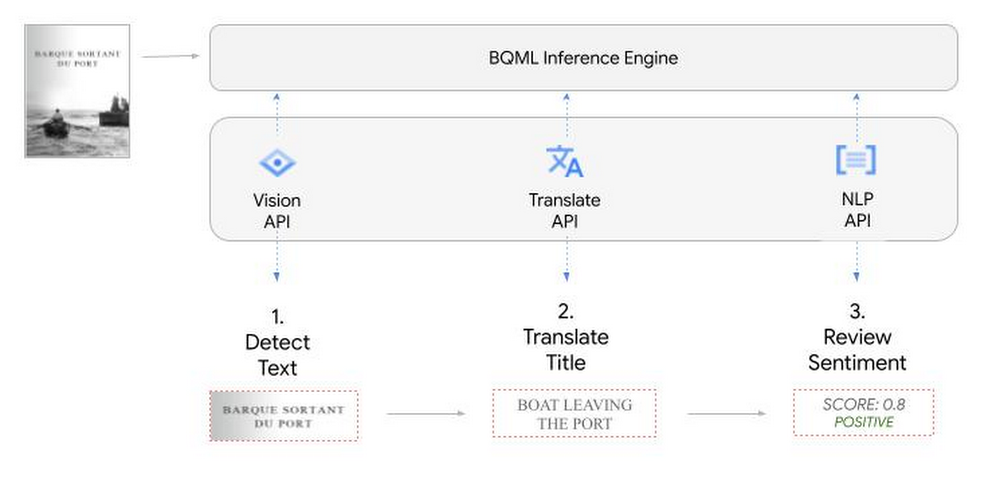
We’ll give examples of the BigQuery SQL needed to define your models and run your inferences. You’ll want to check out our notebook for a detailed guide on how to get this up and running in your Google Cloud project.
1. Define your AI Models in BigQuery
You will need to enable the APIs listed below, and also create a Cloud resource connection to enable BigQuery to interact with these services.
| API | Model Name |
| Vision AI API | Cloud_ai_vision_v1 |
| Translation AI API | Cloud_ai_translate_v3 |
| NLP AI API | Cloud_ai_natural_language_v1 |
You can then run the CREATE MODEL query for each AI service to create your pretrained models, replacing the model_name as required.
CREATE OR REPLACE MODEL
`{PROJECT_ID}.{DATASET_ID}.{VISION_MODEL_NAME}`
REMOTE WITH
CONNECTION `{PROJECT_ID}.{REGION}.{CONN_NAME}`
OPTIONS ( remote_service_type = '<model_name>' );
2. Use the Vision AI API to detect text in images stored in Cloud Storage
You will need to create an object table for your images in Cloud Storage. This read-only object table provides metadata for images stored in Cloud Storage:
CREATE OR REPLACE EXTERNAL TABLE
`{PROJECT_ID}.{DATASET_ID}.{OBJECT_TABLE_NAME}`
WITH
CONNECTION `{REGION}.{CONN_NAME}`
OPTIONS (object_metadata = 'SIMPLE', uris = ['{BUCKET_LOCATION}/*']);
To detect the text from our posters, you can then use ML.ANNOTATE_IMAGE and specify the text_detection feature.
SELECT
       ml_annotate_image_result.full_text_annotation.text AS text_content,
       *
FROM
       ML.ANNOTATE_IMAGE(
         MODEL `{PROJECT_ID}.{DATASET_ID}.{VISION_MODEL_NAME}`,
         TABLE `{DATASET_ID}.{OBJECT_TABLE_NAME}`,
         STRUCT(['TEXT_DETECTION'] AS vision_features));
A JSON response will be returned to BigQuery that includes the text content and language code of the text. You can parse the JSON to a scalar result using the dot annotation highlighted above.

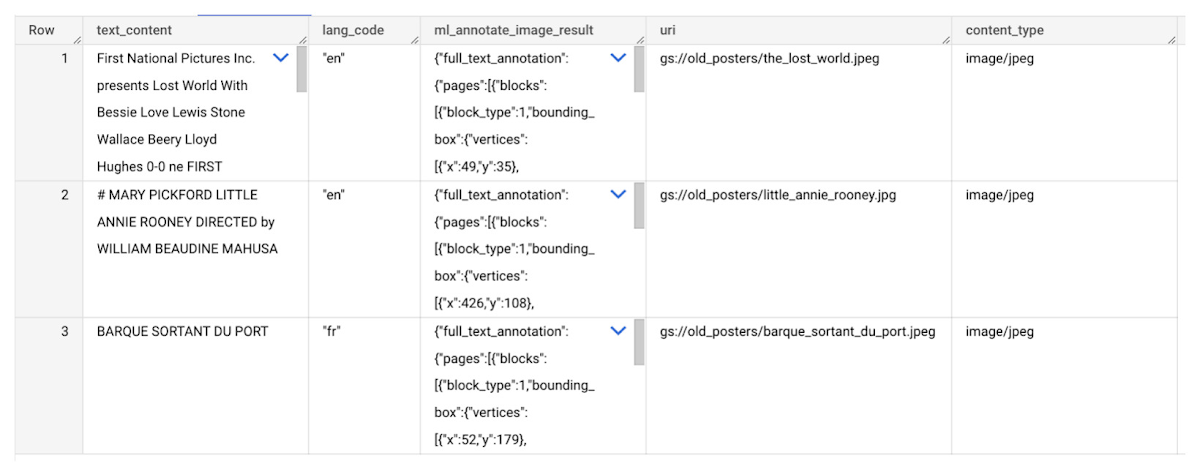
3. Use the Translation AI API to translate foreign movie titles
ML.TRANSLATE can now be used to translate the foreign titles we’ve extracted from our images into English. You just need to specify the target language and the table of the movie posters for translation:
SELECT
text_content,
STRING(ml_translate_result.translations[0].detected_language_code)
as original_language,
STRING(ml_translate_result.translations[0].translated_text)
as translated_title
FROM
  ML.TRANSLATE(
MODEL `{PROJECT_ID}.{DATASET_ID}.{TRANSLATE_MODEL_NAME}`,
TABLE `{DATASET_ID}.image_results`,
STRUCT('TRANSLATE_TEXT' as translate_mode, "en" as target_language_code));
Note: The table column with the text you want to translate must be named text_content:
The table of results will include json that can be parsed to extract both the original language and the translated text. In this case, the model has detected that title text is in French and has translated it to English:

4. Finally, use natural language processing (NLP) to run sentiment analysis against movie reviews
You can easily join inference results from your unstructured data with other BigQuery datasets to bolster your analysis. For example, we can now join the movie titles we extracted from our posters with thousands of movie reviews stored in BigQuery’s IMDB public dataset `bigquery-public-data.imdb.reviews`.
You can use ML.UNDERSTAND_TEXT with the analyze_sentiment feature to run sentiment analysis against some of these reviews to determine whether they are positive or negative:
SELECT
   primary_title, start_year, text_content AS review,
   FLOAT64(ml_understand_text_result.document_sentiment.score) AS score,
   FLOAT64(ml_understand_text_result.document_sentiment.magnitude) AS magnitude,
FROM
   ML.UNDERSTAND_TEXT(
     MODEL `{PROJECT_ID}.{DATASET_ID}.{NLP_MODEL_NAME}`,
           (
           SELECT
             primary_title, start_year, review AS text_content
           FROM
             `bigquery-public-data.imdb.title_basics` titles
           JOIN
             `bigquery-public-data.imdb.reviews` reviews
           ON
             reviews.movie_id = titles.tconst
           WHERE
             UPPER(titles.primary_title) = 'THE LOST WORLD' AND
             start_year = 1925
           ),
      STRUCT("analyze_sentiment" AS nlu_option)) ;
Note: The table column with the text you want to analyze must be named text_content:
The JSON response will include a score and magnitude. The score indicates the overall emotion of the text while the magnitude indicates how much emotional content is present:
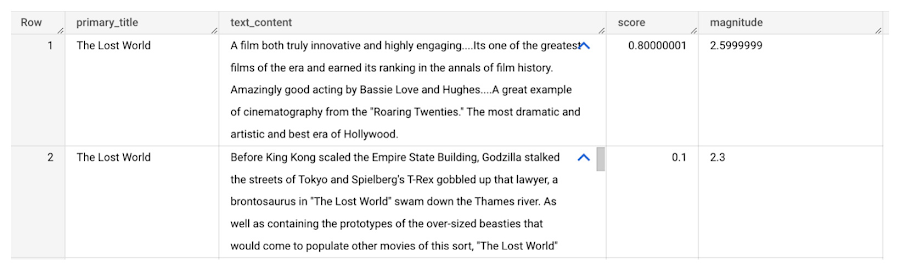
So, how did the Lost World compare with other movies that year?
To wrap up, we’ll compare the average review score of the 1925 Lost World movie to other movies released that year to see which was more popular. This can be done using familiar SQL analysis:
SELECT
 primary_title, start_year,
 AVG(FLOAT64(ml_understand_text_result.document_sentiment.score))AS av_score,
 AVG(FLOAT64(ml_understand_text_result.document_sentiment.magnitude)) AS av_magnitude
FROM
 ML.UNDERSTAND_TEXT(
   MODEL `{PROJECT_ID}.{DATASET_ID}.{NLP_MODEL_NAME}`,
         (
         SELECT
           primary_title, start_year, movie_id, review AS text_content
         FROM
           `bigquery-public-data.imdb.title_basics` titles
         JOIN
           `bigquery-public-data.imdb.reviews` reviews
         ON
           reviews.movie_id = titles.tconst
         WHERE
           start_year = 1925
         ),
   STRUCT("analyze_sentiment" AS nlu_option))
GROUP BY
   primary_title, start_year
ORDER BY
   av_score DESC;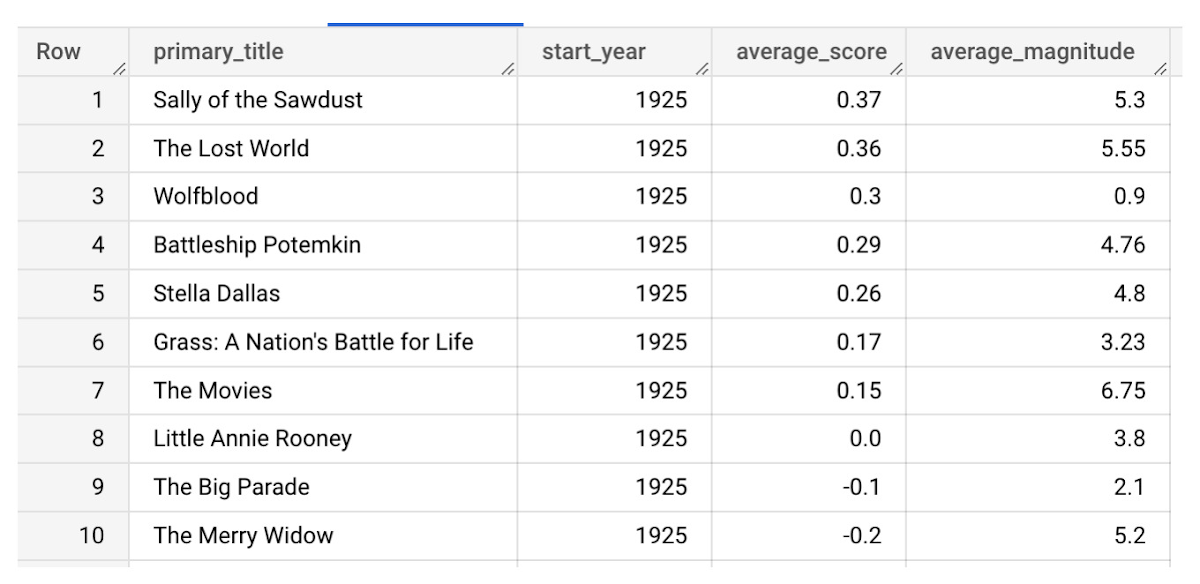
It looks like The Lost World narrowly missed out on the top spot to Sally of the Sawdust!
Want to learn more?
Check out our notebook for a step by step guide on using the BQML inference engine for unstructured data in Google Cloud. You can also check out our Cloud AI service table-valued functions overview page for more details. Curious about pricing? The BQML Pricing page gives a breakdown of how costs are applied across these services.
Updating Twitter’s Ad Engagement Analytics Platform for the Modern Age

3097
Of your peers have already read this article.
3:30 Minutes
The most insightful time you'll spend today!
As part of the daily business operations on its advertising platform, Twitter serves billions of ad engagement events, each of which potentially affects hundreds of downstream aggregate metrics. To enable its advertisers to measure user engagement and track ad campaign efficiency, Twitter offers a variety of analytics tools, APIs, and dashboards that can aggregate millions of metrics per second in near-real time.
In this post, you’ll get details on how the Twitter Revenue Data Platform engineering team, led by Steve Niemitz, migrated their on-prem architecture to Google Cloud to boost the reliability and accuracy of Twitter’s ad analytics platform.
Deciding to migrate
Over the past decade, Twitter has developed powerful data transformation pipelines to handle the load of its ever-growing user base worldwide. The first deployments for those pipelines were initially all running in Twitter’s own data centers. The input data streamed from various sources into Hadoop Distributed File System (HDFS) as LZO-compressed Thrift files in an Elephant Bird container format. The data was then processed and aggregated in batches by Scalding data transformation pipelines. Then, aggregation results were output into Manhattan, Twitter’s homegrown distributed key-value store, for serving. Additionally, a streaming system using Twitter’s homegrown systems Eventbus (a messaging tool built on top of DistributedLog), Heron (a stream processing engine), and Nighthawk (a sharded Redis deployment) powered the real-time analytics that Twitter had to provide, filling the gap between the current time and the last batch run.
While this system consistently sustained massive scale, its original design and implementation was starting to reach some limits. In particular, some parts of the system that had grown organically over the years were difficult to configure and extend with new features. Some intricate, long-running jobs were also unreliable, leading to sporadic failures. The legacy end-user serving system was very expensive to run and couldn’t support large queries.
To accommodate for the projected growth in user engagement over the next few years and streamline the development of new features, the Twitter Revenue Data Platform engineering team decided to rethink the architecture and deploy a more flexible and scalable system in Google Cloud.
Platform modernization: First iteration
In the middle of 2017, Steve and his team tackled the first redesign iteration of its advertising data platform modernization, leading to Twitter’s collaboration with Google Cloud.
At first, the team left the data aggregation legacy Scalding pipelines unchanged and continued to run them in Twitter’s data centers. But the batch layer’s output was switched from Manhattan to two separate storage locations in Google Cloud:
- BigQuery—Google’s serverless and highly scalable data warehouse, to support ad-hoc and batch queries.
- Cloud Bigtable—Google’s low-latency, fully managed NoSQL database, to serve as a back end for online dashboards and consumer APIs.
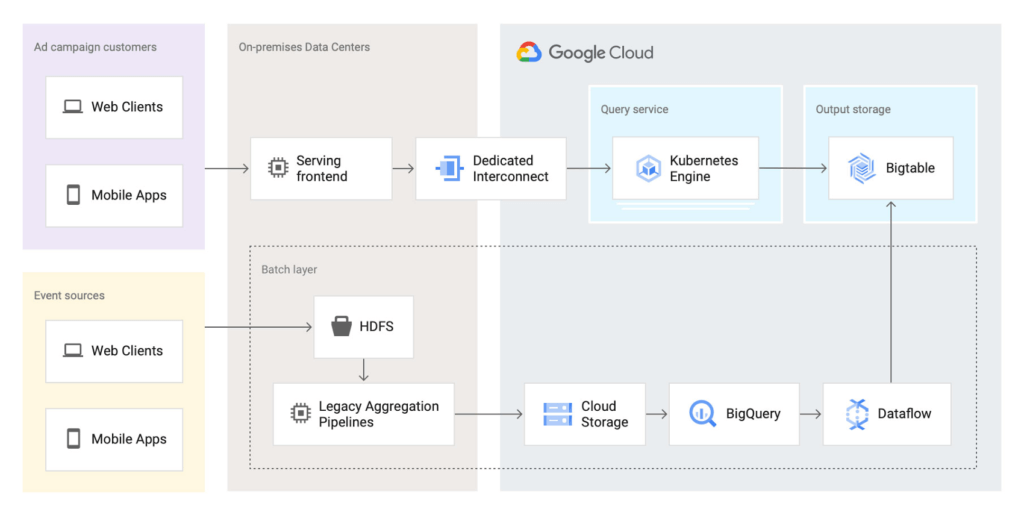
The output aggregations from the Scalding pipelines were first transcoded from Hadoop sequence files to Avro on-prem, staged in four-hour batches to Cloud Storage, and then loaded into BigQuery. A simple pipeline deployed on Dataflow, Google Cloud’s fully managed streaming and batch analytics service, then read the data from BigQuery and applied some light transformations. Finally, the Dataflow pipeline wrote the results into Bigtable.
The team built a new query service to fetch aggregated values from Bigtable and process end-user queries. They deployed this query service in a Google Kubernetes Engine (GKE) cluster in the same region as the Bigtable instance to optimize for data access latency.
Here’s a look at the architecture:
This first iteration already brought many important benefits:
- It de-risked the overall migration effort, letting Twitter avoid migrating both the aggregation business logic and storage at the same time.
- The end-user serving system’s performance improved substantially. Thanks to Bigtable’s linear scalability and extremely low latency for data access, the serving system’s P99 latencies decreased from 2+ seconds to 300ms.
- Reliability increased significantly. The team now rarely, if ever, gets paged for the serving system anymore.
Platform modernization: second iteration
With the new serving system in place, in 2019 the Twitter team began to redesign the rest of the data analytics pipeline using Google Cloud technologies. The redesign sought to solve several existing pain points:
- Because the batch and streaming layers ran on different systems, much of the logic was duplicated between systems.
- While the serving system had been moved into the cloud, the existing pain points of the Hadoop aggregation process still existed.
- The real-time layer was expensive to run and required significant operational attention.
With these pain points in mind, the team began evaluating technologies that could help solve them. They considered several open-source stream processing frameworks initially: Apache Flink, Apache Kafka Streams, and Apache Beam. After evaluating all possible options, the team chose Apache Beam for a few key reasons:
- Beam’s built-in support for exactly-once operations at extremely large scale across multiple clusters.
- Deep integration with other Google Cloud products, such as Bigtable, BigQuery, and Pub/Sub, Google Cloud’s fully managed, real-time messaging service.
- Beam’s programming model, which unifies batch and streaming and lets a single job operate on either batch inputs (Cloud Storage), or streaming inputs (Pub/Sub).
- The ability to deploy Beam pipelines on Dataflow’s fully managed service.
The combination of Dataflow’s fully managed approach and Beam’s comprehensive feature set let Twitter simplify the structure of its data transformation pipeline, as well as increase overall data processing capacity and reliability.
Here’s what the architecture looks like after the second iteration:
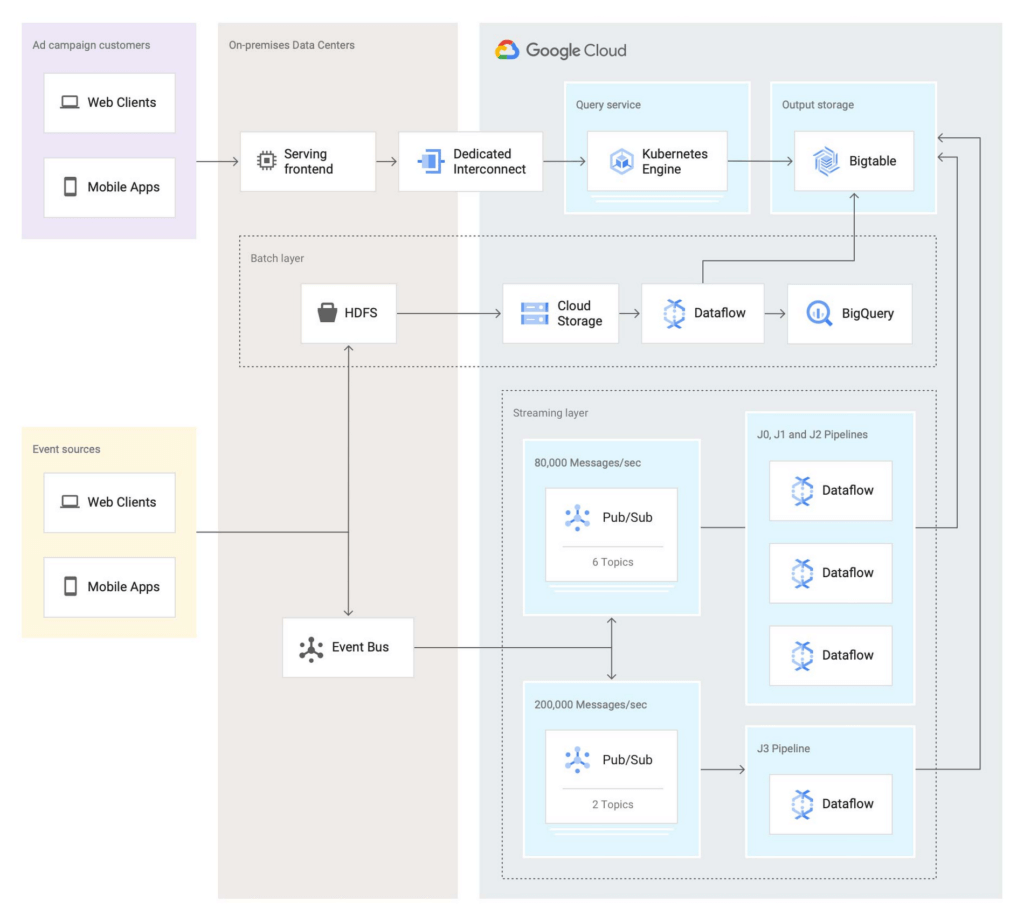
In this second iteration, the Twitter team re-implemented the batch layer as follows: Data is first staged from on-prem HDFS to Cloud Storage. A batch Dataflow job then regularly loads the data from Cloud Storage, processes the aggregations, and dual-writes the results to BigQuery for ad-hoc analysis and Bigtable for the serving system.
The Twitter team also deployed an entirely new streaming layer in Google Cloud. For data ingestion, an on-prem service now pushes two different streams of Avro-formatted messages to Pub/Sub. Each message contains a bundle of multiple raw events and affects between 100 and 1,000 aggregations. This leads to more than 3 million aggregations per second performed by four Dataflow jobs (J0-3 in the diagram above). All Dataflow jobs share the same topology, although each job consumes messages from different streams or topics.
One stream, which contains critical data, enters the system at a rate of 200,000 messages per second and is partitioned in two separate Pub/Sub topics. A Dataflow job (J3 in the diagram) consumes those two streams, performs 400,000 aggregations per second, and outputs the results to a table in Bigtable.
The other stream, which contains less critical but higher volume data, enters the system at a rate of around 80,000 messages per second and is partitioned into six separate topics. Three Dataflow jobs (J0, J1, and J2) share the processing of this larger stream, with each of them handling two of the available six topics in parallel, then also outputting the results to a table in Bigtable. In total, those three jobs process over 2 million aggregations/second.
Partitioning the high-volume stream into multiple topics offers a number of advantages:
- The partitioning is organized by applying a hash function on the aggregation key and then dividing the function’s result by the number of available partitions (in this case, six). This guarantees that any per-key grouping operation in downstream pipelines is scoped to a single partition, which is required for consistent aggregation results.
- When deploying updates to the Dataflow jobs, admins can drain and relaunch each job individually in sequence, allowing the remaining pipelines to continue uninterrupted and minimizing impact on the end users.
- The three jobs can each handle two topics without issue currently, and there is still room to scale horizontally up to six jobs if needed. The number of topics (six) is arbitrary, but is a good balance at the moment based on current needs and potential spikes in traffic.
To assist with job configuration, Twitter initially considered using Dataflow’s template system, a powerful feature that enables the encapsulation of Dataflow pipelines into repeatable templates that can be configured at runtime. However, since Twitter needed to deploy jobs with topologies that might change over time, the team decided instead to implement a custom declarative system where developers can specify different parameters for their jobs in a pystachio DSL: tuning parameters, data sources to operate on, sink tables for aggregation outputs, and the jobs’ source code location. A new major version of Dataflow templates, called Flex Templates, will remove some of the previous limitations with the template architecture and allow any Dataflow job to be templatized.
For job orchestration, the Twitter team built a custom command line tool that processes the configuration files to call the Dataflow API and submit jobs. The tool also allows developers to submit a job update by automatically performing a multi-step process, like this:
- Drain the old job:
- Call the Dataflow API to identify which data sources are used in the job (for example, a Pub/Sub topic reader).
- Initiate a drain request.
- Poll the Dataflow API for the watermark of the identified sources until the maximum watermark is hit, which indicates that the draining operation is complete.
- Launch the new job with the updated code.
This simple, flexible, and powerful system allows developers to focus on their data transformation code without having to be concerned about job orchestration or the underlying infrastructure details.
Looking ahead
Six months after fully transitioning its ad analytics data platform to Google Cloud, Twitter has already seen huge benefits. Twitter’s developers have gained in agility as they can more easily configure existing data pipelines and build new features much faster. The real-time data pipeline has also greatly improved its reliability and accuracy, thanks to Beam’s exactly-once semantics and the increased processing speed and ingestion capacity enabled by Pub/Sub, Dataflow, and Bigtable.
Twitter engineers have enjoyed working with Dataflow and Beam for several years now, since version 2.2, and plan to continue expanding their usage. Most importantly, they’ll soon merge the batch and streaming layers into a single, authoritative streaming layer.
Throughout this project, the Twitter team collaborated very closely with Google engineers to exchange feedback and discuss product enhancements. We look forward to continuing this joint technical effort on several ongoing large-scale cloud migration projects at Twitter. Stay tuned for more updates!
More Relevant Stories for Your Company

Neo4J & Google Cloud: Graph Data in Cloud to Address Challenges in FinServ Industry
Over the last decade, financial service organizations have been adopting a cloud-first mindset. According to InformationWeek, lower costs and enhanced scalability were the biggest drivers for cloud adoption in financial services, and cloud-native applications allow access to the latest technology and talent, enabling adopters to rebuild transaction processing systems capable of

Seven-Eleven Japan Leverages Google Cloud’s Performance and Speed for Real-time Business Insights
With the rise of technologies like smartphones, retailers have felt the pressure to meet evolving consumer needs and expectations. Seven-Eleven Japan(“SEJ”) has long been on the forefront of this thanks to the way they develop and invest in IT. However, in recent years, Japan’s leading convenience store chain has struggled

What Drives Your Organization to be Data-driven?
Every organization has its own unique data culture and capabilities. Yet each is expected to use technology trends and solutions in the same way as everyone else. Your organization may be built on years of legacy applications, you may have developed a considerable amount of expertise and knowledge, yet you


Behind the Scenes: How eBay Provides its Customers New Shopping Experiences
“If it exists in the world, you are likely to find it on eBay.” So they say. With 180 million buyers and a global presence in over 190 markets, it’s probably true. A company that emerged out of the ashes of the dot-com bubble, eBay today is one of the
