





Mid-Sized B2B Firm Achieves the Business Trifecta with a Single Strategy

6917
Of your peers have already read this article.
2:45 Minutes
The most insightful time you'll spend today!
Thirteen years’ experience in e-commerce has given Teddy Chan, Chief Executive Officer and Chief Technology Officer, AfterShip, a deep understanding of the challenges of shipping and tracking packages to customers worldwide.
“The key problem many merchants face is customers asking ‘where is my order?’ and ‘when I will get the package?’” Chan says. “When I considered this issue, I came up with the idea of AfterShip.” Chan helped found AfterShip in 2011 to enable merchants to keep track of packages sent to customers via a web portal or an API. AfterShip also allows merchants to notify customers of anticipated delivery times.
“Using AfterShip, merchants can provide the same experience to buyers regardless of which couriers they use,” Chan says. “Merchants can also improve their customer engagement by including up-selling or marketing content with their delivery notifications.”
Hong Kong-headquartered AfterShip continues to grow quickly and now has a 40-person team. Thirty members of this team are based on the China special administrative region and 10 are based in India.
“Google Cloud Platform has a network of global datacentres with deep connectivity that enables us to put our infrastructure close to our customers. In addition, the ability to horizontally scale our global database using tools such as Google Cloud Spanner eliminates any limits on our geographic expansion.”
—Teddy Chan, Chief Executive Officer and Chief Technology Officer, AfterShip
By October 2017, the business was tracking about 30 million packages per month and had expanded its services to include label and rate calculation and self-service return. Revenue, package transaction numbers and team size have doubled every year for the past three years, while more than 300,000 merchants and 426 couriers are signed up to the service. Key customers include Wish, Etsy and Groupon.
Close to half AfterShip’s customers are based in the United States, about one third in Europe and the remainder are located in Asia. AfterShip had initially delivered its applications and services from an incumbent public cloud service. However, the company wanted to continue its growth trajectory while automating key infrastructure processes, implementing a continuous deployment model and controlling costs.
The business needed to achieve these objectives while maintaining a global presence and high-quality service. AfterShip started reviewing its options and decided to migrate to Google Cloud Platform (GCP). “Google Cloud Platform has a network of global datacentres with deep connectivity that enables us to place our infrastructure close to our customers,” Chan says.
“In addition, the ability to horizontally scale our global database using tools such as Google Cloud Spanner eliminates any limits to our geographic expansion. Furthermore, the managed services provided through GCP would allow us to focus on building better features for online merchants.” The reliability provided by GCP would also enable AfterShip to meet the stringent service level requirements of large digital marketplaces in the United States, Asia and elsewhere.
“Google Cloud Platform could manage the high volumes and enable us to deliver the service levels that would realise our ambition of becoming the number one tracking API platform in the world,” Chan says. “For example, with Google Cloud Platform, we can provide a 99.95% monthly uptime service level to our customers.” Finally, GCP provided managed solutions, including Google Kubernetes Engine powered by open source container orchestrator Kubernetes, that would enable AfterShip to automate processes such as scaling and enable its team to focus on developing applications.
AfterShip has moved its websites into GCP infrastructure in three datacentres around the world and anticipates completing the migration in Q4 2017. “Google provided a lot of assistance, particularly early in the project when we needed it,” Chan says. “They briefed us on several services we hadn’t known about that could replace the equivalents in the public cloud we were using previously.” The business then completed the migration using its own skilled team members. As well as Google Kubernetes Engine and Google Cloud Spanner, AfterShip is using Google BigQuery to store and analyse transaction information.
“Google Cloud Platform could manage the high volumes and enable us to deliver the service levels that would realise our ambition of becoming the number one tracking API platform in the world.”
—Teddy Chan, Chief Executive Officer and Chief Technology Officer, AfterShip
Deployment times down from one hour to two minutes
With deployment times falling from up to one hour in its previous cloud environment to about two minutes in GCP, AfterShip has been able to adopt a continuous deployment model. “This has improved our service levels,” Chan says. “If there are any issues we can fix them quickly, while we can iterate faster to create new features in response to customer requests or changes in the market. “This enables us to continue to lead our competitors.”
Targeting a 30 percent reduction in costs
AfterShip is now targeting a 30% reduction in costs by optimising its use of Docker containerisation technology on GCP.
“By using Docker with Kubernetes, we have been able to fine-tune our use of compute resources and better control our costs,” Chan says. “We’re extremely pleased with Google Cloud Platform as it really is built for engineers,” he adds. “In addition, its documentation is extremely clear, allowing us to troubleshoot or carry out activities on the platform ourselves. “We look forward to continuing to grow and extend our package tracking and associated services with Google Cloud Platform.”
Countries can Tackle Food Wastage Crisis Using Google’s Data Analytics

4993
Of your peers have already read this article.
4:00 Minutes
The most insightful time you'll spend today!
With over ⅓ of the food in the USA ending up as waste according to the USDA, it is a compelling challenge to address this travesty. What will happen to hunger, food prices, trash reduction, water consumption, and overall sustainability when we stop squandering this abundance?
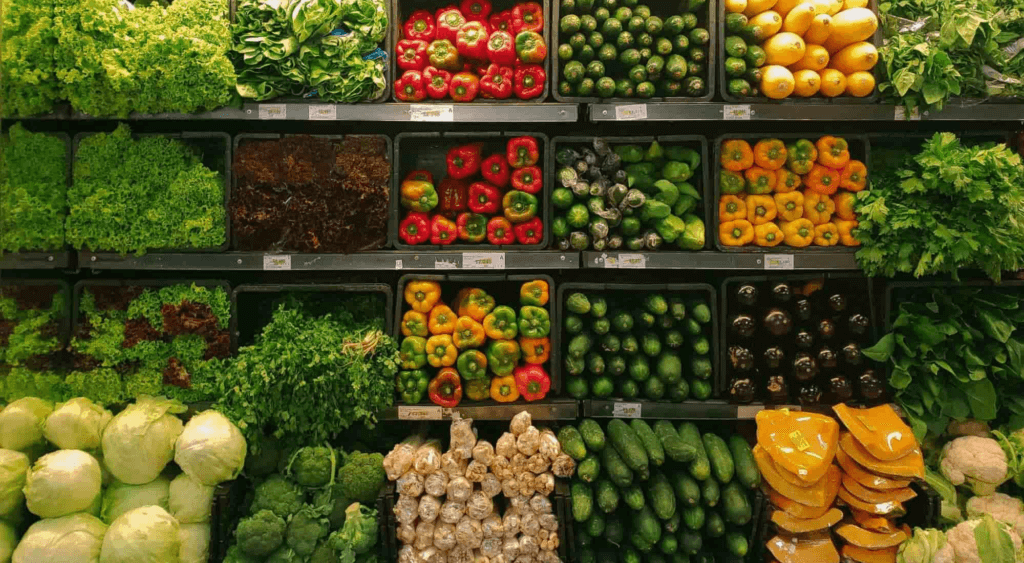
Beginning with the departure from the farm to the back of the store, the freshness clock continues to run. Grocers work very hard to purchase high quality produce items for their customers and the journey to the shelf can take a toll in both quality and remaining shelf life. Suppliers focus on delivering their items through the arduous supply chain journey to the store with speed and gentle handling. The baton is then passed to the store to unload and present the items to customers with care to sell through each lot significantly before the expiration or sell by date. This is to ensure that the time spent in the customer’s home is ample to ensure a great eating experience as well. Food waste is a farm to fork problem with opportunity at every step of the chain, but today we will focus on the segment that the grocery industry oversees.
With the complexities of weather, geopolitical issues, distribution, sales variability, pricing, promotions, and inventory management, it seems daunting to impact waste. Fortunately, data analytics and machine learning in the cloud is a powerful weapon in the fight against food waste. Data Scientists harness knowledge to draw meaning from data turning that data into decision driving information.
One key Google has been working on to accelerate value is to break down data silos and leverage machine learning to realize better outcomes, using our Google Data Cloud platform. This enables better planning through demand forecasting, Inventory management, assortment planning, and dynamic pricing and promotions.
That sounds great but how does it work?
Let’s walk through a day in the life journey to see how the integrated Google Data Cloud platform can change the game for good. Our friendly fictitious grocer FastFreshFood is committed to selling high quality perishable items to their local market. Their goal is to minimize food waste and maximize revenue by selling as much perishable fresh food as possible before the sell by date. Our fictitious grocer in partnership with Google Cloud could build a solution that will take a significant bite out of their food waste volume and better satisfy customers.
- Sales through the register and online are processed in real time with Datastream, Dataflow to keep an accurate perpetual inventory by minute of every single item.
- A Demand forecasting model using machine learning algorithms in BigQuery then identifies needs for back room replenishment, so Direct Store Delivery and daily store Distribution Centers manage ordering more efficiently to ensure just the right amount of each product each day.
- Realtime reporting dashboards in Looker with alerting capabilities enable the system to operate with strong associate support and understanding. The reporting suite shows inventory levels into the future, daily orders, and at risk items.
The pricing algorithm could also alert store leadership concerning any items that will not sell through and suggest real time in store specials resulting in zero waste at shelf and maximized revenue.
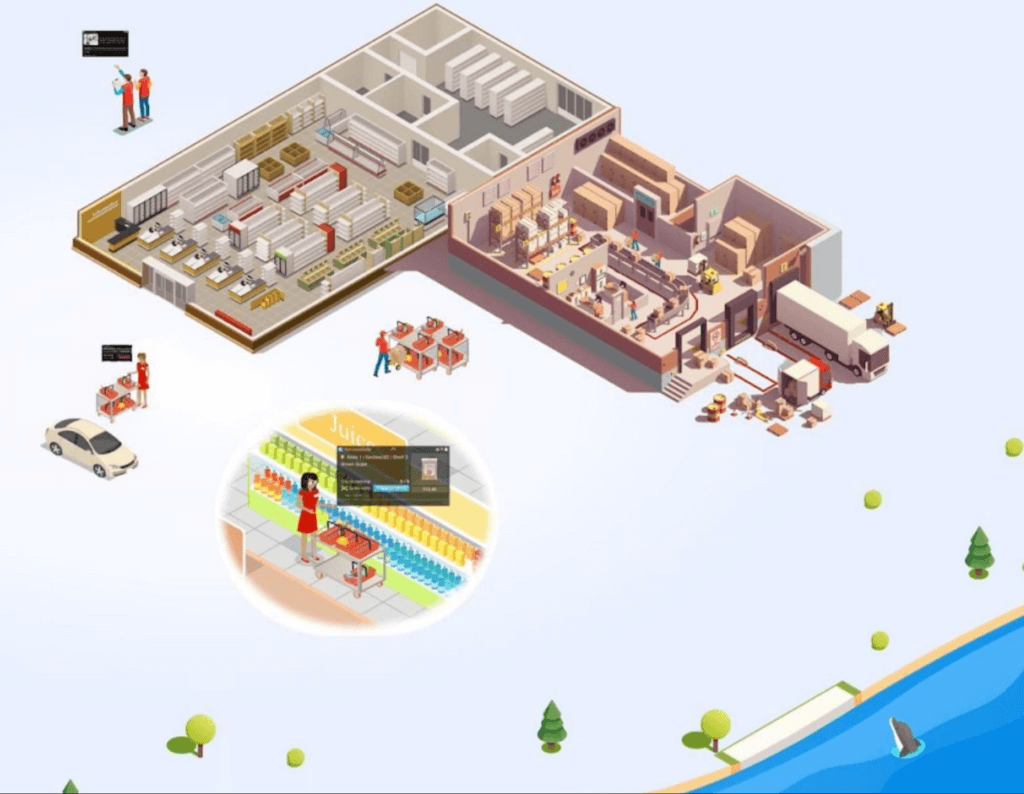
This approach is not just for perishable categories and is a pattern that works well for in-store produced items and center store items. The key point is that by bringing ML/AI to difficult business problems grocers are reinventing what is possible for both their profitability and sustainability.
The technical implementation of this design pattern in Google Cloud leverages Datastream, Dataflow, BigQuery and Looker products, it is detailed in a technical tutorial accompanying this blog post.
In partnership with Google Cloud, retailers can solve complex problems with innovative solutions to achieve higher quality, lower cost, and provide great customer experiences. To learn more from this and other use cases, please visit our Design Patterns website.
Curious to learn more?
We’re excited to share what we know about tackling food waste at Google, a topic we’ve been working on in the last decade as we’ve embarked on reducing our own food waste in our operations in over 50 countries in the world. The Google Food for Good team works exclusively on Google Cloud Platform with our partners on this topic. Two additional articles below.
Silos are for food, not for data – tackling food waste with technology
This business Cloud blog directly addresses information silos that currently exist across many nodes in the food system and how to break down cultural and organizational barriers to sharing.
“Unsiloing” data to work toward solving food waste and food insecurity
This follow-on technical Cloud blog articulates the path to setting up data pipelines, translating between data sets (not everyone calls a tomato a tomato!) and making sense of emergent insights.
How One Company Uses AI and Data Analysis to Boost Revenue

9481
Of your peers have already read this article.
4:30 Minutes
The most insightful time you'll spend today!
AI, deep learning, and image recognition is transforming the shopping experience. These technologies enable consumers to use product images or screenshots rather than text to search for similar products. This improves the customer experience and enables retailers with online and offline outlets to provide a genuine omnichannel experience.
The lack of complexity and the ease of use of BigQuery has enabled ViSenze to reduce its data infrastructure and management costs by 30%–50%, and scale up without incurring downtime.
—Renjie Yao, Data Platform Lead, ViSenze
Visual commerce provider ViSenze is helping some of the world’s leading retailers improve conversion rates through image-based search.
The business’s products also enable media companies to use the platform to turn images and videos into engagement opportunities—driving new and incremental revenues.
Created through NExT—a research center established by the National University of Singapore and Tsinghua University of China—ViSenze now operates in the United States, United Kingdom, India, China, and Singapore. The business is backed by Japan-based internet and ecommerce company Rakuten and cross-border investment specialist WI Harper Group.
Growth in SMB and Mobiles
Renjie Yao, Data Platform Lead at ViSenze, sees opportunities for growth in the small-to-medium business sector, where companies do not have the resources to build similar technologies, and with mobile device OEMs to integrate ViSenze natively on smartphones.
Phone owners can activate a “shopping lens” on camera and gallery apps to capture an image of a product. They then receive matching results from more than 800 partner merchants and retailers and can then click through to product pages on partner apps or mobile websites. Alternatively, they may use a photo to compare products sold on different sites or shop matching styles.
“Our research found Google Cloud provided a complete, integrated ecosystem rather than a disparate collection of tools and components, and so was ideal for our needs.”
—Renjie Yao, Data Platform Lead, ViSenze
The ViSenze API analyzes the contents of a selected or clicked image and sends the information back to the organization’s visual commerce platform. The platform feeds back similar results based on that information.
The ViSenze offering also extends to image analysis for the tagging of product attributes—such as a white turtleneck cardigan with full sleeves—to provide an improved search experience.
Data Vital to ViSenze
Capturing and analyzing large volumes of data is integral to ViSenze. “We have to understand how consumers interact with our customers’ ecommerce websites and apps,” says Yao. “For example, we need to know who has looked at a particular pair of jeans on a website and whether that visit led to a conversion. We can then tell that customer whether they need to make more stock available.”
ViSenze also relies on data to provide high-quality training for its image recognition models and its domain-specific models for online retail.
Protect Customer Data
Data is vital to ViSenze—but customer privacy is most important. “All the data we collect is transparent to our customers, meaning they can decide what they do not want us to collect. In addition, all personal data processing complies with privacy protection regulations in each region, such as the General Data Protection Regulation in Europe.”
A Quick Move to the Cloud
ViSenze started operations using servers, storage, networking, and associated systems in an on-premises data center operated by NExT.
However, to support rapid growth, the business decided to move its workloads to the cloud. ViSenze opted for a multi-cloud architecture, using in part a Google Cloud data infrastructure.
“Our research found Google Cloud provided a complete, integrated ecosystem rather than a disparate collection of tools and components, and so was ideal for our needs,” says Yao. “We could connect different components with the click of a mouse.” Further, the business found it could easily configure rules and pipelines to route data logs to relevant Google Cloud services.
The review found Google Cloud’s extensive managed services would also remove administration and maintenance tasks from ViSenze’s in-house technology team—freeing team members to focus on more valuable tasks.
In addition, Google Cloud provided the security features—including custom hardware running hardened operating systems and file systems and encryption of data at rest and in transit—needed to protect sensitive information. Finally, the location of Google Cloud regions in several countries would enable the business to meet regulatory and data sovereignty requirements.
A Three-Month Implementation
ViSenze opted to move to Google Cloud in mid-2017 and completed a three-month implementation using internal resources. “The process was very smooth and intuitive, and we had no problems building our entire data platform within Google Cloud,” says Yao.
The business now uses an architecture comprising Google Kubernetes Engine to manage and orchestrate Docker containers running in Google Cloud Platform; BigQuery to provide an analytics data warehouse, with Google Data Studio providing customizable visualization and reports; Stackdriver to monitor and manage virtual machine instances and services inside Google Cloud; Cloud SQL to manage its relational databases for real-time analytics; Compute Engine to provide compute resources; Cloud Storage to store files and objects; Cloud Pub/Sub to provide real-time messaging between applications; and Cloud Functions to build event-driven applications.
After collecting the request logs of users in virtual machine instances and Docker containers, ViSenze distributes them in three directions. “We export raw logs into Cloud Pub/Sub for indexing inside an Elasticsearch search engine, and to a BigQuery data warehouse for further analytics,” explains Yao. “We also use Cloud Functions-created applications to obtain the logs from Cloud Pub/Sub to perform some real-time calculations.”
“We are currently using Airflow workflow management on Compute Engine as our hosted ETL platform, but are likely to move to Cloud Composer in future.”
500 Million Records Per Day
With Google Cloud providing its data infrastructure, ViSenze is well positioned to meet internal and customer demands for more granular insights. The business is now processing 500 million records per day through BigQuery and saves up to one year’s aggregated data—excluding any personal data—in the data warehouse for analysis.
The nature of ViSenze’s business means most reports are generated for data processed on an hourly, daily, or monthly basis. “BigQuery is extremely stable and performance optimized, regardless of the volume of data it processes,” says Yao. “Across BigQuery and other Google Cloud Platform services, we’ve recorded 99.99% availability over the past year.”
The lack of complexity and the ease of use of BigQuery has enabled ViSenze to reduce its data infrastructure and management costs by 30%–50%, and scale up without incurring downtime.
“With BigQuery, we have saved the equivalent of two full-time engineers and now need only half of one person’s time to maintain our whole data platform,” says Yao.
“In addition, BigQuery integrates closely with Data Studio, enabling non-technical people in our product and business teams to create dynamic, detailed analysis dashboards. We now use Data Studio to create nearly 50 separate reports.”
The business has now grown to offer access to more than 1 billion users and a listing of more than 400 million purchasable products.
Next Steps
ViSenze is now researching the potential of the Cloud AutoML suite of machine learning products to improve the training of its models and run a fully managed NoSQL database through Cloud Datastore.
“A NoSQL database service is the only missing piece of our architecture for now, and using Cloud Datastore would enable us to focus almost exclusively on our business,” says Yao. “With Google Cloud Platform, we are ideally positioned to continue providing support to our business team and help them continue expanding into new markets.
“In addition, we can help retailers and consumers to unlock the potential of the web and apps to transform the purchasing experience.”
S4 Agtech Transforms Agriculture with Google Cloud

7502
Of your peers have already read this article.
8:30 Minutes
The most insightful time you'll spend today!
Like countless other industries, farming is going digital and undergoing big changes—driven by access to more actionable information. The agriculture business can now gather and analyze georeferenced data from satellites, combined with data from IoT sensors in fields, crop rotation and yield histories, weather patterns, seed genotypes and soil composition to help increase the quantity and quality of crops.
This is essential for businesses in the agriculture industry, but it’s also critical to address growing food shortages around the world.
At S4, we create technology to de-risk crop production. We provide customers seeking agricultural risk management solutions with the tools to make better, data-driven decisions for their crop planning, based on machine learning and proprietary algorithms.
We interpret plant evolution on a global scale with predictive modeling and analytics, and offer super-efficient risk-transferring solutions. Our multi-cloud platform includes a petabyte-scale database, an open source stack, and—after 50 proof-of-concept evaluations—BigQuery for our data warehouse and the Cloud SQL database service to handle OLTP queries to our PostgreSQL database.
These PoCs included, among others, Microsoft Azure Data Lake Analytics, IBM Netezza, Postgres/PostGIS running on IBM bare-metal servers with SATA SSDs and on Google’s Compute Engine with NVMe disks, and on-premises memSQL, CitusData and Yandex ClickHouse.
Weeding out risk in an uncertain market
According to recent research, climate extreme events like drought, heat waves, and heavy precipitation are responsible for 18-43% of global variation in crop yields for maize, spring wheat, rice, and soybeans. This is a clear trend for other crops as well. Such variation poses risks of food shortages as well as large financial risks to farmers, insurers, and regions dependent on successful crop yields. Also, it creates vast humanitarian difficulties.
Our mission at S4 is to help de-risk crop production by matching the right data with analytics tools so farmers and other participants in the agricultural value chain can plan better, resulting in more reliable food supplies.
In a nutshell, we create indices out of biological assets. These indices measure yield losses on crops that are caused by the effects of weather and other factors, which are then used as underlying assets for products, such as swap/derivative contracts and parametric insurance policies, to transfer risk to the financial markets.
We enable insurers and lenders to buy and sell agricultural risks through the futures market. Also, our other products help farmers and seed and fertilizer companies provide customized genotype recommendations and fertilization requirements. This helps to optimize planting by geography, resources, and crop species, monitor phenological, pests and humidity evolution throughout the crop season, and estimate yields.
Local communities benefit from S4’s technology, as the ability to manage weather risks allows farmers to stabilize their cash flows, invest more to produce more with fewer risks, and develop in a more sustainable manner.
Growing data sources, reducing costs, accelerating performance
With the volume of diverse data sources and analytical complexity both growing at a very fast pace, we decided that using a major cloud services provider with a broad roadmap and global partnerships would be beneficial to S4’s future evolution.
At the same time, we wanted to bring our services to users faster and cut costs by consolidating our on-premises technology stack. When we started evaluating providers, our leading criteria included a powerful geospatial database and data analytics tools along with excellent support, all at a competitive price. GCP prevailed in nearly all criteria categories among the 50 companies we measured.
Our previous platform architecture included a hybrid relational database that used Compute Engine for virtual machines and Cloud Storage for database backup. The RDBMS was slow. Maintaining our own data warehouse was complex and expensive.
We wanted to use machine learning and neural networks, but couldn’t do so easily and affordably. The complexity of that system meant that products or services requiring small changes or additions to the data model translated to expensive expansions of infrastructure or project time.
Also, agronomical or product teams couldn’t test these changes by themselves, always requiring the intervention on no small part of the IT team, which led to further delays.
We added GCP services like BigQuery as S4’s cloud data warehouse and use BigQuery GIS for geospatial analysis, Cloud Dataflow for simplified stream and batch data processing, and Cloud SQL for queries to the S4 database platform, which have all made a huge impact on our services and bottom line.
Database and analytics costs have decreased by 40% and customers are receiving our analytical results 25% faster. In addition, we’ve eliminated the time-consuming downloading of images, reducing storage and processing costs by 80%, because we no longer need expensive tools licenses, and have greatly reduced classification processing times.
Our customers working in the agriculture industry are also benefiting from this infrastructure change. They are now able to speed up their data analytics using our GCP-based platform.
“S4 products and technologies unlock the full potential of satellite imagery for crop prescriptions, monitoring and yield estimates,” says Nicolás Loria, Manager of Marketing Services, Southern Cone, Corteva Agriscience.
“We’ve worked with S4 for the last three (and starting year number four) crop seasons as its team capabilities, data integration capacities, and analytics insights have allowed Corteva to perform an entire new solution. Thanks to S4’s customized 360° approach, fast response and delivery times, we have safely outsourced our remote crop analytic technical needs.”
Also, this new architecture has allowed us to scale our models and databases with almost no limits, at a fraction of the cost vs. the previous models.
We’ve saved a lot of time on executing processes and reduced work needed by our internal teams to do certain tasks, like preparing images, converting them, validating results, and more. Using Google Earth Engine has decreased the execution time of daily tasks anywhere from 50% to 90% of the previous time, going from an average time of 30 minutes to between four and 15 minutes, depending on the task.
In addition to saving money and time, we are able to focus on innovation with the GCP performance and features we’re using. We’re able to seamlessly add satellite data to analytics using both public datasets and our own private data, and deliver GIS data management, analytics, crop classification and monitoring in real time.
We can do semi-automatic crop classification and classification using spectral signatures with Google Earth Engine. Later this year, we’ll be using neural networks for pattern recognition and machine learning in new applications to improve crop yields and fine-tune risk models. And using GCP and Google Earth Engine infrastructure means we can run models for customers in South America and around the world, since Google Earth Engine has global satellite imagery available.
We’ve heard from our customer Indigo Argentina that they’re able to bring customers data insights faster.
“We are working with S4 in the development of two different applications for satellite crop monitoring and yield assessment,” says Carlos Becco, CEO, Indigo Argentina. “S4’s technology allowed us to manage and analyze multiple sources and layers of information in real time, letting us uncover valuable insights in Indigo’s own microbiome technologies, and at a very competitive cost.”
Analytical products and app development thrive with GCP
With GCP, we are updating and improving algorithms that we built manually with machine learning processes to develop drought indices for upcoming crop seasons. Algorithms can recognize specific phases of crop phenology (e.g., bud burst, flowering, fruiting, leaf fall) and correlate them with photosynthetic activity, light, water, temperature, radiation, and plant genetics factors. Other analytical products like crop monitoring, pre-planting recommendations, financial scoring, and yield estimation can now do a lot more for users by offering multiple layers and datasets, faster image processing, and real-time access via APIs.
We also replaced our bare-metal S4 app deployment with the App Engine serverless application platform. It provides tighter integration between the S4 platform and our BigQuery data warehouse for integration with marketplaces and third-party solutions.
We get all of these Google Cloud features with all the benefits of managed cloud services, from multiversioning and security to automatic backups and high availability.
At S4, we trust technology to decode plant growth and help protect farmers and their communities from climate change. With growing food shortages due to increasing populations and intensifying weather, data and analytics can have a huge impact in lowering financial risks and improving agricultural yields. It’s one sector where cloud, database, analytics, and other technologies are combining to improve business outcomes and affect the lives of billions of people. Learn more about S4’s work and learn more about data analytics on Google Cloud.
Partnering with Google Cloud is the Key Behind Recent Healthcare Innovations
8862
Of your peers have already read this article.
2:00 Minutes
The most insightful time you'll spend today!
It’s simply amazing to witness how some of our systems integrators employ Google Cloud solutions to drive innovation in ways we at Google may never have considered—especially in healthcare. According to analyst firm MarketsandMarkets, the market for the Cloud in healthcare is projected to grow 43% between 2020 and 2025 to nearly $65 billion, fueled by the need for better technology infrastructures and faster digital transformation.
Healthcare and life sciences communities are looking to Google Cloud and its Service engagement model partners to improve collaboration and activate the power of medical data. These transformations deliver robust data analytics and bring a much deeper perspective into health epidemics like COVID-19 to help save lives.
In the healthcare and life sciences industry, our Google Cloud partners and customers provide constant energy and inspiration–and are the magic in some key healthcare innovations globally.
Let me show you how they are solving real-world business challenges.
Improving collaboration in Healthcare
Cloudbakers and Comanche County Memorial Hospital transitioned 2,000 employees to Google Workspace to improve collaboration, reduce costs, and increase security. By implementing a system that requires less maintenance while enabling mobile access to data and true collaboration, Comanche County Memorial Hospital saves $175,000 annually on licenses and helps medical professionals spend more time with patients.
“We chose Google Workspace because it cost a quarter of what we were paying previously, offers the kind of modern features that healthcare facilities need, and gave us data security and peace of mind.” —James Wellman, CIO, Comanche County Memorial Hospital
Accessing previously locked down medical data
Google Cloud and Quantiphi supported advances in cloud-based machine learning services to reduce infrastructure costs, unlock new paths of treatment, and dramatically reduce the amount of time it takes to evaluate scanned imagery following a stroke. John Hopkins University BIOS Division has been working on medical imaging to accelerate insights from scans on approximately 500 patients from 2,500 hours to 90 minutes, and lead to more accurate decision-making for brain injury patients that will ultimately improve medical outcomes.
“We’ve aligned closely with the goal of showing that a cloud-based, AI-driven approach is robust and that it can be performed while protecting personal PHI. In terms of costs, the cloud has definitely reduced some of the traditional financial demands of our research.” —Daniel F. Hanley, Jr., M.D., Director, Johns Hopkins University BIOS Division
Improving data access with the flexibility of Google Cloud
With the help of MediaAgility, TRIARQ migrated to Google Cloud to modernize their platform, build new applications, and expand their global footprint. With BigQuery, TRIARQ can now consolidate all transactional data, past and present, into a single location to report on specific insights and predict future data from e-prescriptions to complex revenue-cycle data and value-base analysis.
“The future of this industry will need to be a global one, and we can no longer be stuck in legacy systems if we want to survive. Having a team that is passionate about supporting us in this journey is definitely a plus point.”—Yaw Kwakye, Co-founder and Chief Architect, TRIARQ
Increasing visibility to COVID-19 outbreaks for actionable insights
As part of its response to the COVID-19 pandemic, HCA Healthcare chose to work with Google Cloud and SADA to create a national portal that increases visibility into outbreaks in 3,100 counties across the country in just 8 weeks. Now, the portal generates 30,000 new analytical views each day that can help inform private and public sector decision making for reopenings, closures, hot spots, and many other population health management activities.
“This project required deep knowledge of AI, and consumer-facing platforms, as well as healthcare. Google brought together the ideal combination of product, people, and partners. Google Cloud’s healthcare-specific products along with SADA’s expertise in the healthcare IT space made this partnership the perfect choice to move quickly and intelligently.”—Dr. Edmund Jackson, Chief Data Officer, HCA Healthcare
We’re committed to building the technology, resources, and services through Partner Advantage to help our partners address this opportunity. Looking for a solution focused partner in your region who has achieved Expertise and/or Specialization in your industry? Search our Global Partner Directory. Not yet a Google Cloud partner? Visit Partner Advantage and learn how to become one today!
The Query Execution Graph: Your Key to Better BigQuery Analytics

3097
Of your peers have already read this article.
2:30 Minutes
The most insightful time you'll spend today!
BigQuery offers strong query performance, but it is also a complex distributed system with many internal and external factors that can affect query speed. When your queries are running slower than expected or are slower than prior runs, understanding what happened can be a challenge.
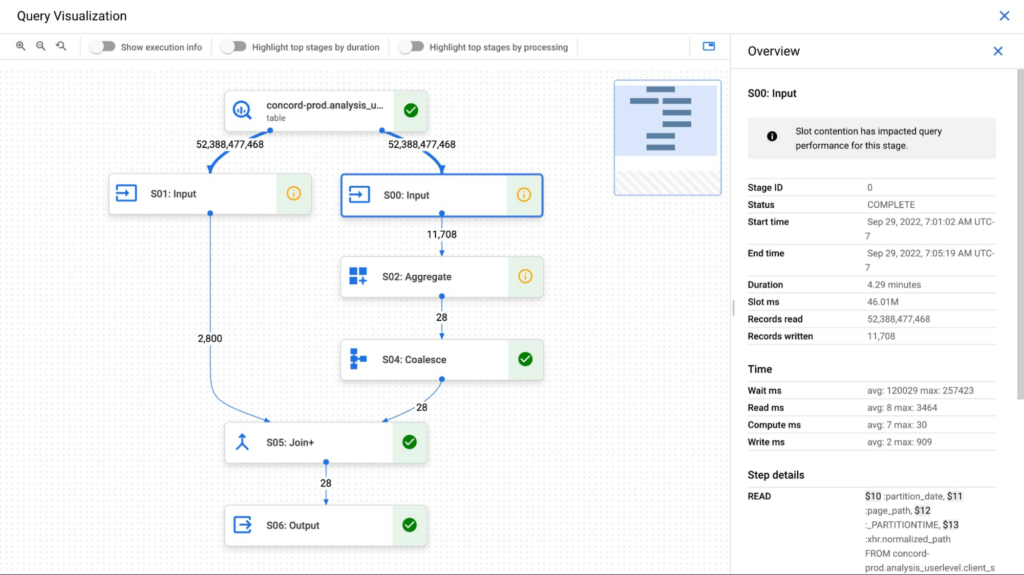
The query execution graph provides an intuitive interface for inspecting query execution details. By using it, you can review the query plan information in graphical format for any query, whether running or completed.
You can also use the query execution graph to get performance insights for queries. Performance insights provide best-effort suggestions to help you improve query performance. Since query performance is multi-faceted, performance insights might only provide a partial picture of the overall query performance.
Execution graph
When BigQuery executes a query job, it converts the declarative SQL statement into a graph of execution, broken up into a series of query stages, which themselves are composed of more granular sets of execution steps. The query execution graph provides a visual representation of the execution stages and shows the corresponding metrics. Not all stages are made equal. Some are more expensive and time consuming than others. The execution graph provides toggles for highlighting critical stages, which makes it easier to spot the potential performance bottlenecks in the query.
Query performance insights
In addition to the detailed execution graph BigQuery also provides specific insights on possible factors that might be slowing query performance.
Slot contention
When you run a query, BigQuery attempts to break up the work needed by your query into tasks. A task is a single slice of data that is input into and output from a stage. A single slot picks up a task and executes that slice of data for the stage. Ideally, BigQuery slots execute tasks in parallel to achieve high performance. Slot contention occurs when your query has many tasks ready for slots to start executing, but BigQuery can’t get enough available slots to execute them.
Insufficient shuffle quota
Before running your query, BigQuery breaks up your query’s logic into stages. BigQuery slots execute the tasks for each stage. When a slot completes the execution of a stage’s tasks, it stores the intermediate results in shuffle. Subsequent stages in your query read data from shuffle to continue your query’s execution. Insufficient shuffle quota occurs when you have more data that needs to get written to shuffle than you have shuffle capacity.
Data input scale change
Getting this performance insight indicates that your query is reading at least 50% more data for a given input table than the last time you ran the query and hence experiencing query slowness. You can use table change history to see if the size of any of the tables used in the query has recently increased.
What’s next?
We continue to work on improving the visualization of the graph. We are working on adding additional metrics to each step and adding more performance insights that will make query diagnosis significantly easier. We are just getting started.
More Relevant Stories for Your Company
Google Cloud’s Data Analytics May Recap
May was a very busy month for data analytics product innovation. If you didn’t have the chance to attend our inaugural Data Cloud Summit, video replays of all our sessions are now available so feel free to watch them at your own pace. In this blog, I’d like to share some background behind

Upgrade Your Contact Center with Knowlarity’s AI-powered Speech Analytics for Higher CX
Did you know, everyday about 56 million hours worth of phone conversations, equalling to 420 billion spoken words are handled by contact centers? Knowlarity, a renowned cloud business communication service provider with nearly 6,000 customers and over a million virtual users, leverages AI-powered speech analytics that offer insights to gauge
Moving Your Data Warehouse to the Cloud? Here’s What You Need to Know
Modernizing your data warehouse is one way to keep up with evolving business requirements and harness new technology. For many companies, cloud data warehousing offers a fast, flexible, and cost-effective alternative to traditional on-premises solutions. In a report sponsored by Google Cloud, TDWI examines the rise of cloud-based data warehouses

Blue Apron: Offering a better recipe for modern analytics
When Blue Apron had issues running its data warehouse on another cloud provider, it built an analytics platform using Looker and Google BigQuery to enable faster business decisions about food inventory. Google Cloud Results Enables near real-time business decisions to better manage food inventory and delivery by reducing query times
