





Maximizing Storage Efficiency: A Guide to Reducing Point-in-Time Recovery Impact

1464
Of your peers have already read this article.
1:30 Minutes
The most insightful time you'll spend today!
Point-In-Time Recovery (PITR) is a critical capability for enterprise applications. It allows database administrators to recover from accidental data deletion by restoring their production databases to a time before the incident.
Cloud SQL for PostgreSQL launched support for PITR in July 2020, allowing you to recover from disasters like data corruption or accidental deletion by restoring your Cloud SQL instance to a previous time. We’re excited to announce an additional enhancement to PITR for Cloud SQL for PostgreSQL that makes enabling PITR an even easier decision: for instances with Point-in-Time Recovery newly-enabled, the write-ahead logs being stored for PITR operations (which are the transaction logs that are used to go back in time) will no longer consume disk storage space. Instead, when you enable PITR for new instances, Cloud SQL will store transaction logs collected during the retention window in Google Cloud Storage, and retrieve them when you perform a restore. Because transaction logs can grow rapidly when your database experiences a burst of activity, this move will help reduce the impact these bursts have on your provisioned disk storage. These logs will be stored for up to seven days in the same Google Cloud region as your instance at no additional cost to you.
PITR is enabled by default when you create a new Cloud SQL for PostgreSQL instance from the Google Cloud console, and transaction logs will no longer be stored on the instance for instances that have PITR newly enabled. If you have already enabled PITR on your PostgreSQL instances, this enhancement will be rolled out to your instances at a later point. If you want to take advantage of this change sooner, you can first disable and then re-enable PITR on your instance (which will reset your ability to perform a point-in-time restore to the time at which PITR was re-enabled). On instances with this feature enabled, you’ll notice that consumed storage on your instance will reduce relative to the volume of write-ahead logs (WAL) generated by your instance. The actual amount of storage your logs consume will vary by instance and by database activity – during busy times for your database, log size may shrink or grow. However, these logs will now only be stored on your instance long enough to successfully replicate to any replicas of the instance and to ensure that they are safely written to Cloud Storage; afterwards, they will be removed from your instance.
We’re excited to continue to enhance Cloud SQL for PostgreSQL to ensure that disaster recovery is easy to enable, cost effective, and seamless to use. Learn more about this change in our documentation.
Creating and Using Storage Buckets for Your Data Needs

1391
Of your peers have already read this article.
2:30 Minutes
The most insightful time you'll spend today!
So, you want to store objects on the cloud? But you’re really new to Google Cloud or Cloud Storage and would like someone to walk you through the process step by step?
Today is your lucky day!
I will help you understand the big steps involved in setting up and using Cloud Storage. For a walkthrough of all the steps involved that even includes highlighting of things to select so you don’t spend all your time playing “Where’s Waldo” on the page looking for that one button, click try the tutorial!
Creating buckets, storing objects in them, and adjusting permissions may feel challenging at first, but after you’ve walked through these steps, you’ll be able to create and use the Cloud Storage your project needs.
Resource Hierarchy
Projects contain all of the related parts of your application. Inside projects, you may have buckets, the top level containers in Cloud Storage. Files and folders are stored in buckets. You can grant access to a bucket, folder, or file using Identity and Access Management.
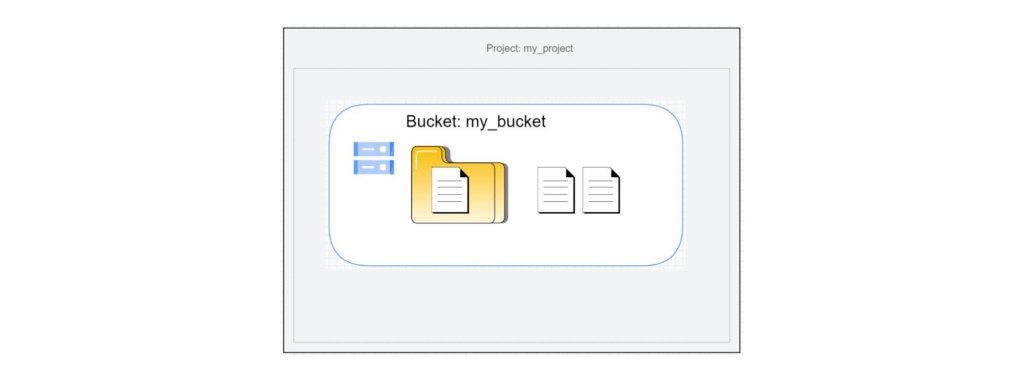
You can do all of that in this interactive tutorial. So let’s get started. I suggest you follow along in the tutorial so you can see the specific keys and screens as I describe them.
Creating a project
Everything in your application will be in a project, even if the only service you are using is storage. Projects need to be associated with a billing account, so if you don’t have one, consider signing up for the Free Trial. You’ll start in the Cloud Console.
Creating a bucket
Once you have a project, you can use storage by navigating to the Cloud Storage page by using either the Navigation menu at the top left of the console or by searching for “Cloud Storage” using the search box at the top of the console.
At the Buckets page of Cloud Storage, you’ll be able to create a bucket. The name of your bucket needs to be globally unique; that is no other bucket in Google Cloud Storage can have the same name. This is because if you or your organization allow your bucket to be accessible on the Internet, it will be at the URL https://storage.googleapis.com/<bucket name>. You can also consider implementing a security feature to prevent data exfiltration, organization restriction headers when you’re finished creating your bucket.. Pick a region close to you for your bucket. In some cases it may make sense to use multi-region or dual-region, but the details are more than I want to get into here. Don’t worry; you can find lots more information on them! Additionally, I won’t go into the details about selecting the appropriate storage class based on access frequency and longevity, but more information can be found here as well our recently introduced Autoclass tiering feature..
Since buckets can be accessed from the Internet, you need to be careful to only make the things you want to be public, public. The default value is to keep your data off of the Internet, so when you create the bucket, there’s an option to “Enforce public access prevention on this bucket” that is already selected. Since we’ll be making items in this bucket public later on, clear the option before confirming the bucket information. Don’t worry; you’ll see how to set that option back later.
Take a look at the Bucket detail page. There are tabs to see the objects in the bucket, the permissions on the bucket, and much more. There are commands to create folders and to upload files and folders. We’ll do some of this in the next section. You can even find out much more from the Learn option in the upper right.
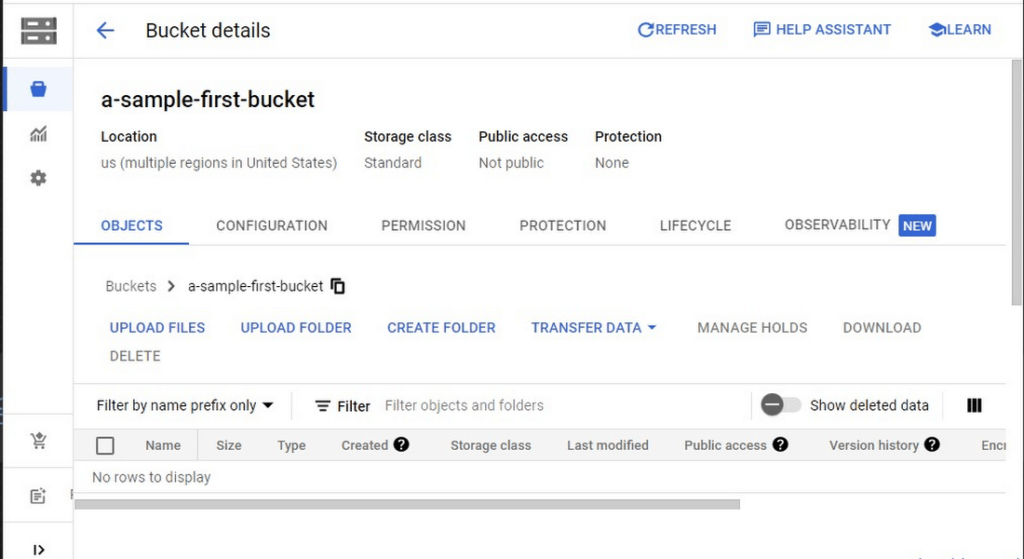
Adding items to the bucket
Find a file you’d like to upload to this bucket, remembering it will be made public to the Internet later. If you don’t have anything available, there’s a picture of a cat (of course, it’s a cat picture, this is the Internet!) in the interactive tutorial.
Go to the bucket details for your bucket. Using the “Upload files” button, you’ll just upload the file to the bucket by selecting the file from your computer. We won’t get into service classes here, but when you’re ready, there are links in the references.
Of course, if you have a lot of files in a bucket, you probably will want some sort of organization. You can do this by creating folders in your bucket with the “Create Folder” option. Once you’ve done that, you can go to the overflow menu (three vertical dots at the end line with the object information) and select Move. Remember, if you need help finding this, the interactive tutorial will point it out.
Making a bucket public
No surprise, the Bucket details hold lots of information about your bucket. You’ll change the bucket’s permissions in the Permission tab. (I hope that’s not a surprise.) You can then give access to individuals, groups, or all users. For this tutorial, follow the steps to grant access to allUsers. There are a variety of different levels of access you can grant to a user. In this case, just grant the ability to view the object using Storage Object Viewer.
Then go into the Objects tab to find the URL for the object you uploaded. Copy that URL and ensure you can indeed access the object from another tab or incognito window.
Now that you’ve done that, go back to the Permission tab for the bucket and select Prevent Public Access to secure the bucket again.
So, in a nutshell, to make all files in a bucket public, in the Permissions tab:
- Uncheck the option “Remove Public Access Prevention”
- Use Grant Access to give allUsers the Storage Object Viewer role in Cloud Storage.
To make all files in a bucket private, in the Permissions tab select Prevent Public Access.
Cleaning up
There is a charge to keep items in Cloud Storage, so you’ll probably want to delete the object you uploaded by selecting it and pressing Delete. You can delete the bucket in a similar way. The tutorial has details, of course.
While there are lots more details about Cloud Storage, you’ve got the big picture now. Go do something creative and useful with it!
So what now?
If you haven’t walked through the interactive tutorial, give it a try!
Mrs. T’s Pierogies Moves SAP Systems to Google Cloud for Faster Analytics Capabilities for its SAP Data

6856
Of your peers have already read this article.
1:30 Minutes
The most insightful time you'll spend today!
Pierogies might just be the ultimate comfort food. But when Mrs. T’s Pierogies — the leading manufacturer of frozen pierogies in the US — learned it needed to transition its existing on-premises SAP ECC to S/4HANA, the company sought a little comfort for itself.
Founded in 1952, Mrs. T’s Pierogies now produces more than 650 million pierogies a year. Moving that many pierogies requires a powerful ERP system — and an equally powerful IT infrastructure on which to run it. Mrs. T’s realized that the SAP-mandated transition of its ERP solution to SAP S/4HANA was an opportunity to move its SAP systems to Google Cloud and gain real-time analytics capabilities for faster sales forecasting, more effective trade promotions, and more sophisticated planning.
From necessity to opportunity
Mrs. T’s successfully ran its SAP ECC solution on its own on-premises servers for years. But after SAP decided to sunset the product, Mrs. T’s realized that it faced multiple challenges, including:
- Migrating its SAP ECC 6.0 system from an on-premises leagcy OS to a cloud-based Linux environment
- Moving data from its SAP DB2 database to HANA
- Transitioning from ECC to SAP S/4HANA
That complex transition needed to take place with little or no downtime, since nearly all of the company’s invoices, warehouse movements, and transfer orders used the Electronic Data Interchange (EDI) protocol. Missing even a few hours of EDI transactions would put significant revenue at stake. Adding to the challenge: Some Mrs. T’s customers would not accept an invoice past five days, which left little room for error. Mrs. T’s chose Rackspace Technology, a longtime Google Cloud partner, to oversee the move.
Mrs. T’s could have chosen to run S/4HANA on its legacy hardware but saw migration to Google Cloud as an opportunity to improve key aspects of its business, in particular data analytics. Historically, sales planning and forecasting involved time-consuming manual processes. But the speed, availability, and scalability of Google Cloud meant that Mrs. T’s could take advantage of S/4HANA’s embedded analytics capabilities. Migrating could also open the door to leveraging Google Cloud’s native integration of SAP data to power Google tools such as BigQuery, Google Cloud AI Building Blocks, and more.
The move to Google Cloud also gave Mrs. T’s an opportunity to update its disaster recovery process. Previously, the company backed up to tape. So, if its SAP systems went down, a member of the IT department would have to drive the most recent tape backups an hour to its cold site, where the disaster recovery partner would load the SAP backup tape, boot the system up, switch network connections to that site, and cross their fingers. Not only would downtime be significant, but restored data would be limited to the periodic tape backup.
“Everything just worked”
Once Mrs. T’s decided to migrate to Google Cloud, the company worked with Rackspace Technology to implement the system. The first phase focused on moving the SAP production environment from on-premises infrastructure to Google Cloud and updating its database to HANA, which took place over 12 weeks. The switchover occurred over a weekend and was all but invisible to users. “We came in on Monday and everything just worked,” recalls Timothy Coyle, Director of Information Systems & Technology. In a second four-month phase, the company transitioned from ECC to S/4.
The move to Google Cloud paid dividends immediately. Batch transactions occurred twice as fast and on-screen end-user transactions rendered instantly. The upgrade also gave the finance team access to embedded analytics and monitoring for the first time. With everything now in the cloud, disaster recovery could be dynamic and nearly instantaneous, with a worst-case scenario of just 5 to 10 minutes of downtime.
“Mrs. T’s needed a skilled and experienced partner that could move its SAP environment to Google Cloud with no negative impacts to its business. We knew this migration was a key initiative in Mrs. T’s digital transformation journey,” says Chuck Britton, Google Partner Development Manager at Rackspace. “We also knew that running SAP on Google Cloud would give the business the fast and flexible analytical capabilities it needed for its SAP data.”
From ideation to production, Mrs. T’s migrated from its legacy on-premises infrastructure to a modern SAP S/4HANA solution on Google Cloud in only seven months, with minimal downtime and zero disruptions. Now that the migration is complete, Mrs. T’s has a flexible, highly scalable environment to run the SAP applications and data that fuel the business. Says Coyle, “Our strategic intent for IT is to make processes simpler, people more productive, and infrastructure more secure. This project fits right square in the middle of that strategic philosophy.”
Learn more about ways in which Google Cloud can transform your SAP experience and about Rackspace Google Cloud solutions for SAP customers.
Data to Business Outcomes with Google’s Data Analytics Design Pattern

6747
Of your peers have already read this article.
1:30 Minutes
The most insightful time you'll spend today!
Companies today are inundated with vast amounts of data from various sources. This overwhelming amount of data is meant to benefit the company, but often leaves data teams feeling overwhelmed, which can create data bottlenecks and result in a slow time to value. In fact, only twenty seven percent of companies agree that data and analytics projects produce insights and recommendations that are highly actionable (Accenture). This means that nearly 3 in 4 companies are not unlocking value in their data, which poses a huge challenge for organizations trying to move the needle and drive real business results. We at Google Cloud, however, saw opportunity in this challenge, which is why we created Data Analytics Design Patterns: cross-product technical solutions designed to accelerate a customer’s path to value realization with their data. These industry solutions bring together product capabilities alongside design methodology, open source deployable code, data models, and reference architectures to accelerate your business outcomes.

With Data Analytics Design Patterns, you get access to more than 30 ready-to-deploy data analytics solutions. Design patterns leverage the best of Google and our rich partner ecosystem, including Technology Partners & System Integrators. In this blog, we will cover 3 examples on how a design pattern can be applied to unlock the value of data:
- Improve mobile app experience with Unified App Analytics
- Maximize digital shop’s revenue with Price Optimization
- Protect internal systems from security and malware threat with Anomaly Detection
Unified App Analytics
If mobile apps are part of your go-to-market strategy, you have several data sources that can provide invaluable customer insights. In addition to tools such as CRM (e.g. Salesforce) and customer care (e.g. Zendesk), you likely use Google Analytics to log app events and Firebase Crashlytics to gather data about app errors. But can you easily combine back-end server data with app front-end data to unlock customer insights?
The Unified App Analytics design pattern makes it easy to plug all the disparate data sources into a single warehouse (BigQuery) and start analyzing it with a Business Intelligence tool (Looker). Once you have a complete and real time view of your customer experience with your app, you can take action. For example, if you notice an increase in app errors, you can quickly combine your Crashlytics data with your CRM data to narrow down the crashes with the highest revenue impact and prioritize their resolution. Further, you can automate your issue resolution workflow by creating a rule for any future crash that impacts a subset of VIP customers.

With the Unified App Analytics design pattern, you’ll gain access to valuable insights about your user experience with your app so you can inform your future app strategy. For example, NPR, an American media company, increased user engagement by showing content that better mapped to listener interests and behaviors.
Price Optimization
In a competitive and hectic global marketplace, strategic pricing matters more than ever, but often projects are consumed by the tedium of standardizing, cleaning, and preparing data—from transactions, inventory, demand, among other sources.
Price Optimization solution allows retailers to build a data driven pricing model. The solution consists of three main components:
- Dataprep by Trifacta: integrates different data sources into a single Common Data Model (CDM). Dataprep is an intelligent data service for visually exploring, cleaning, and preparing structured and unstructured data for analysis, reporting, and machine learning.
- BigQuery: allows you to create and store pricing models in a consistent and scalable way as a serverless Cloud Data Warehouse service
- Looker dashboards: surface insights and enable business teams to take action with enterprise ready BI platform
With the Price Optimization design pattern from Google Cloud and our partner Trifacta, you’ll be able to rapidly unify multiple data sources and create a real-time and ML-powered analysis, leveraging predictive models to estimate future sales. For example, PDPAOLA, an online jewelry company, doubled sales with dynamic pricing adjustments enabled by a single data view.

Anomaly Detection
Organizations need to anticipate and act on risks and opportunities to stay competitive in a digitally transforming society. Anomaly detection helps organizations identify and respond to data points and data trends in high velocity, high volume data sets that deviate from historical standards and expected behaviors, allowing them to take action on changing user needs, mitigate malicious actors and behaviors, and prevent unnecessary costs and monetary losses.
The Anomaly Detection design pattern uses Google Pub/Sub, BigQuery, Dataflow, and Looker to:
- Stream events in real time
- Process the events, extract useful data points, train the detection algorithm of choice
- Apply the detection algorithm in near-real time to the events to detect anomalies
- Update dashboards and/or send alerts
The challenge of finding the important insights and anomalies in vast amounts of data applies to organizations across all industries and lines of business, but is especially important to protecting the security of an organization. For example, TELUS, a national communications company, modernized their security analytics platform leveraging this pattern, allowing them to detect anomalies in near real time to detect and mitigate suspicious activity.
Get started
Turn your data into business outcomes with Google Cloud and our broad partner ecosystem by deploying Data Analytics Design Patterns at your organization. There are more than 30 Data Analytics Design Patterns ready for you to use. We have more than 200+ more ideas in the pipeline, so be sure to check in regularly as new patterns will be added soon.
To dive deeper and find out more about how Data Analytics Design Patterns can help your organization accelerate use cases and create faster time to value, check out this video.
Unlocking the Potential of Advanced Analytics with BigQuery and Connected Vehicle Data

2883
Of your peers have already read this article.
2:30 Minutes
The most insightful time you'll spend today!
As software-defined vehicles continue to advance and the quantity of digital services grows to meet consumer demand, the data required to provide these services continue to grow as well. This makes automotive manufacturers and suppliers look for capabilities to log and analyze data, update applications, and extend commands to in-vehicle software.
The challenges the automotive sector faces can be quantified. A modern vehicle contains upwards of 70 electronic control units (ECUs), most of which are connected to one or more sensors. Not only is it now possible to exactly measure many aspects of vehicle performance, but new options become available. Using LIDAR (light detection and ranging), for example, vehicles are achieving higher levels of autonomy; this leads to a data stream from such demanding applications that may reach 25 GB per hour. For the in-vehicle processing of data, 100 million lines of software code may be present — more than a fighter jet. This in-vehicle code will have to be maintained with updates and new functionalities.
Access to the data will allow manufacturers to gain valuable insights into operational details of their vehicles. The use of this data can help to reduce costs and risks, increase ROI, support ESG initiatives, and provide valuable insights to develop innovative solutions and shorten the time to value for Electric Vehicle innovations.
Sibros’ Deep Connected Platform (DCP) makes it possible for these manufacturers to build and launch new connected vehicle use cases from production to post-sale at scale by connecting and managing all software and data throughout every life cycle stage. A key component of this platform is the Sibros Deep Logger that provides capabilities like the following:
- Full configurability of what to record, when to record it, and how fast to record it.
- High resolution timestamps of all Controller Area Network (CAN) messages.
- Dynamic application of live log configurations to receive new data points without deploying new software.
For example, properly analyzed engine data enables true predictive maintenance for the first time, which creates the option to repair or replace components before failure happens. Another example would be the evaluation of data regarding the use of certain in-car features with the goal to redesign its interior.
Two other components of the DCP are software updates and remote commands to ECUs. The DCP on Google Cloud enables seamless integration with any vehicle architecture and provides OEMs and suppliers with the platform to manage connected vehicle data at rest and in transit using a proven and secure way on a global scale.
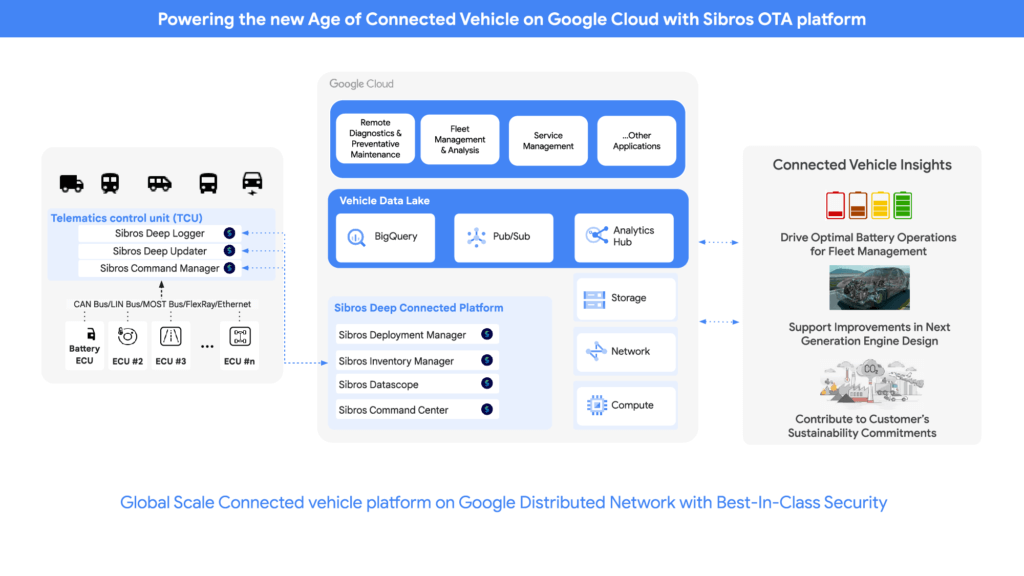
OEMs can pull data through APIs provided by Sibros into Google Data Cloud (including BigQuery) to gain access to the rich information data sets provided by the DCP within their environment and blend this data with their first party data sets to provide value insights for their business. Some of the Connected Vehicle insights that DCP information enables are:
- Damage prevention, improved operation, or development of the next generation of engines with insights from complex analyses that could consider parameters like model, engine type, mileage, overall speed, temperature, air pressure, load, services, and more.
- The combination of electric vehicle battery usage data like charging cycles, engine performance, and battery age with contributing factors as the use of the air conditioning to determine if such factors contribute to hazardous battery conditions and for improved battery development.
- Cross-organization collaboration in R&D by the provision of information on all these metrics and more from real-world driving, like engine knock data and even tire pressure.
- Google Cloud’s unified data cloud offering provides a complete platform for building data-driven applications like those from Sibros — from simplified data ingestion, processing, and storage to powerful analytics, AI, ML, and data sharing capabilities — integrated with Google Cloud. With a diverse partner ecosystem and support for multi-cloud, open-source tools and APIs, Google Cloud provides Sibros the portability and the extensibility they need to avoid data lock-in.
“Software has an ever increasing importance in the automotive world, even more so with electric vehicles and new mobility services. Google Cloud is partnering with Sibros to bring their award winning Deep Connected Platform to deliver high frequency, low latency over-the-air software updates, data logging & diagnostics capabilities to our automotive customers, leveraging the security and scale of Google Cloud. This is revolutionizing everything from development cycles to business models and customer relationships.” — Matthias Breunig, Director, Global Automotive Solutions, Google Cloud
Through Built with BigQuery, Google Cloud is helping tech companies like Sibros build innovative applications on Google’s Data Cloud with simplified access to technology, helpful and dedicated engineering support, and joint go-to-market programs.
“Sibros is looking forward to partnering with Google Cloud, which will enable vehicle manufacturers and suppliers to reach the next level in their use of data. Sibros solutions for Deep Data Logging and Updating on the Google Data Cloud, combined with Google BigQuery, will help them to mitigate risks, reduce costs, add innovative products, and introduce value-added use cases.” — Xiaojian Huang, Chief Digital Officer, Software, Sibros
Sibros and Google Cloud are driving Connected Mobility transformation to help our customers accelerate R&D innovation, power efficient operations, and unlock software-defined vehicle use cases with a full stack connected vehicle platform. Click here to learn more about Sibros on Google Cloud.
How Constellation Brands’ Direct-to-Customer Tech Delivers Economic Impact across Business Portfolio

6294
Of your peers have already read this article.
3:00 Minutes
The most insightful time you'll spend today!
Editor’s note: Today we’re hearing from Ryan Mason, Director, Head of DTC Growth & Strategy, at alcoholic beverage firm, Constellation Brands on the company’s shift to Direct-to-Consumer (DTC) sales and how Google Cloud’s powerful technology stack helped with this transformation.
It’s no secret that consumer businesses have been up-ended in a lasting manner after 18 months of the pandemic. Consumers have been forced to shop differently over the past year – and as a result, they’ve evolved to be more comfortable with online spending and have grown to expect a certain level of convenience. While the e-commerce share of consumer sales has grown steadily over the past decade, the pandemic was the catalyst for the famous “10 years of growth in 3 months” which many argue is here to stay.
Facing this reality head-on, we placed a new emphasis on Direct-to-Consumer (DTC) with our acquisition of Empathy Wines, a DTC-native wine brand that sells directly to consumers via e-commerce. To accelerate our innovation in the DTC space, we added headcount and new functions to the existing Empathy team and empowered the newly-minted DTC group to apply their digital commerce operating model across the rest of the wine and spirits portfolio, which includes Robert Mondavi Winery, Meiomi Wines, The Prisoner Wine Company, High West Whiskey, and more.
One pandemic and one year later, DTC sales have surged in the wine and spirits category with Constellation positioned as a leader armed with a unique and powerful cloud technology stack, best-in-class e-commerce user experiences, modernized fulfillment solutions, and data-driven growth marketing.
Benefits of Going DTC
A report from McKinsey estimates that the strategic business shift to DTC has been accelerated by two years because of the pandemic and argues that consumer brands that want to thrive will need to aim for a 20% DTC business or higher, which is already taking shape in the market: Nike’s direct digital channels are on track to make up 21.5% of the total business by the end of 2021, up from 15.5% in the last fiscal year, and Adidas is aiming for 50% DTC by 2025. But outside of the clear revenue upside, the auxiliary benefits of going DTC are robust.
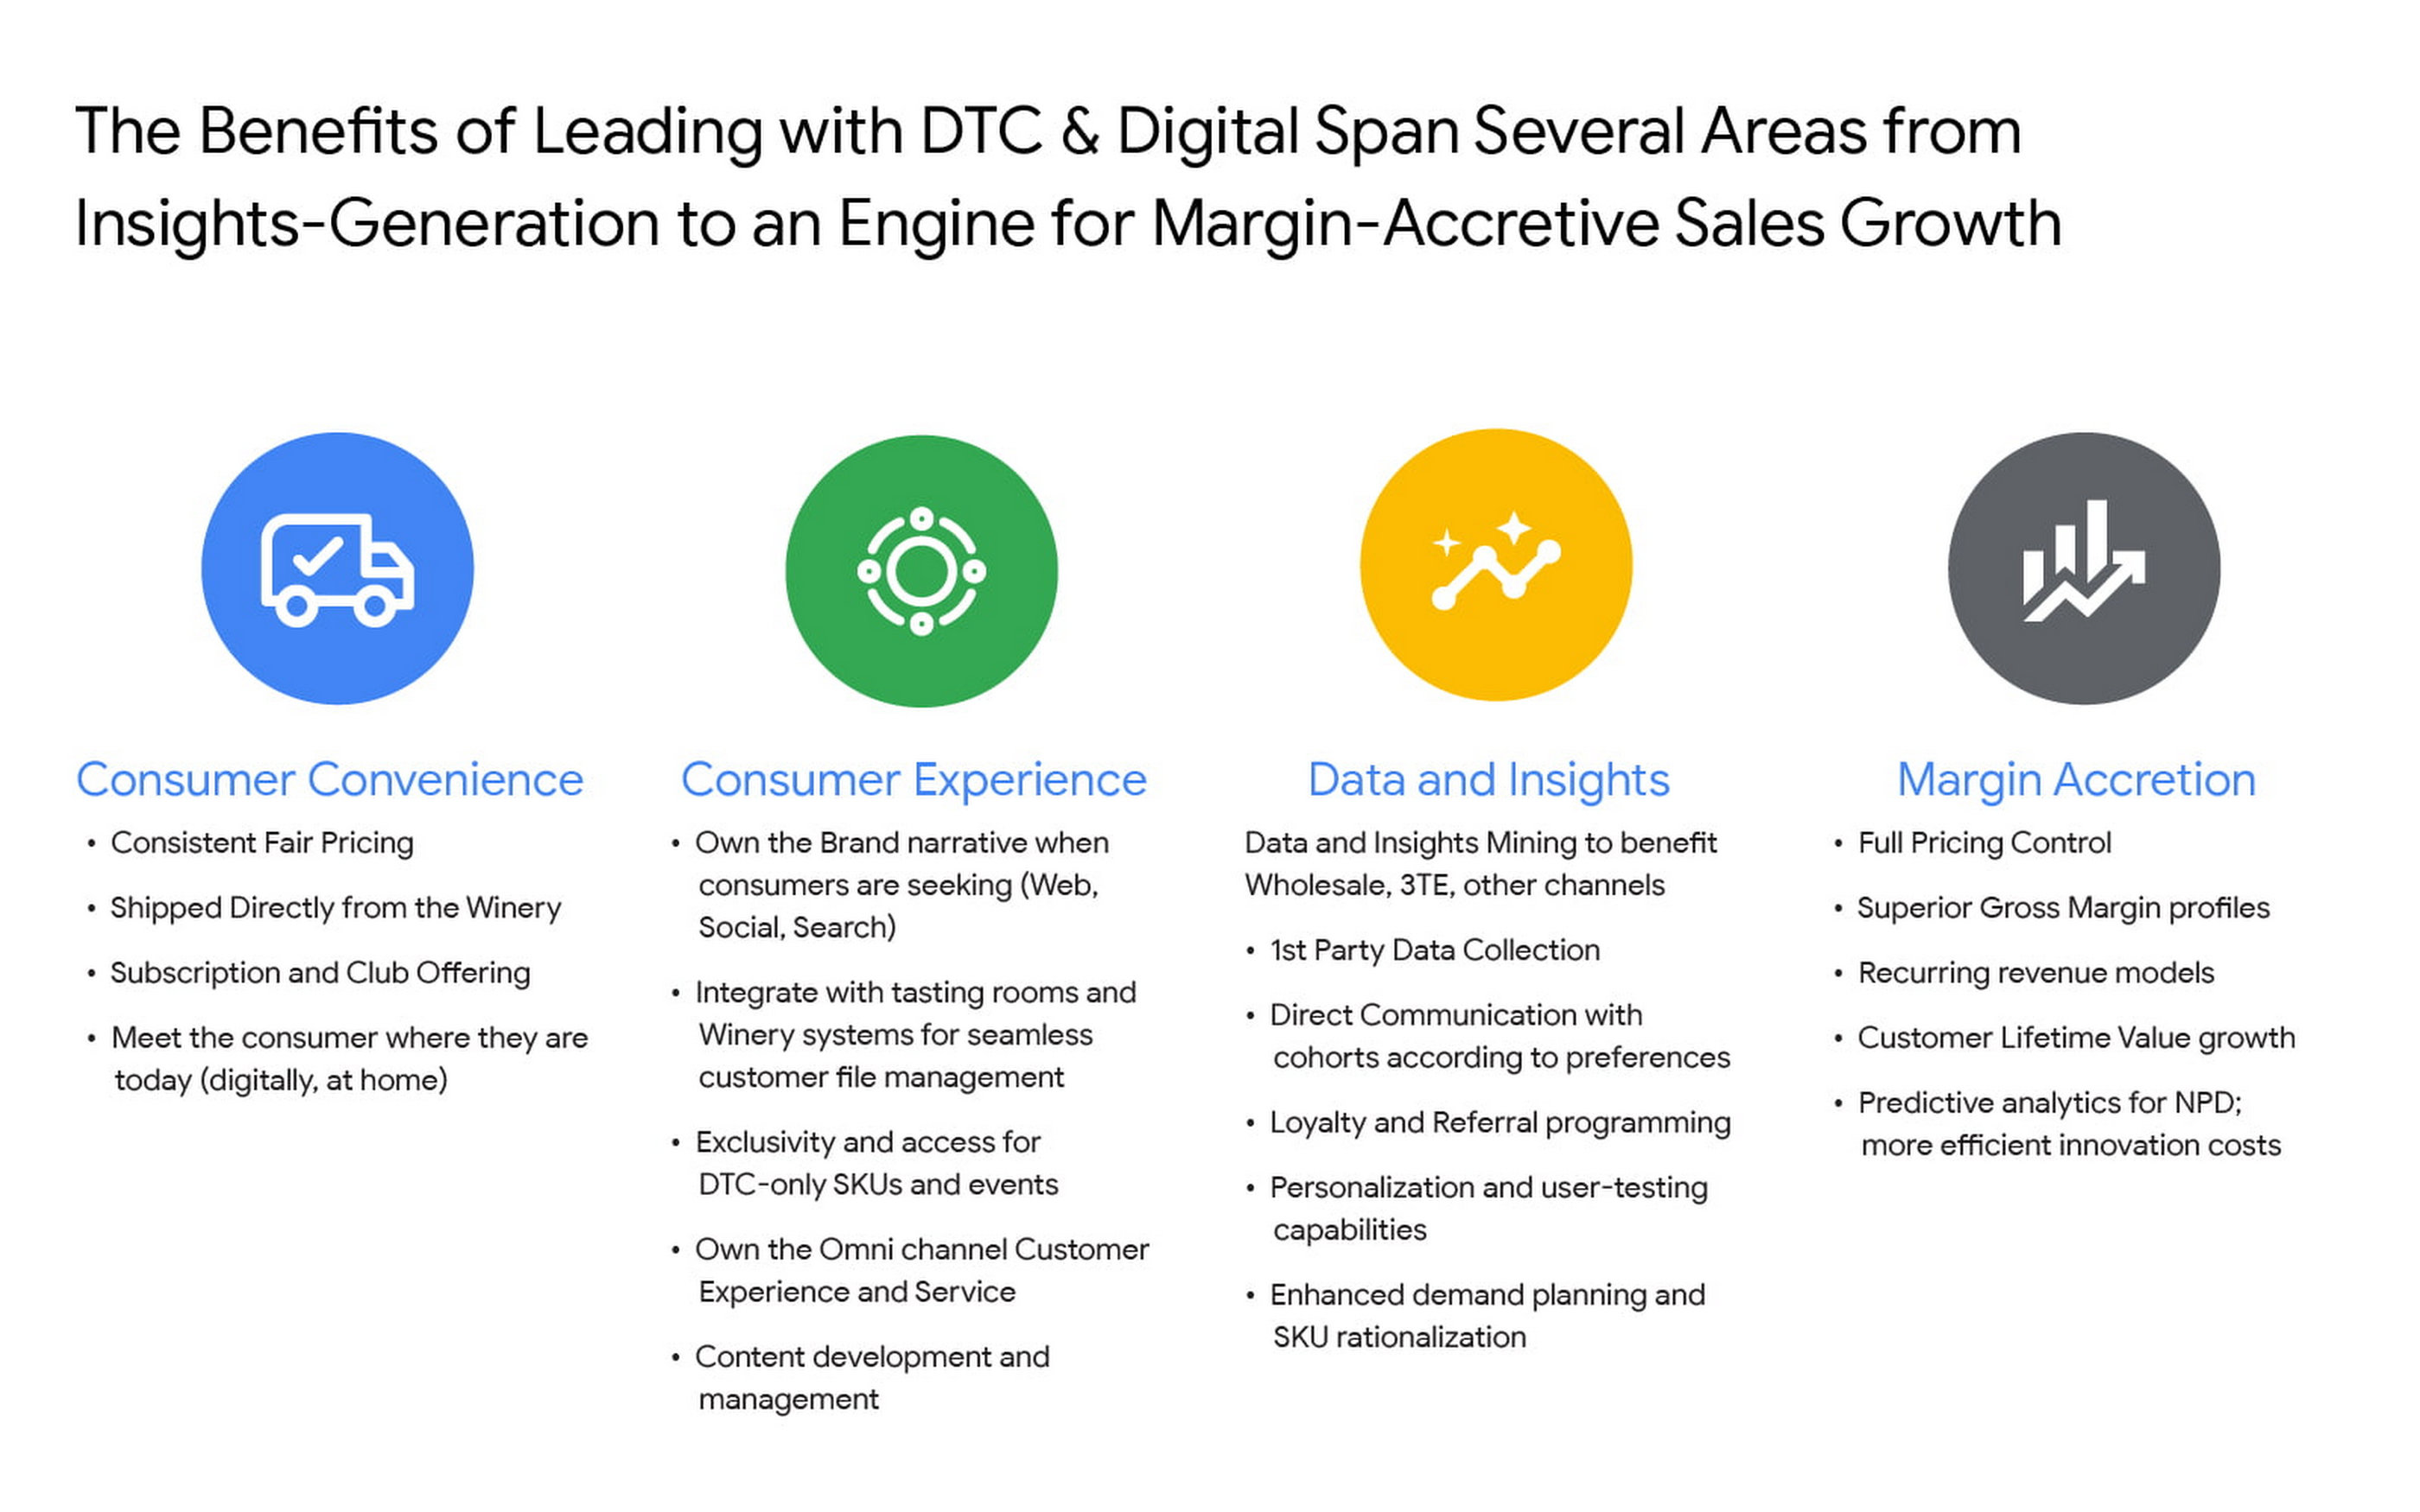
For Constellation Brands, each of these four pillars ring true, and our shift toward DTC is as much about margin accretion and revenue mix management as it is about consumer insights and data. The added complexities of the alcohol space add wrinkles to our DTC approach and manifest in many areas like consumer shopping preference, shipping and logistics hurdles, and more. In order to win share early and continue to lead the category, we recognized the need to harness the immense amount of first-party data to power impactful and actionable insights.
Our DTC technology architecture has fostered a value chain that is completely digitized: website traffic, marketing expenditures, tasting room transactions, e-commerce transactions, logistics and fulfillment events, cost of goods sold (COGS) and margin profiles, etc. are recorded and stored in a data warehouse in real time. For the first time, at any given moment, we can easily and deterministically answer complex business questions like “what is the age and gender distribution of my customers from Los Angeles who have purchased SKU X from Brand.com Y in the last 6 months? What is the cohort net promoter score? Did that increase after we introduced same-day shipping in this zip code? By how much?”
The ability to answer these questions and understand the root causes allows us to stay nimble with product offerings and iterate marketing strategies at the speed of consumer preference. Further, it enables us to optimize our omnichannel presence in the same manner by leaning on DTC consumer insights to develop valuable strategies with key wholesale distribution partners and 3-Tier eCommerce partners like Drizly and Instacart. At its core, Constellation’s DTC practice is designed to be the consumer-centric “tip-of-the-spear” responsible for generating insights from which all sales channels, including wholesale, can benefit.
Constellation’s DTC technology approach prioritizes consumer-centricity and insights generation
We have taken a modern approach to building a digital commerce technology stack, leveraging a hub-and-spoke model built around Shopify Plus and other key emergent technology providers like email provider Klaviyo, loyalty platform Yotpo, Net Promoter Score measurer Delighted, Customer Service module Gorgias, payments processor Stripe, event reservations platform Tock, and many more. For digital marketing and analytics, we use Google Cloud and Google Marketing Platform, which includes products like Analytics 360, Tag Manager 360, and Search Ads 360.
To help gather, organize, and store all of the inbound data from the ecosystem, we partnered with SoundCommerce, a data processing platform for eCommerce businesses. Together with SoundCommerce, we are able to automate data ingestion from all endpoints into a central data warehouse in Google BigQuery. With BigQuery, our data team is able to break data silos and quickly analyze large volumes of data that help unlock actionable insights about our business. BigQuery itself allows for out-of-the-box predictive analytics using SQL via BigQuery ML, and a key differentiator for us is that all Google Marketing Platform data is natively accessible for analysis within BigQuery.
But data possession only addresses half of the opportunity: we needed a powerful and modern business intelligence platform to help make sense of the vast amounts of data flowing into the system. Core to the search was to find a partner that approached BI in a way that fit with our future-looking strategy.
Our DTC team relies on the accurate measurement of variable metrics like Customer Acquisition Cost (CAC), Customer Lifetime Value (CLV), Churn, and Net Promoter Score (NPS) as a bellwether of the health of the business and monitoring these figures on a daily basis is paramount to success. To enable us to keep an accurate pulse on strategic KPIs, we considered several incumbent BI platforms. Ultimately we selected Google Cloud’s Looker for a range of benefits that separated it from the rest of the pack.

From a vision perspective, in this particular case we felt Looker was most aligned with our belief that better decisions are made when everyone has access to accurate, up-to-date information. Looker allows us to realize that vision by surfacing data in a simple web-based interface that empowers everyone to take action with real-time data on critical commercial activities. Furthermore, Looker’s ability to automate and distribute formatted modules to a myriad of stakeholders on a regular cadence increases data literacy and business performance transparency.
From a product perspective, we chose Looker for it’s cloud offering, web-based interface, and centralized, agile modeling layer that creates a trusted environment for all users to confidently interact with data — without any actual data extraction. While other BI tools have centralized semantic layers that require skilled IT resources, we’ve experienced that those can lead to bottlenecks and limited agility. With Looker’s semantic layer, LookML, our BI Team, led by Peter Donald, can easily build upon their SQL knowledge to add both a high degree of control as well as flexibility to our data model. The fully browser-based development environment allows the data team to rapidly develop, test, and deploy code and is backed by robust and seamless Git source code management.
In parallel, LookML empowers business users to collaborate without the need for advanced SQL knowledge. Our data team curates interactive data experiences with Looker to help scale access and adoption. Business users can explore ad hoc analysis, create dashboards, and develop custom data experiences in the web-based environment to get the answers they need without relying on IT resources each time they have a new question, while also maintaining the confidence that the underlying data will always be accurate. This helps us meet our primary goal of providing all businesses users with the data access they need to monitor the pulse of key metrics in near real-time.
Impact and future of DTC BI at Constellation
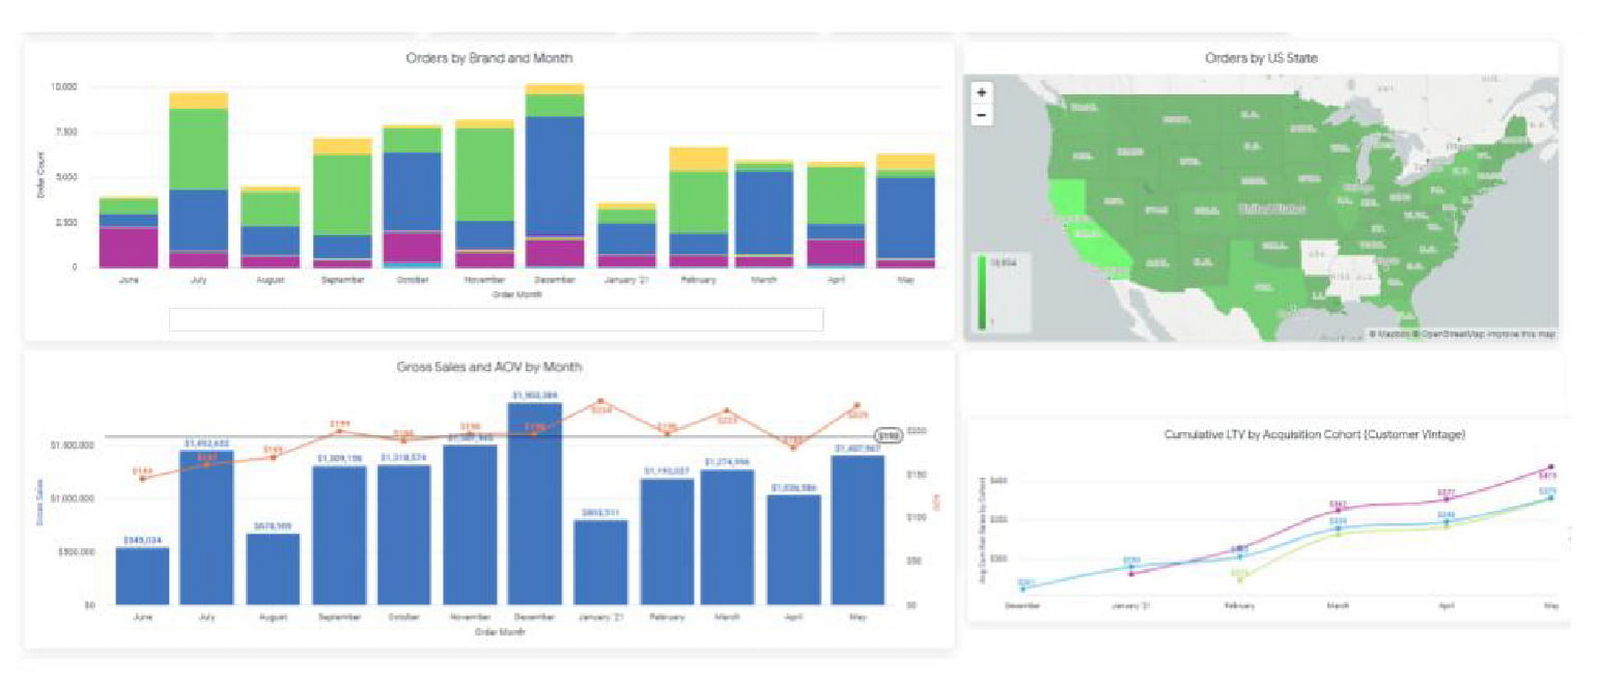
In short order, taking a modern and integrated approach to the DTC technology stack has delivered economic impact across the portfolio, helping our team understand and combat customer churn, increase conversion rates, and optimize the customer acquisition cost (CAC) and customer lifetime value (CLV) ratios. Perhaps most important is the benefit it can provide to the customer base. Mining customer data and consumer behavior generates data into what our customers are seeking, giving us insights to supply more, or less of it. For example, observing sales velocity and conversion rates by SKU or by region can help us better understand changes in customer taste profiles and fluctuations in demand, providing the foundation for a more powerful innovation pipeline and more effective sales and distribution tactics in wholesale. Our team has also been an early pilot tester for Looker’s new integration with Customer Match, which contributes to the virtuous cycle between data insight and data activation. In the future, our plan is to leverage this cycle to amplify the impact of Google Ads across Search, Shopping, and YouTube placements for the wine and spirits portfolio.
The operational impact of Looker is also substantial: our team estimates that the number of hours needed to reach critical business decisions has been reduced by nearly 60%, boosting productivity and accelerating the daily operating rhythm. A thoughtfully curated technology stack together with a modern BI solution allows us to stay at the vanguard of the industry. While the DTC sales channel is not designed to surpass the core business of wholesale for Constellation in terms of size, the approach enables unparalleled insights and measurement abilities that will pay dividends for the entire business for years to come.
More Relevant Stories for Your Company

How to Pick a Database that is Suitable for Your Application
Picking the right database for your application is not easy. The choice depends heavily on your use case—transactional processing, analytical processing, in-memory database, and so on—but it also depends on other factors. This post covers the different database options available within Google Cloud across relational (SQL) and non-relational (NoSQL) databases

Wayfair Writes its Success Story with BigQuery for Internal Analytics
Editor’s note: Home-goods and furniture giant Wayfair first partnered up with Google Cloud to transform and scale its storefront—work that proved its value many times over during the unprecedented surge in ecommerce traffic during 2020. Today, we hear how BigQuery’s performance and cost optimization have transformed the company’s internal analytics

Google and AI Researchers Work towards Building Data-centric AI
AI researchers and engineers need better data to enable better AI solutions. The quality of an AI solution is determined by both the learning algorithm (such as a deep-neural network model) and the datasets used to train and evaluate that algorithm. Historically, AI research has focused much more on algorithms

Datashare for Financial Services: Securing the Publishers and Consumers’ Access to Market Data
Access to the cloud has advanced the distribution and consumption of financial information on a global scale. In parallel, the global financial data landscape has been transformed by an influx of alternative data sources, including social media, meteorological data, satellite imagery, and other data. Exchanges and market data providers now
