





Make Meaningful Analysis with Geo Boundary Public Datasets on BigQuery

6329
Of your peers have already read this article.
4:00 Minutes
The most insightful time you'll spend today!
Geospatial data is a critical component for a comprehensive analytics strategy. Whether you are trying to visualize data using geospatial parameters or do deeper analysis or modeling on customer distribution or proximity, most organizations have some type of geospatial data they would like to use – whether it be customer zipcodes, store locations, or shipping addresses. However, converting geographic data into the correct format for analysis and aggregation at different levels can be difficult. In this post, we’ll walk through some examples of how you can leverage the Google Cloud platform alongside Google Cloud Public Datasets to perform robust analytics on geographic data. The full queries can be accessed from this notebook here.
Public US Geo Boundaries dataset
BigQuery hosts a slew of public datasets for you to access and integrate into your analytics. Google pays for the storage of these datasets and provides public access to the data via the bigquery-public-data project. You only pay for queries against the data. Plus, the first 1 TB per month is free! These public datasets are valuable on their own, but when joined against your own data they can unlock new analytics use cases and save the team a lot of time.
Within the Google Cloud Public Datasets Program there are several geographic datasets. Here, we’ll work with the geo_us_boundaries dataset, which contains a set of tables that have the boundaries of different geospatial areas as polygons and coordinates based on the center point (GEOGRAPHY column type in BigQuery), published by the US Census Bureau.

Mapping geospatial points to hierarchical areas
Many times you will find yourself in situations where you have a string representing an address. However, most tools require lat/long coordinates to actually plot points. Using the Google Maps Geocoding API we can convert an address into a lat/long and then store the results in the BigQuery table.
With a lat/long representation of our point, we can join our initial dataset back onto any of the tables here using the ST_WITHIN function. This allows us to check and see if a point is within the specified polygon.
ST_WITHIN(geography_1, geography_2)
This can be helpful for ensuring standard nomenclature; for example, metropolitan areas that might be named differently. The query below maps each customers’ address to a given metropolitan area name.
SELECTcust.id as customer_id,metro.name as metro_nameFROM `looker-private-demo.retail.customers` as cust,`bigquery-public-data.geo_us_boundaries.metropolitan_divisions` as metroWHERE ST_WITHIN(ST_GEOGPOINT(cust.longitude, cust.latitude),metro.metdiv_geom)
It can also be useful for converting to designated market area (DMA), which is often used in creating targeted digital marketing campaigns.
SELECTcust.id as customer_id,dma.dma_nameFROM `looker-private-demo.retail.customers` as cust,`bigquery-public-data.geo_us_boundaries.designated_market_area` as dmaWHERE ST_WITHIN(ST_GEOGPOINT(cust.longitude, cust.latitude),dma.dma_geom)
Or for filling in missing information; for example, some addresses may be missing zip code which results in incorrect calculations when aggregating up to the zipcode level. By joining onto the zip_codes table we can ensure all coordinates are mapped appropriately and aggregate up from there.
SELECTzip.zip_code,count(distinct cust.id) as unique_customersFROM `looker-private-demo.retail.customers` as cust,`bigquery-public-data.geo_us_boundaries.zip_codes` as zipWHERE ST_WITHIN(ST_GEOGPOINT(cust.longitude, cust.latitude),zip.zip_code_geom)GROUP BY 1
Note that the zip code table isn’t a comprehensive list of all US zip codes, they are zip code tabulation areas (ZCTAs). Details about the differences can be found here. Additionally, the zip code table gives us hierarchical information, which allows us to perform more meaningful analytics. One example is leveraging hierarchical drilling in Looker. I can aggregate my total sales up to the country level, and then drill down to state, city and zipcode to identify where sales are highest. You can also use the BigQuery GeoViz tool to visualize geospatial data!

Aside from simply checking if a point is within an area, we can also use ST_DISTANCE to do something like find the closest city using the centerpoint for the metropolitan area table.
SELECTcust.id as customer_id,ARRAY_AGG(metro.name order by ST_DISTANCE(ST_GEOGPOINT(cust.longitude, cust.latitude),metro.internal_point_geom) asc limit 1)[offset(0)] as metro_nameFROM`looker-private-demo.retail.customers` as cust,`bigquery-public-data.geo_us_boundaries.metropolitan_divisions` as metroGROUP BY cust.id
This concept doesn’t just hold true for points, we can also leverage other GIS functions to see if a geospatial area is contained within areas that are listed in the boundaries datasets. If your data comes into BigQuery as a GeoJSON string, we can convert it to a GEOGRAPHY type using the ST_GEOGFROMGEOJSON function. Once our data is in a GEOGRAPHY type we can do things like check to see what urban area the geo is within – using either ST_WITHIN or ST_INTERSECTS to account for partial coverage. Here, I am using the customer’s zip code to find all metropolitan divisions where the zip code polygon and the metropolitan polygon intersect. I am then selecting the metropolitan area that has the most overlap (or the intersection has the largest area) to be the customer’s metro that we use for reporting.
SELECTcust.id as customer_id,ARRAY_AGG(metro.name order by ST_AREA(ST_INTERSECTION(zip.zip_code_geom,metro.metdiv_geom)) desc limit 1)[offset(0)] as metro_nameFROM`looker-private-demo.retail.customers` as custJOIN `bigquery-public-data.geo_us_boundaries.zip_codes` as zip on cust.zip=zip.zip_code,`bigquery-public-data.geo_us_boundaries.metropolitan_divisions` as metroWHERE ST_INTERSECTS(zip.zip_code_geom,metro.metdiv_geom)GROUP BY cust.id
The same ideas can be applied to the other tables in the dataset including the county, urban areas and National Weather Service forecast regions (which can also be useful if you want to join your datasets onto weather data).
Correcting for data discrepancy
One problem that we may run into when working with geospatial data is that different data sources may have different representations of the same information. For example, you might have one system that records state as a two letter abbreviation and another using the full name. Here, we can use the state table to join the different datasets.
SELECTst.state_name,sum(ab.sales+fn.sales) as total_salesFROM `bigquery-public-data.geo_us_boundaries.states` as stLEFT JOIN abbreviated_table as ab on ab.state = st.stateLEFT JOIN fullname_table as fn on fn.state = st.state_nameWHERE COALESCE(ab.state, fn.state) IS NOT NULLGROUP BY 1
Another example might be using the tables as a source of truth for fuzzy matching. If the address is a manually entered field somewhere in your application, there is a good chance that things will be misspelled. Different representations of the same name may prevent tables from joining with each other or lead to duplicate entries when performing aggregations. Here, I use a simple Soundex algorithm to generate a code for each county name, using helper functions from this blog post. We can see that even though some are misspelled they have the same Soundex code.

Next, we can join back onto our counties table so we make sure to use the correct spelling of the county name. Then, we can simply aggregate our data for more accurate reporting.
SELECTc.county_name,sum(sales) as total_salesFROMtableJOIN `bigquery-public-data.geo_us_boundaries.counties` as con testing.dq_fm_Soundex(table.county) = testing.dq_fm_Soundex(c.county_name)WHERE c.state_fips_code = cast(36 as string)GROUP BY 1
Note that fuzzy matching definitely isn’t perfect and you might need to try different methods or apply certain filters for it to work best depending on the specifics of your data.
The US Geo Boundary datasets allow you to perform meaningful geographic analysis without needing to worry about extracting, transforming or loading additional datasets into BigQuery. These datasets, along with all the other Google Cloud Public Datasets, will be available in the Analytics Hub. Please sign up for the Analytics Hub preview, which is scheduled to be available in the third quarter of 2021, by going to g.co/cloud/analytics-hub.

TPUs Can Cut Deep Learning Costs by upto 80%—and Other Things You Didn’t Know About TPUs
DOWNLOAD E-BOOK3517
Of your peers have already downloaded this article
6:15 Minutes
The most insightful time you'll spend today!
The Tensor Processing Unit (TPU) is a custom ASIC chip—designed from the ground up by Google for machine learning workloads—that powers several of Google’s major products including Translate, Photos, Search Assistant and Gmail.
Cloud TPU provides the benefit of the TPU as a scalable and easy-to-use cloud computing resource to all developers and data scientists running cutting-edge ML models on Google Cloud.
But what is a TPU, how is it different from CPUs and GPUs, and how much does it lower cost by?
Download the whitepaper, What Makes TPUs Fine-tuned for Deep Learning?, to find out:
- Back to the basics: How CPUs and GPUs work
- The difference between CPUs, GPUs and TPUs
- Why TPUs are best-suited for deep-learning workloads
- Cost-benefit analysis: How much you can save by leveraging TPU-architecture

3392
Of your peers have already listened to this podcast
30:54 Minutes
The most insightful time you'll spend today!
AI-as-a-Service is Here. It’s Really Almost Plug-and-Play
Geospatial data is a critical component for a comprehensive analytics strategy. Whether you are trying to visualize data using geospatial parameters or do deeper analysis or modeling on customer distribution or proximity, most organizations have some type of geospatial data they would like to use – whether it be customer zipcodes, store locations, or shipping addresses. However, converting geographic data into the correct format for analysis and aggregation at different levels can be difficult. In this post, we’ll walk through some examples of how you can leverage the Google Cloud platform alongside Google Cloud Public Datasets to perform robust analytics on geographic data. The full queries can be accessed from this notebook here.
Public US Geo Boundaries dataset
BigQuery hosts a slew of public datasets for you to access and integrate into your analytics. Google pays for the storage of these datasets and provides public access to the data via the bigquery-public-data project. You only pay for queries against the data. Plus, the first 1 TB per month is free! These public datasets are valuable on their own, but when joined against your own data they can unlock new analytics use cases and save the team a lot of time.
Within the Google Cloud Public Datasets Program there are several geographic datasets. Here, we’ll work with the geo_us_boundaries dataset, which contains a set of tables that have the boundaries of different geospatial areas as polygons and coordinates based on the center point (GEOGRAPHY column type in BigQuery), published by the US Census Bureau.
Mapping geospatial points to hierarchical areas
Many times you will find yourself in situations where you have a string representing an address. However, most tools require lat/long coordinates to actually plot points. Using the Google Maps Geocoding API we can convert an address into a lat/long and then store the results in the BigQuery table.
With a lat/long representation of our point, we can join our initial dataset back onto any of the tables here using the ST_WITHIN function. This allows us to check and see if a point is within the specified polygon.
ST_WITHIN(geography_1, geography_2)
This can be helpful for ensuring standard nomenclature; for example, metropolitan areas that might be named differently. The query below maps each customers’ address to a given metropolitan area name.
SELECTcust.id as customer_id,metro.name as metro_nameFROM `looker-private-demo.retail.customers` as cust,`bigquery-public-data.geo_us_boundaries.metropolitan_divisions` as metroWHERE ST_WITHIN(ST_GEOGPOINT(cust.longitude, cust.latitude),metro.metdiv_geom)
It can also be useful for converting to designated market area (DMA), which is often used in creating targeted digital marketing campaigns.
SELECTcust.id as customer_id,dma.dma_nameFROM `looker-private-demo.retail.customers` as cust,`bigquery-public-data.geo_us_boundaries.designated_market_area` as dmaWHERE ST_WITHIN(ST_GEOGPOINT(cust.longitude, cust.latitude),dma.dma_geom)
Or for filling in missing information; for example, some addresses may be missing zip code which results in incorrect calculations when aggregating up to the zipcode level. By joining onto the zip_codes table we can ensure all coordinates are mapped appropriately and aggregate up from there.
SELECTzip.zip_code,count(distinct cust.id) as unique_customersFROM `looker-private-demo.retail.customers` as cust,`bigquery-public-data.geo_us_boundaries.zip_codes` as zipWHERE ST_WITHIN(ST_GEOGPOINT(cust.longitude, cust.latitude),zip.zip_code_geom)GROUP BY 1
Note that the zip code table isn’t a comprehensive list of all US zip codes, they are zip code tabulation areas (ZCTAs). Details about the differences can be found here. Additionally, the zip code table gives us hierarchical information, which allows us to perform more meaningful analytics. One example is leveraging hierarchical drilling in Looker. I can aggregate my total sales up to the country level, and then drill down to state, city and zipcode to identify where sales are highest. You can also use the BigQuery GeoViz tool to visualize geospatial data!
Aside from simply checking if a point is within an area, we can also use ST_DISTANCE to do something like find the closest city using the centerpoint for the metropolitan area table.
SELECTcust.id as customer_id,ARRAY_AGG(metro.name order by ST_DISTANCE(ST_GEOGPOINT(cust.longitude, cust.latitude),metro.internal_point_geom) asc limit 1)[offset(0)] as metro_nameFROM`looker-private-demo.retail.customers` as cust,`bigquery-public-data.geo_us_boundaries.metropolitan_divisions` as metroGROUP BY cust.id
This concept doesn’t just hold true for points, we can also leverage other GIS functions to see if a geospatial area is contained within areas that are listed in the boundaries datasets. If your data comes into BigQuery as a GeoJSON string, we can convert it to a GEOGRAPHY type using the ST_GEOGFROMGEOJSON function. Once our data is in a GEOGRAPHY type we can do things like check to see what urban area the geo is within – using either ST_WITHIN or ST_INTERSECTS to account for partial coverage. Here, I am using the customer’s zip code to find all metropolitan divisions where the zip code polygon and the metropolitan polygon intersect. I am then selecting the metropolitan area that has the most overlap (or the intersection has the largest area) to be the customer’s metro that we use for reporting.
SELECTcust.id as customer_id,ARRAY_AGG(metro.name order by ST_AREA(ST_INTERSECTION(zip.zip_code_geom,metro.metdiv_geom)) desc limit 1)[offset(0)] as metro_nameFROM`looker-private-demo.retail.customers` as custJOIN `bigquery-public-data.geo_us_boundaries.zip_codes` as zip on cust.zip=zip.zip_code,`bigquery-public-data.geo_us_boundaries.metropolitan_divisions` as metroWHERE ST_INTERSECTS(zip.zip_code_geom,metro.metdiv_geom)GROUP BY cust.id
The same ideas can be applied to the other tables in the dataset including the county, urban areas and National Weather Service forecast regions (which can also be useful if you want to join your datasets onto weather data).
Correcting for data discrepancy
One problem that we may run into when working with geospatial data is that different data sources may have different representations of the same information. For example, you might have one system that records state as a two letter abbreviation and another using the full name. Here, we can use the state table to join the different datasets.
SELECTst.state_name,sum(ab.sales+fn.sales) as total_salesFROM `bigquery-public-data.geo_us_boundaries.states` as stLEFT JOIN abbreviated_table as ab on ab.state = st.stateLEFT JOIN fullname_table as fn on fn.state = st.state_nameWHERE COALESCE(ab.state, fn.state) IS NOT NULLGROUP BY 1
Another example might be using the tables as a source of truth for fuzzy matching. If the address is a manually entered field somewhere in your application, there is a good chance that things will be misspelled. Different representations of the same name may prevent tables from joining with each other or lead to duplicate entries when performing aggregations. Here, I use a simple Soundex algorithm to generate a code for each county name, using helper functions from this blog post. We can see that even though some are misspelled they have the same Soundex code.
Next, we can join back onto our counties table so we make sure to use the correct spelling of the county name. Then, we can simply aggregate our data for more accurate reporting.
SELECTc.county_name,sum(sales) as total_salesFROMtableJOIN `bigquery-public-data.geo_us_boundaries.counties` as con testing.dq_fm_Soundex(table.county) = testing.dq_fm_Soundex(c.county_name)WHERE c.state_fips_code = cast(36 as string)GROUP BY 1
Note that fuzzy matching definitely isn’t perfect and you might need to try different methods or apply certain filters for it to work best depending on the specifics of your data.
The US Geo Boundary datasets allow you to perform meaningful geographic analysis without needing to worry about extracting, transforming or loading additional datasets into BigQuery. These datasets, along with all the other Google Cloud Public Datasets, will be available in the Analytics Hub. Please sign up for the Analytics Hub preview, which is scheduled to be available in the third quarter of 2021, by going to g.co/cloud/analytics-hub.
This Diagnostic Company is Revolutionising Healthcare Delivery with AI
5395
Of your peers have already read this article.
5:30 Minutes
The most insightful time you'll spend today!
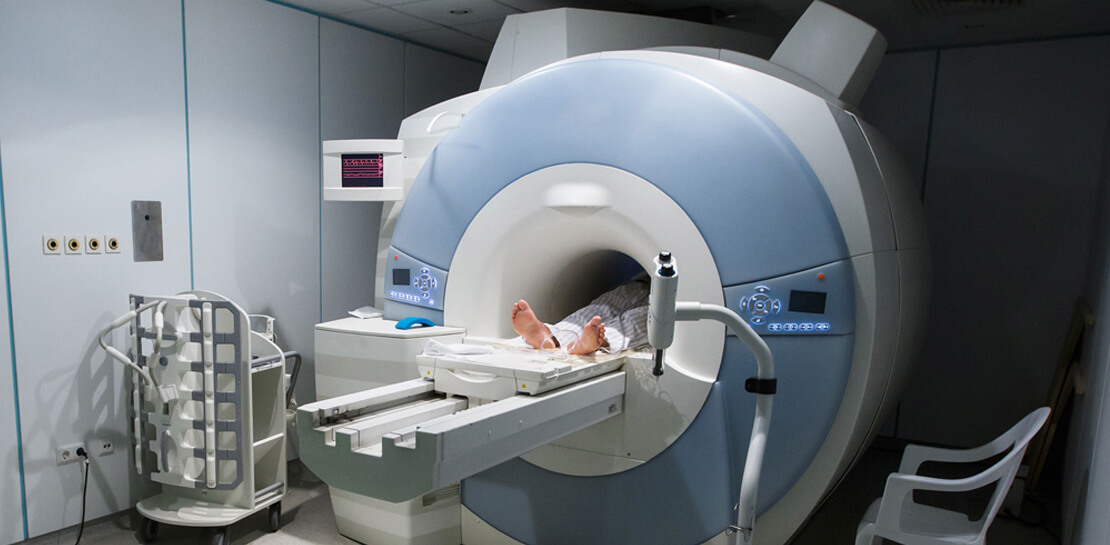
Dr. Elliot Smith cannot be accused of lacking ambition. A high achiever with a Ph.D. in Electrical Engineering and a specialist in magnetic resonance imaging (MRI) systems, Smith aims to deliver top quality healthcare to anyone in the world — regardless of their location or wealth.
Dr. Smith has already made strides on this journey with his Brisbane, Queensland-headquartered business, Maxwell MRI. “I saw there was a big gap in the market around automating the diagnosis of health conditions,” he says. “Existing processes were typically manual and involved a lot of people.”
Artificial intelligence (AI) and machine learning can remove a key obstacle to scaling out medicine and improve the efficiency and accuracy of diagnosing conditions, the healthcare entrepreneur believes.
“Our grand vision is to build an AI doctor that anyone can receive affordable support from and connect to in order to obtain results,” explains Dr. Smith.
Maxwell MRI presently enables clinicians to submit anonymised MRI scans to a machine learning enabled AI platform to help diagnose prostate cancer. The service is sold to clinicians who can then charge a per-session fee to clients. As well as obtaining results for individual cases, the MRI scans and associated information is used to ‘train’ the platform to deliver accurate diagnoses faster and in a more affordable way than existing systems do.
Dr. Smith and his team started by running a number of functions and processes on a single server with graphics processing units (GPUs) and sizable hard disk capacity. However, this infrastructure could not scale to support the planned growth of the business. Each case Maxwell MRI processes involves about 200MB of data in MRI scans alone. Once supplementary data, blood test result, pathology results and genetic information is included, this load can reach more than 1GB of data per patient.
The business aimed to process 150,000 cases by the end of 2018. This required a service that could deliver massive scale in data storage and compute, and could easily be accessed from any location. “We wanted to move from three GPUs to 30 GPUs without having to buy more servers or other associated equipment, so the cloud was the natural next step,” says Dr. Smith.
Maxwell MRI evaluated Google Cloud Platform (GCP) and determined that the managed services component of GCP would remove the burden of infrastructure deployment and administration. In addition, Google Cloud Machine Learning Engine would enable the business to scale to as many GPUs as needed to meet demand.
Maxwell MRI started with some small experiments to determine that GCP met all its requirements and completed its migration to the platform in February 2017. “We really started to scale up the data we had and consequently our computing requirements at that time,” Dr. Smith says.
The Maxwell MRI platform features an upload service that enables clinicians to upload imaging and associated data. This service triggers several different upload pipelines that clean and standardise data. They then write imaging data to Google Cloud Storage, and more structured data to a combination of Google Cloud Datastore and Google Cloud Spanner.
The platform then converts the information into records that can be used to ‘train’ new machine learning configurations or run evaluations through existing machine learning pipelines.
“The tasks we perform including segmenting various anatomical regions for analysis and sending those results back into Google Cloud Storage,” says Dr. Smith. “This then commences that repeated process of running Google Cloud Dataflow pipelines and machine learning algorithms, and presenting those outcomes back to the clinicians.”
Existing Literature Validated
The data processed and analysed to date has, Dr Smith says, enabled Maxwell MRI to help validate existing literature that indicates clinicians lack confidence in existing early-stage testing procedures for prostate cancer. This prompts them to move quickly to the biopsy stage to assure themselves their diagnosis is valid. “New technologies have a lot of potential to rectify this situation and guide treatment to be more accurate, specific and cost-effective,” he says.
Results Delivered in 10-15 Minutes
More specifically, using GCP has enabled Maxwell MRI to guarantee to clinicians that results will be delivered within minutes. “Clinicians are used to getting results back in two days to a week,” says Dr. Smith. “We’re saying that with our platform running on GCP we’ll deliver you results in 10 to 15 minutes, regardless of the number of patients coming in.”
Running on GCP has enabled the business to accelerate its development cycles, test new ideas easily on a subset of data, test in parallel and deliver new services considerably faster than in another environment. In addition, the flexible GCP charging model aligned with the ability to scale compute capabilities quickly and easily has enabled the fledgling business to control its costs.
Google technologies are poised to play an integral role in the business’s future. “With Google available, it doesn’t make sense for us to use our own infrastructure,” Dr. Smith says. “Our expertise in AI, machine learning and clinical engagement complements cloud platform specialties of infrastructure, managed services and ease of use. We see a bright future ahead in helping to transform healthcare globally.”
How Generative AI is Reshaping the Telecom Sector

1119
Of your peers have already read this article.
5:30 Minutes
The most insightful time you'll spend today!
Communication service providers (CSPs) are at an inflection point. From stagnating revenues, to network strain in meeting the demands of 5G, to challenges in delivering innovative customer experiences, there’s enormous pressure on the telecommunications industry to transform.
Over the past few years, CSPs around the globe have turned to artificial intelligence (AI) to address some of these challenges, but the lion’s share of an operator’s operational expenses are still spent on infrastructure and data management. This has limited their ability to capitalize on core data assets and develop differentiated customer experiences that meet individual needs.
Enter generative AI, a type of machine intelligence that’s received enormous attention as of late. We’ve all marveled over its ability to generate text that reads like it was written by a person, to create new images, and to build even musical scores. It’s a riveting addition to the AI toolset — and one that complements machine learning (ML) and its ability to identify patterns to make predictions, spot efficiencies, or interpret large data sets.
But while there’s a lot of hype around generative AI, at Google Cloud we view it through a much more practical lens for the telecommunications industry. Generative AI can accelerate the transformation already underway, with its potential to streamline many of the tools and processes that CSPs engage with daily, bringing a new level of natural interaction between people and computers, and enabling machines to be programmed to carry out an action with a spoken request, and respond in natural, interactive ways.
Generative AI builds on existing Google Cloud data, AI, and ML services. For example, Contact Center AI, with human-like interactions between callers and computers, has been successfully adopted by CSPs for many years, increasing the satisfaction of both customers and call center workers. As we add generative AI to this technology, CSPs and their customers will see even greater capabilities and impact, for example, virtual agents that not only provide helpful information, but also let customers make payments and execute other transactions. With generative AI, CSPs will be able to harness customer call summaries to better understand customer sentiment and identify cross-sell and up-sell opportunities. CSPs could also easily and quickly build and deploy virtual agents informed by customer conversations that enable more innovative and personalized customer interactions. And that’s just the start.
Three key areas
The contact center is just one of the areas where practical and generative AI will help drive new value. When reflecting on the key challenges facing CSPs today, three areas in particular stand out where generative AI may be transformative:
- Personalized experiences: In addition to further improvements in customer call center interactions, generative AI can deliver improved personalization in ecommerce interactions — a big factor in helping customers sort through their choices of phones and calling plans. Personalization is also important for lowering churn, offering relevant new services, and managing the customer lifecycle. For example, generative AI could enable CSPs to produce marketing campaign content customized for select themes, and target individual customers with customized text and images.
- Autonomous networks: Generative AI will also help to pave the way for autonomous networks by connecting multiple complex AI/ML models used across network planning and operations with large language models (LLMs) that can understand network behaviors and create action plans in areas including network capacity planning and performance. For example, generative AI will enable CSPs to train models with customer experience and sentiment data to build better prediction capabilities. Importantly, the customer data sets used to tune these models are not public, but curated internal customer data — significantly enhancing privacy, factuality, and relevance, while protecting intellectual property. In addition, generative AI will be able to help network planning and design, which requires high levels of reporting and analysis.
- Streamlined operations: Both operations center uptime and field service efficiency are crucial for managing costs and improving customer satisfaction. In particular, applying generative AI to field service devices can speed up diagnostics and analysis, and can even help with installation, parts, and troubleshooting, and minimizing the number of times companies have to send out trucks and improve field-service training. Generative AI will also provide a productivity boost to IT development processes, enabling code generation and troubleshooting to deliver reliable software products and services.
Data security and reliability
An under-discussed area in generative AI is the importance of data quality and data security in building and training the LLMs that power the technology. Many CSPs are rightly concerned about intellectual property leaking both into and out of LLMs, risking the security of their systems and their intellectual property. We’ve long offered industry-leading data security and privacy technologies, and with generative AI integrated with Vertex AI, we can ensure all data is secured within the CSP’s environment.
Meanwhile, to ensure that their LLMs generate accurate information, CSPs are building out scenarios and use cases for training on smaller, controlled amounts of their own data, sometimes accompanied by highly trusted sources from partners and others. Google Cloud also provides tools including Prompt Engineering, Tuning, and Reinforcement Learning from Human Feedback to further ensure data factuality and reliability. This will likely result in the first generative AI applications targeted to smaller, high-impact problems, like optimizing network topologies.
The human element
Of course, people are critical to the success of generative AI, whether that means solving problems in call centers, field service workers combining AI information with their own knowhow, marketing and creative teams brainstorming with generative AI to make new presentations and marketing materials, or operations engineers augmenting and approving an AI suggestion. We’ve built a lot of amazing technology to help augment what people cannot do: synthesize millions, if not billions, of records and sources to help energize new workflows and productivity.
Telecommunications is a fast-changing industry that is tech savvy and hungry to learn and deploy the best possible new technologies, and that includes generative AI. Each meeting with a CSP inspires new ideas, sparks more use cases, and leads to more industry-changing initiatives. It’s exciting to see this pace of change, and we are only just getting started.
We look forward to showing you more soon as we deep dive into some of the exciting CSP industry use cases in upcoming blog posts. We also invite you to find out more about how Google Cloud is partnering with CSPs around the world to deliver a holistic cloud transformation.
3111
Of your peers have already watched this video.
23:30 Minutes
The most insightful time you'll spend today!
Pytorch at Scale on Cloud TPUs
Cloud TPU Pods are machine learning supercomputers that enable enterprises to train large machine learning models at a scale otherwise difficult or sometimes impossible.
They deliver business value through solving many machine learning problems including image search, neural architecture search and large-scale language models both for Google and Google Cloud customers.
However, until a few months ago TPU devices and pods were limited to Tensorflow models. Much awaited support for Pytorch was announced in Pytorch conference 2019.
In this session, Vaibhav Singh, ML Specialist, Cloud Customer Engineer, Google Cloud and Taylan Bilal, Software Engineer, Google Cloud demystify the art and science of training your Pytorch models on TPUs. They take you through a step-by-step walkthrough using an example, then explain how it works, and finally how to scale up Pytorch training with Cloud TPU Pods.
More Relevant Stories for Your Company

How AI Can Predict Consumer Demand and Retain Customers
How can AI help you target customers who are looking for products like yours? The challenge: This customer wants to buy the best cat food for her pets. Reach the Right Customers How can AI help you target customers who are looking for products like yours?The challenge: This customer wants
Delivering 10X Improvement to Risk and Regulatory Reporting Through Cloud and AI
Enterprise agility and the ability to innovate, adapt and respond quickly to the ever-changing risk and regulatory landscape is no longer a choice, but the cornerstone of successful digital transformation and commercial growth. Traditional access to and ways of managing data invariably create challenges in dealing with multiple data repositories,

Rubin Observatory Leverages Google Cloud to Power Astronomical Research
This week, the Vera C. Rubin Observatory is launching the first preview of its new Rubin Science Platform (RSP) for an initial cohort of astronomers. The observatory, which is located in Chile but managed by the U.S. National Science Foundation’s NOIRLab in Tucson, AZ and SLAC in California, is jointly funded by the NSF and the U.S. Department

How Google Cloud Helps SAP Admins Create Scalable, Secure Networks
SAP forms the critical backbone of thousands of enterprises, supporting critical business functions such as finance, supply chain, warehouse management, and more. Google Cloud provides a highly scalable and resilient infrastructure to run such workloads and offers tools, such as Smart Analytics and Machine Learning that can accelerate your organization’s digital transformation. In fact, a
