





Make Meaningful Analysis with Geo Boundary Public Datasets on BigQuery

6334
Of your peers have already read this article.
4:00 Minutes
The most insightful time you'll spend today!
Geospatial data is a critical component for a comprehensive analytics strategy. Whether you are trying to visualize data using geospatial parameters or do deeper analysis or modeling on customer distribution or proximity, most organizations have some type of geospatial data they would like to use – whether it be customer zipcodes, store locations, or shipping addresses. However, converting geographic data into the correct format for analysis and aggregation at different levels can be difficult. In this post, we’ll walk through some examples of how you can leverage the Google Cloud platform alongside Google Cloud Public Datasets to perform robust analytics on geographic data. The full queries can be accessed from this notebook here.
Public US Geo Boundaries dataset
BigQuery hosts a slew of public datasets for you to access and integrate into your analytics. Google pays for the storage of these datasets and provides public access to the data via the bigquery-public-data project. You only pay for queries against the data. Plus, the first 1 TB per month is free! These public datasets are valuable on their own, but when joined against your own data they can unlock new analytics use cases and save the team a lot of time.
Within the Google Cloud Public Datasets Program there are several geographic datasets. Here, we’ll work with the geo_us_boundaries dataset, which contains a set of tables that have the boundaries of different geospatial areas as polygons and coordinates based on the center point (GEOGRAPHY column type in BigQuery), published by the US Census Bureau.

Mapping geospatial points to hierarchical areas
Many times you will find yourself in situations where you have a string representing an address. However, most tools require lat/long coordinates to actually plot points. Using the Google Maps Geocoding API we can convert an address into a lat/long and then store the results in the BigQuery table.
With a lat/long representation of our point, we can join our initial dataset back onto any of the tables here using the ST_WITHIN function. This allows us to check and see if a point is within the specified polygon.
ST_WITHIN(geography_1, geography_2)
This can be helpful for ensuring standard nomenclature; for example, metropolitan areas that might be named differently. The query below maps each customers’ address to a given metropolitan area name.
SELECTcust.id as customer_id,metro.name as metro_nameFROM `looker-private-demo.retail.customers` as cust,`bigquery-public-data.geo_us_boundaries.metropolitan_divisions` as metroWHERE ST_WITHIN(ST_GEOGPOINT(cust.longitude, cust.latitude),metro.metdiv_geom)
It can also be useful for converting to designated market area (DMA), which is often used in creating targeted digital marketing campaigns.
SELECTcust.id as customer_id,dma.dma_nameFROM `looker-private-demo.retail.customers` as cust,`bigquery-public-data.geo_us_boundaries.designated_market_area` as dmaWHERE ST_WITHIN(ST_GEOGPOINT(cust.longitude, cust.latitude),dma.dma_geom)
Or for filling in missing information; for example, some addresses may be missing zip code which results in incorrect calculations when aggregating up to the zipcode level. By joining onto the zip_codes table we can ensure all coordinates are mapped appropriately and aggregate up from there.
SELECTzip.zip_code,count(distinct cust.id) as unique_customersFROM `looker-private-demo.retail.customers` as cust,`bigquery-public-data.geo_us_boundaries.zip_codes` as zipWHERE ST_WITHIN(ST_GEOGPOINT(cust.longitude, cust.latitude),zip.zip_code_geom)GROUP BY 1
Note that the zip code table isn’t a comprehensive list of all US zip codes, they are zip code tabulation areas (ZCTAs). Details about the differences can be found here. Additionally, the zip code table gives us hierarchical information, which allows us to perform more meaningful analytics. One example is leveraging hierarchical drilling in Looker. I can aggregate my total sales up to the country level, and then drill down to state, city and zipcode to identify where sales are highest. You can also use the BigQuery GeoViz tool to visualize geospatial data!

Aside from simply checking if a point is within an area, we can also use ST_DISTANCE to do something like find the closest city using the centerpoint for the metropolitan area table.
SELECTcust.id as customer_id,ARRAY_AGG(metro.name order by ST_DISTANCE(ST_GEOGPOINT(cust.longitude, cust.latitude),metro.internal_point_geom) asc limit 1)[offset(0)] as metro_nameFROM`looker-private-demo.retail.customers` as cust,`bigquery-public-data.geo_us_boundaries.metropolitan_divisions` as metroGROUP BY cust.id
This concept doesn’t just hold true for points, we can also leverage other GIS functions to see if a geospatial area is contained within areas that are listed in the boundaries datasets. If your data comes into BigQuery as a GeoJSON string, we can convert it to a GEOGRAPHY type using the ST_GEOGFROMGEOJSON function. Once our data is in a GEOGRAPHY type we can do things like check to see what urban area the geo is within – using either ST_WITHIN or ST_INTERSECTS to account for partial coverage. Here, I am using the customer’s zip code to find all metropolitan divisions where the zip code polygon and the metropolitan polygon intersect. I am then selecting the metropolitan area that has the most overlap (or the intersection has the largest area) to be the customer’s metro that we use for reporting.
SELECTcust.id as customer_id,ARRAY_AGG(metro.name order by ST_AREA(ST_INTERSECTION(zip.zip_code_geom,metro.metdiv_geom)) desc limit 1)[offset(0)] as metro_nameFROM`looker-private-demo.retail.customers` as custJOIN `bigquery-public-data.geo_us_boundaries.zip_codes` as zip on cust.zip=zip.zip_code,`bigquery-public-data.geo_us_boundaries.metropolitan_divisions` as metroWHERE ST_INTERSECTS(zip.zip_code_geom,metro.metdiv_geom)GROUP BY cust.id
The same ideas can be applied to the other tables in the dataset including the county, urban areas and National Weather Service forecast regions (which can also be useful if you want to join your datasets onto weather data).
Correcting for data discrepancy
One problem that we may run into when working with geospatial data is that different data sources may have different representations of the same information. For example, you might have one system that records state as a two letter abbreviation and another using the full name. Here, we can use the state table to join the different datasets.
SELECTst.state_name,sum(ab.sales+fn.sales) as total_salesFROM `bigquery-public-data.geo_us_boundaries.states` as stLEFT JOIN abbreviated_table as ab on ab.state = st.stateLEFT JOIN fullname_table as fn on fn.state = st.state_nameWHERE COALESCE(ab.state, fn.state) IS NOT NULLGROUP BY 1
Another example might be using the tables as a source of truth for fuzzy matching. If the address is a manually entered field somewhere in your application, there is a good chance that things will be misspelled. Different representations of the same name may prevent tables from joining with each other or lead to duplicate entries when performing aggregations. Here, I use a simple Soundex algorithm to generate a code for each county name, using helper functions from this blog post. We can see that even though some are misspelled they have the same Soundex code.

Next, we can join back onto our counties table so we make sure to use the correct spelling of the county name. Then, we can simply aggregate our data for more accurate reporting.
SELECTc.county_name,sum(sales) as total_salesFROMtableJOIN `bigquery-public-data.geo_us_boundaries.counties` as con testing.dq_fm_Soundex(table.county) = testing.dq_fm_Soundex(c.county_name)WHERE c.state_fips_code = cast(36 as string)GROUP BY 1
Note that fuzzy matching definitely isn’t perfect and you might need to try different methods or apply certain filters for it to work best depending on the specifics of your data.
The US Geo Boundary datasets allow you to perform meaningful geographic analysis without needing to worry about extracting, transforming or loading additional datasets into BigQuery. These datasets, along with all the other Google Cloud Public Datasets, will be available in the Analytics Hub. Please sign up for the Analytics Hub preview, which is scheduled to be available in the third quarter of 2021, by going to g.co/cloud/analytics-hub.
3747
Of your peers have already watched this video.
5:00 Minutes
The most insightful time you'll spend today!
What’s BigQuery and Why Should IT Managers Care?
Today it’s impossible for anyone working in IT teams to have a day go by without a discussion about data, analytics, and big data.
Often these conversations veer towards BigQuery. Many IT managers are unsure what BigQuery is and what it does. If you are one of them, you aren’t alone.
Google BigQuery is a fast, highly-scalable, cost-effective, and fully managed cloud data warehouse for analytics, with built-in machine learning.
To better understand what the benefits of BigQuery are, it’s important to grasp some of the challenges that
These are some of the challenges that Google BigQuery fixes. To get a quick snapshot of what Google BigQuery does, watch this short video.
6190
Of your peers have already watched this video.
13:00 Minutes
The most insightful time you'll spend today!
Google Cloud’s 2021 Data Analytics Launches
Google Cloud announced closed to 15 services and programs spanning database, analytics, business intelligence and AI to help businesses gain value out of their data. Here’s a rundown of announcements throughout 2021 on analytics solutions and services such as Dataplex, an intelligent data fabric solution, Datastream, a serverless change data capture and replication service and Google Cloud analytics hub. Watch the video to get started with Google Cloud’s Data Analytics offerings.
Post-COVID: Times Driven by Data Analytics and Intelligence

4559
Of your peers have already read this article.
1:30 Minutes
The most insightful time you'll spend today!
As we think about economic recovery from COVID-19—both inside Google and outside through working with Google Cloud customers—we’ve made many important observations. Among them is the recognition that the ways software developers and IT practitioners work together will shift in the post COVID-19 world. Our economic recovery today will look different than past recoveries, and on a fundamental level, the way we innovate will be different than it’s ever been before.
Right now, we’re entering a new phase of cloud computing, where businesses have shifted from making tactical infrastructure decisions, to making larger IT decisions with an eye towards enabling transformation throughout the company. Data, and what we can do with that data, is key to this transformation. And how companies put data in the hands of every employee to help catalyze transformation and solve the most important and impactful opportunities in their industries is at the core.
A recent Google-commissioned study by IDG highlighted the role of data analytics and intelligent solutions when it comes to helping businesses separate from their competition. The survey of 2,000 IT leaders across the globe reinforced the notion that the ability to derive insights from data will go a long way towards determining which companies win in this new era.
Data analytics and intelligence were prioritized during COVID-19
The results of the IDG study show a separation amongst those organizations that embrace the capabilities of today’s data analytics and AI/ML tools and those that do not. When COVID-19 hit, many organizations cancelled IT initiatives, with 55% of respondents delaying or cancelling at least one technology project. However, 32% of respondents accelerated or introduced initiatives around building out or improving the use of data analytics and intelligence. IT leaders realize how critical data is to their future success, even when resources are scarce.
Digital-focused companies are faster to embrace advanced intelligence tools
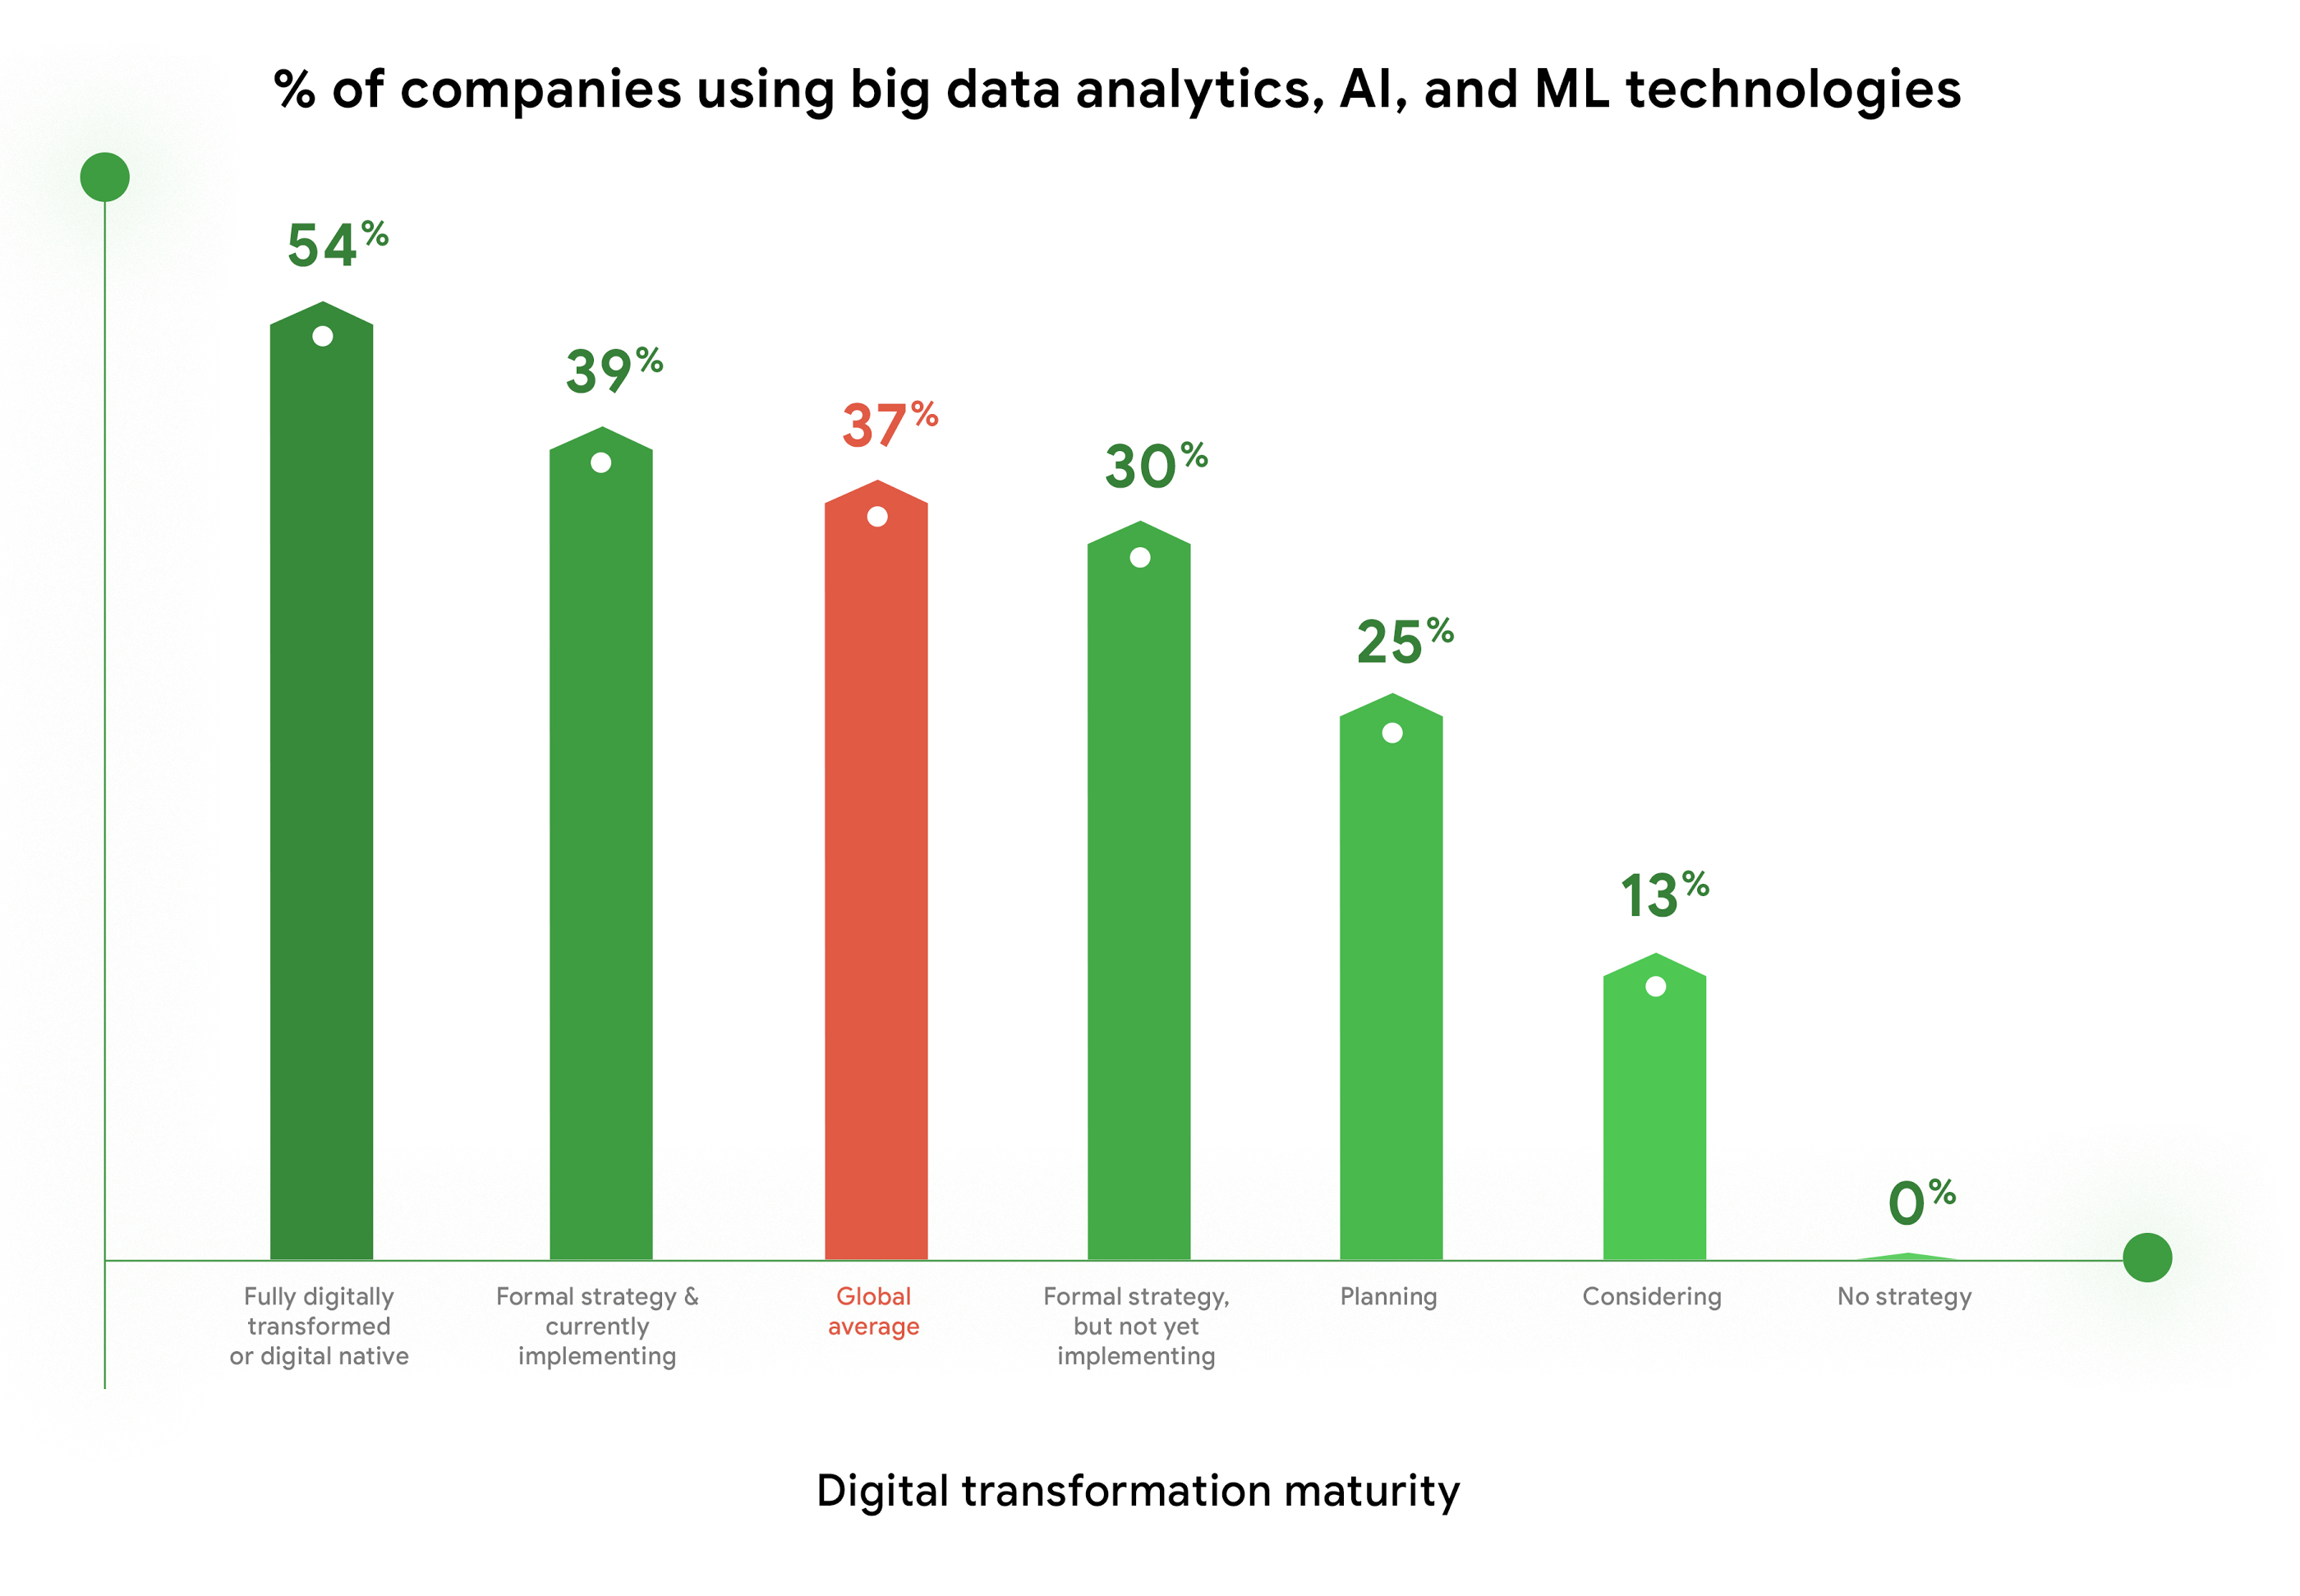
Furthermore, enthusiasm for big data analytics, AI, and ML technologies is highest among companies who are further along in their digital transformation journeys. Fifty-four percent of companies who identify as “Fully digitally transformed” or “Digital native” are using or considering using these tools, vs. the global average of 37%. And, these same organizations are embracing the promise of AI more than their peers. Forty-eight percent felt that “Embedded AI across our full stack of cloud solutions will be critical” vs 39% of digital conservatives. These companies realize these digital tools enable them to be more resilient, agile, and prepared for whatever the future brings.
Companies are turning to cloud to maximize insights from data
As companies tap into the promise of data analytics and AI/ML, they are turning to cloud for help. When considering which cloud providers to work with, 78% of respondents said big data analysis is a “must have” or a “major consideration,” which placed this capability at the top of the list of consideration factors. This is not surprising, as cloud solutions address the most common pain points and barriers to innovation. Three of the respondents’ top four areas impeding innovation are addressed by cloud: Insufficient IT & developer skill sets (1st), security risks and concerns (2nd), and legacy systems and technologies (4th). Plus, cloud makes it easier to quickly launch a project, scale up or scale down, and pay for only what you use.

COVID-19 changed the very nature of business, and of IT. It forced IT leaders to decide where to put their scarce resources and big data analytics and AI/ML were, understandably, at the top of the list. To learn more about the findings, download the IDG report “No turning back: How the pandemic reshaped digital business agendas.”
Looking for a Cloud Data Warehouse? Find out Why Forrester Thinks Google BigQuery is a Leader

4481
Of your peers have already read this article.
4:30 Minutes
The most insightful time you'll spend today!
We are thrilled to announce that Google has been named a Leader in The Forrester Wave™: Cloud Data Warehouse, Q1 2021 report. For more than a decade, BigQuery, our petabyte-scale cloud data warehouse, has been in a class of its own. We’re excited to share this recognition and we want to thank our strong community of customers and partners for voicing their opinion. We believe this report validates the alignment of our strategy with our customers’ analytics needs.
“Customers like Google’s frequency of data warehouse releases, business value, future proof architecture, high-end scale, geospatial capabilities, strong AI/ML capabilities, good security capabilities, and broad analytical use cases,” according to the Forrester report. Today’s data leaders require a data warehousing platform that provides both depth and breadth and with BigQuery, organizations are able to unlock deeper data science and machine learning capabilities while promoting data democratization and providing the highest levels of availability.
Google BigQuery: 5 out of 5!
Forrester gave Google BigQuery a score of 5 out of 5 across 19 different criteria, including:
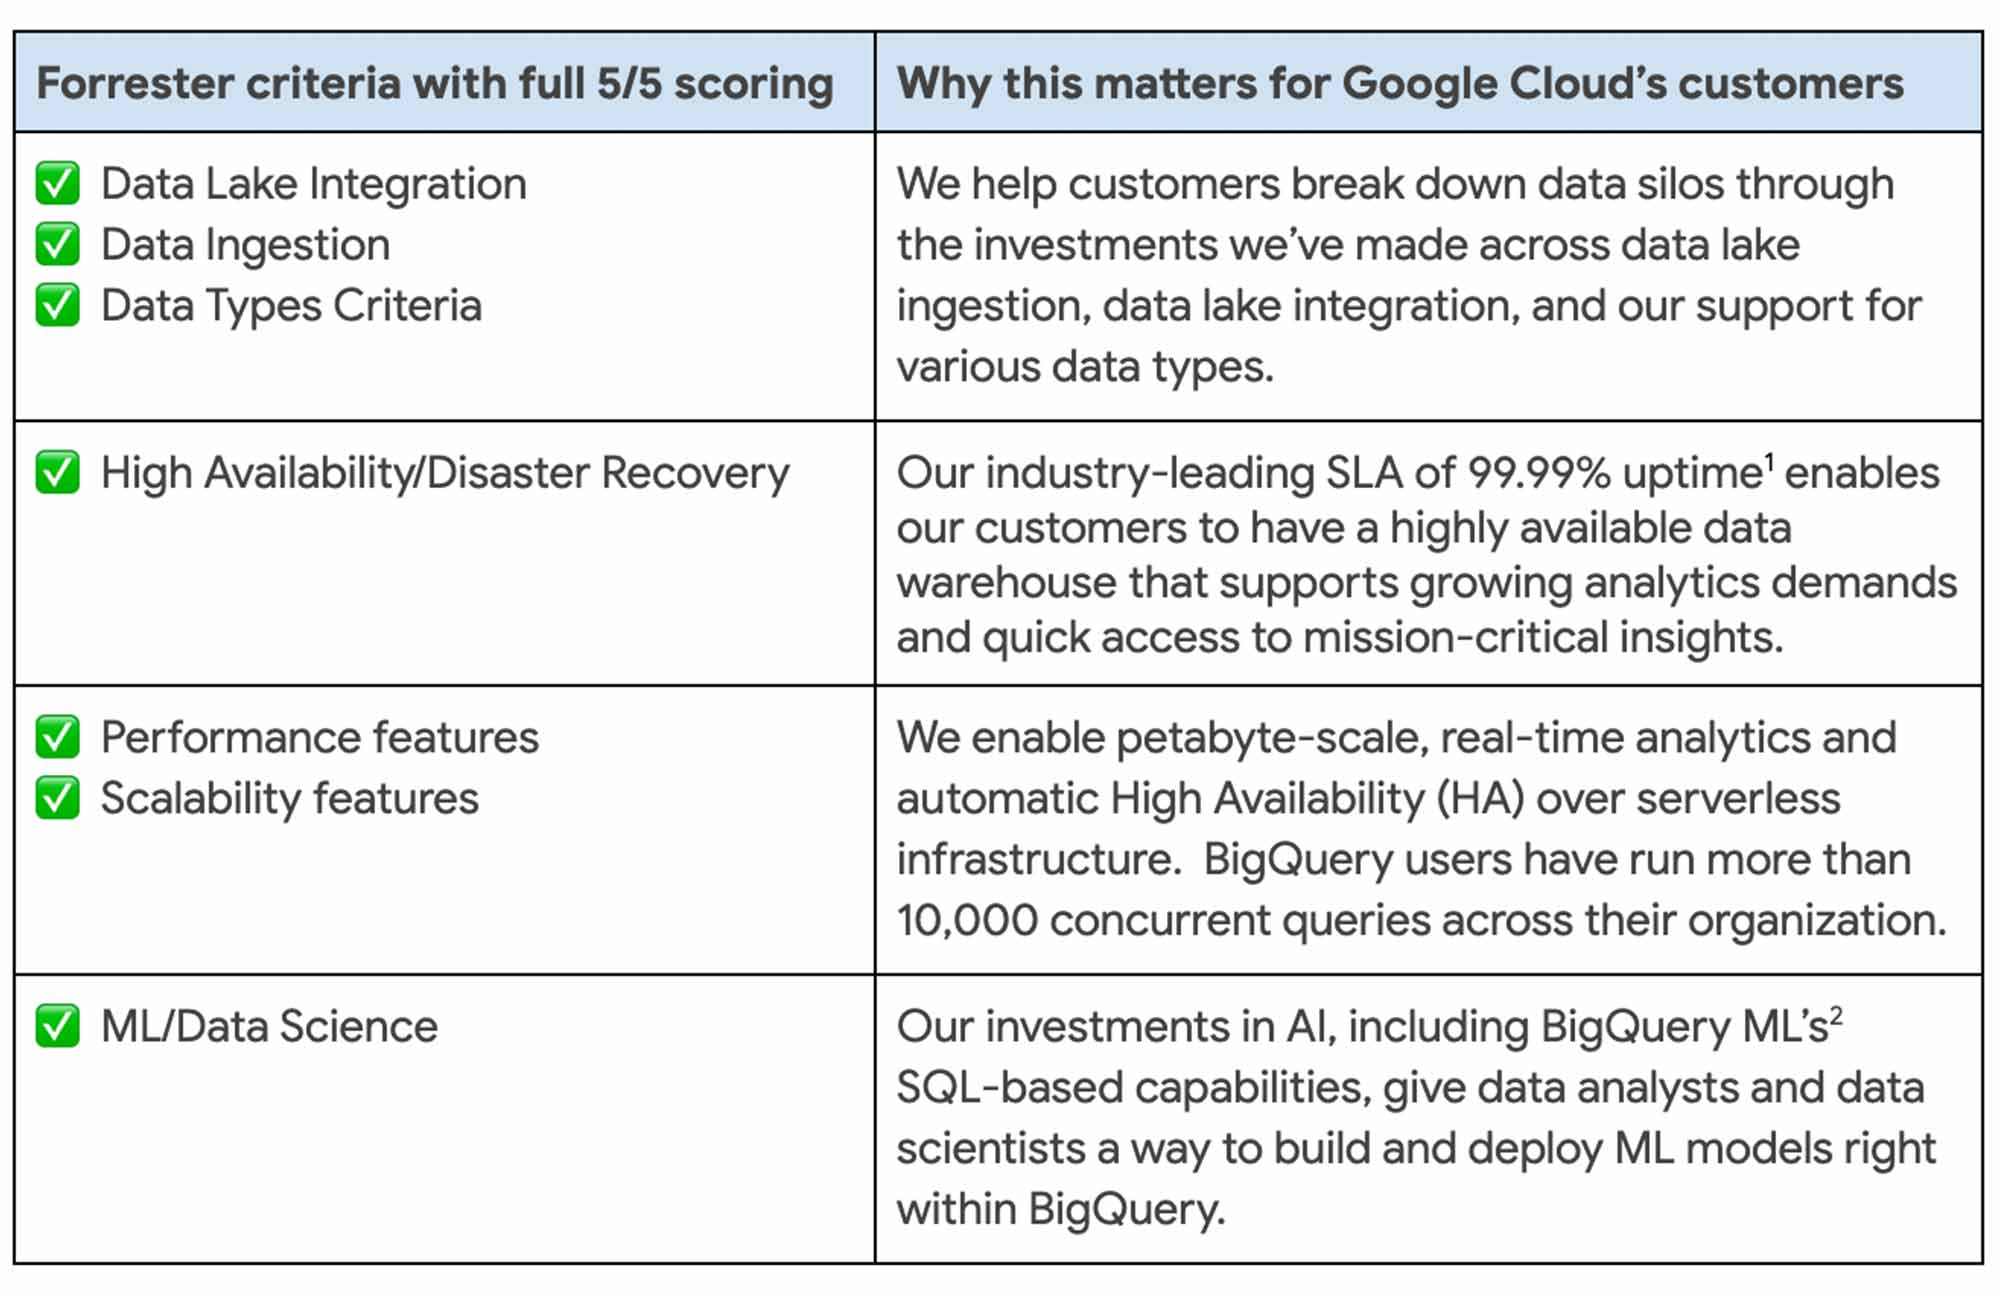
Today, customers across the globe use BigQuery to run business critical analytics workloads to enable BI acceleration, IoT analytics, customer intelligence, AI/ML-based analytics, data science, data collaboration, and data services. Customers such as Verizon, Wayfair, HSBC, Twitter, AirAsia, KeyBank, The Home Depot, and Vodafone have anchored their digital transformation efforts on BigQuery—unlocking deeper insights for their people.
Customers use BigQuery across all industries, to solve issues like credit card fraud detection, predictive forecasting, anomaly detection, log analytics and many more. Forrester recognized this work and gave BigQuery a 5/5 score for supporting vertical and horizontal use cases.
More BigQuery advantages
Google is the first hyperscale provider to offer a multi cloud data analytics solution. With BigQuery Omni, customers can perform cross-cloud analytics with ease, and drive business outcomes they couldn’t achieve with the siloed approach offered by other vendors.
We designed BigQuery to be highly scalable and more open and interoperable so that customers can join data across SQL databases, traditional unstructured data lakes in object storage, and even spreadsheets using any analysis tool.
Recent innovations like BigQuery BI Engine lets us provide the best analytics experience by delivering sub-second query response times from any business intelligence tool, from Google’s Looker and Connected Sheets to Tableau, Microsoft Power BI, ThoughtSpot, and others. Our goal is to meet customers where they are rather than force them into a one-size-fits-all approach to data analysis.
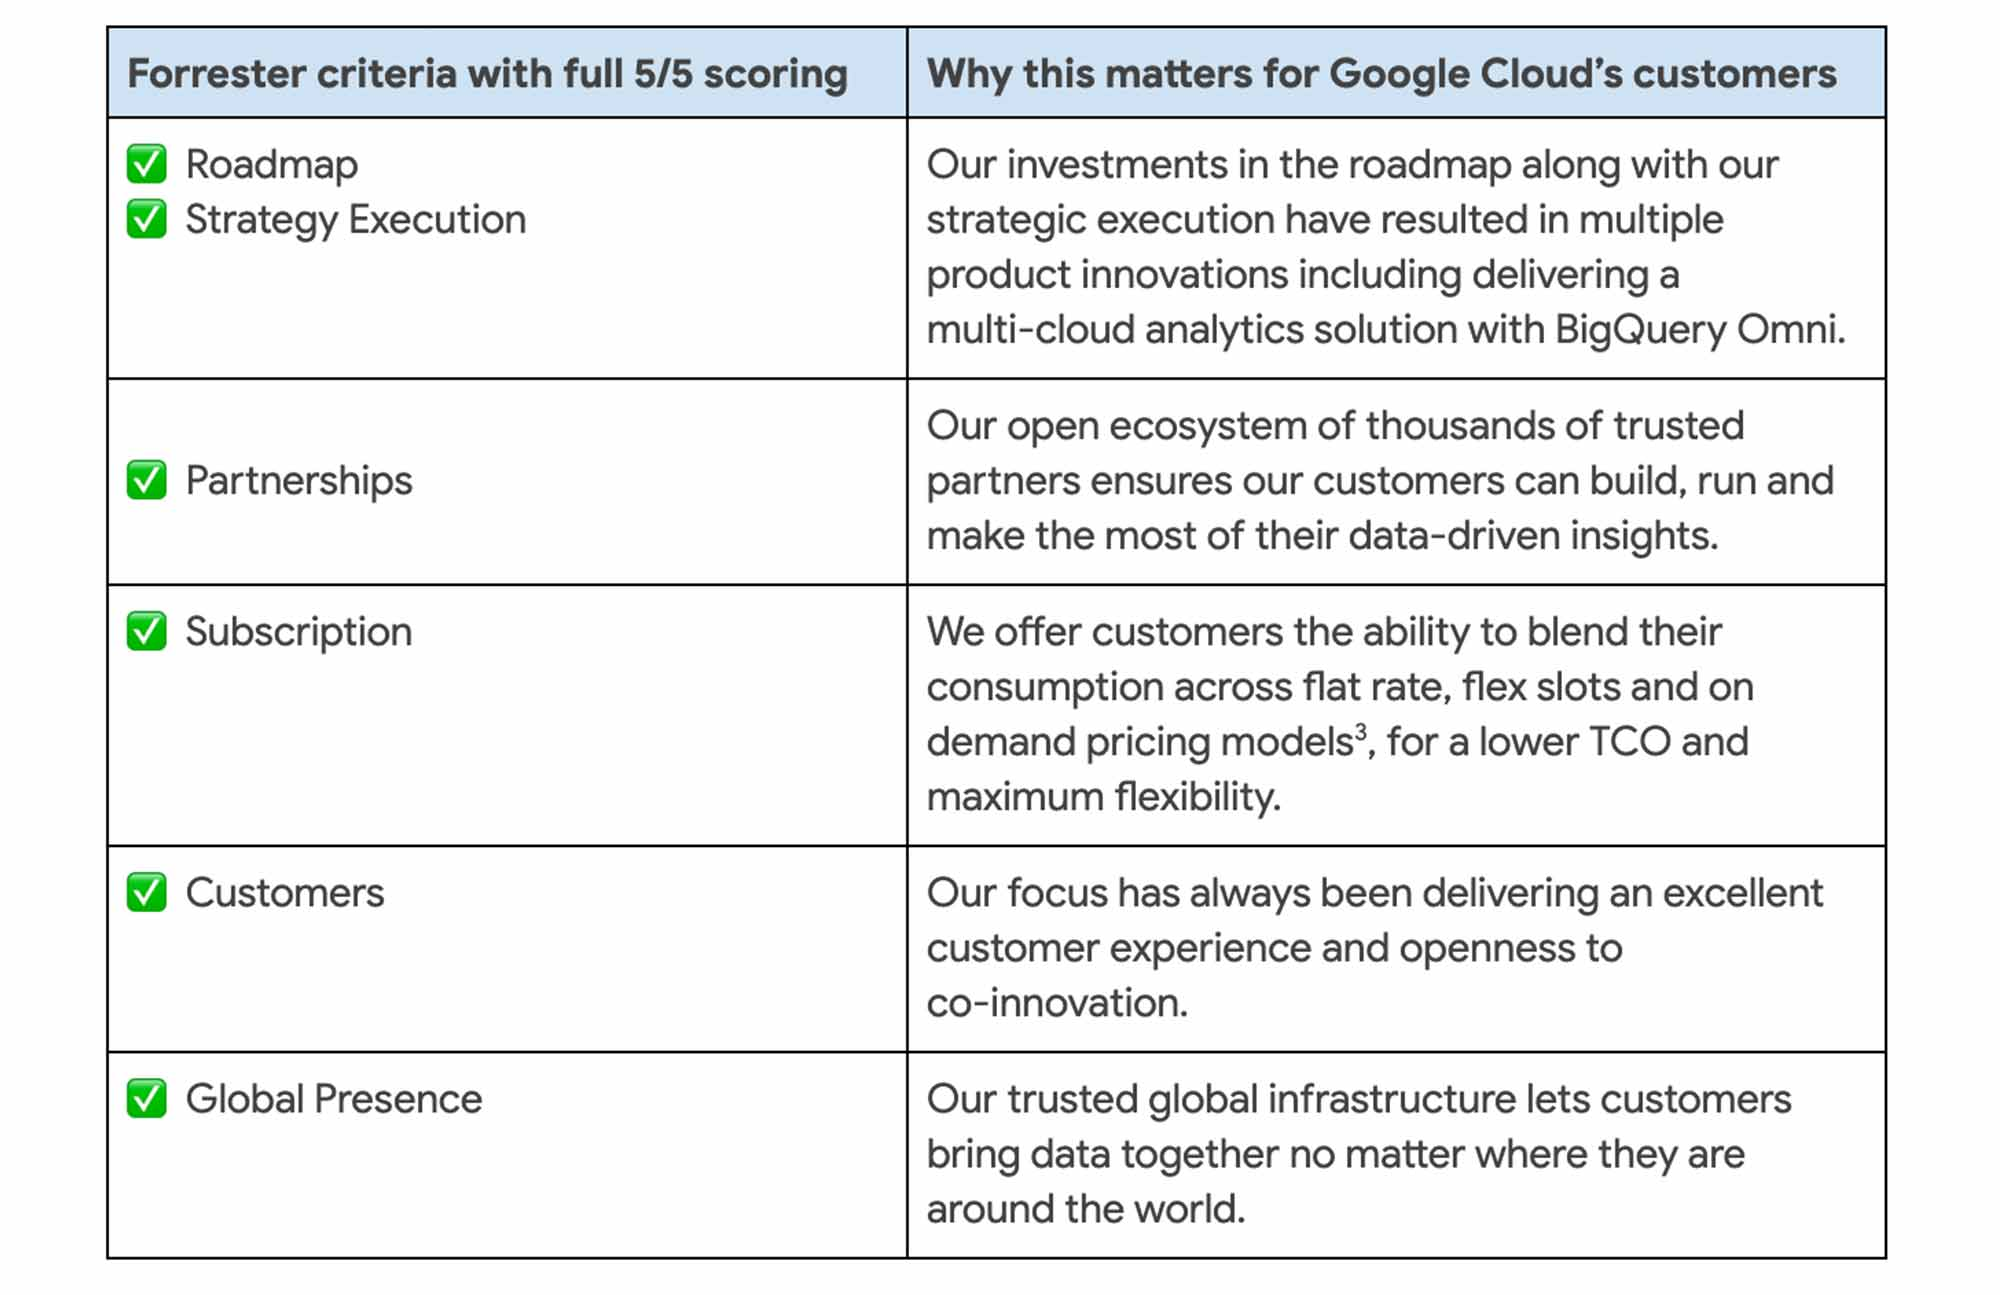
With BigQuery, organizations gain both breadth and depth of capabilities to transform their analytics strategy. Forrester also gave BigQuery 5 out of 5 in:
Data-powered innovation
These advantages enable our customers to accelerate their digital transformation and reimagine their business through data-powered innovation. Google’s leadership across AI, analytics, and databases comes together in a single data cloud platform that provides everyone with the ability to get value out of their data faster.
We bring decades of research and innovation in AI to our customers through industry-leading AI solutions, that in turn helps our customers solve their biggest problems. Our support of open standards and APIs enables interoperability between a variety of services for ingestion, storage, processing and analytics across the data cloud platform. And finally, we believe our multi-layered security approach throughout the data stack ensures redundancy and reliability so that customers can have the peace of mind that their data is always protected.
We are honored to be a leader in this Forrester Wave™ and look forward to continuing to innovate and partner with you on your digital transformation journey.
Download the full Forrester Wave™ :Cloud Data Warehouse, Q1 2021 report. And check out these smart analytics reference patterns. To learn more about BigQuery, visit our website, and get started immediately with the free BigQuery Sandbox.
4414
Of your peers have already watched this video.
28:30 Minutes
The most insightful time you'll spend today!
Data Leaders in 2021 and Beyond: How to Prepare
As technologies and workplace environments are quickly evolving, how people and businesses leverage data in their day-to-day workflow is also changing.
Data leaders are an emerging force navigating and charting pathways forward towards new horizons for how people and organizations experience data.
In this presentation, Pedro Arellano, Product Marketing Director, Looker, will cover three areas:
- Underline that the value of data within an organization is no longer up for debate. Everybody needs data, and everybody’s job has the potential to be improved with data.
- Three trends that will help put into context how we’ve arrived at this particular moment of such great potential for data.
- Why data leaders, almost regardless of their title, are now in a position to really influence the direction of organization like never before.
Learn what’s guiding the thinking of data leaders in 2021 and beyond.
More Relevant Stories for Your Company

How Machine Learning Can Cut Support Ticket Resolution Time By Over 80%
Sure, machine learning is becoming a business imperative, but how does it work in practice—and what are the benefits for IT managers? That’s the subject of a new step-by-step guide to solving business and IT problems with artificial intelligence and ML, based on insights gathered by IDG Research Services. Its

Google Cloud Helps LiveRamp Capture, Manage, Process and Visualize Data at Scale
Editor’s note: Today we’re hearing from Sagar Batchu, Director of Engineering at LiveRamp. He shares how Google Cloud helped LiveRamp modernize its data analytics infrastructure to simplify its operations, lower support and infrastructure costs and enable its customers to connect, control, and activate customer data safely and securely. LiveRamp is a data

Bit Capital Rolls Out a Digital Financial Solution in Under 3 Months and at 2/3 the Cost
In the past few years, a series of new technologies and regulatory changes has been transforming Brazil’s financial industry. The concept of blockchain added security and agility to financial transactions. The open banking system being deployed by the country’s Central Bank (BC) allows for platform integration and data sharing -with

Zeotap Uses Big Data to Enable Personalized, Precision Marketing at Scale
Customers today expect brands to know what they want. In fact, Forbes cited that 71% of customers feel frustrated when the shopping experience is impersonal. From interests to purchase habits, companies need to target customers effectively in order to stand out from the plethora of competitors in the online marketplace. "Our mission
