





Enhance Dev Workflows with Duet AI’s AI-Powered Support

1187
Of your peers have already read this article.
3:00 Minutes
The most insightful time you'll spend today!
Last week we announced the private preview of Duet AI for Google Cloud, an always-on AI collaborator that uses generative AI to provide help to developers and cloud users. This article gives you a detailed look at Duet AI for developers, showing how Duet AI can help provide developers with real-time code suggestions, chat assistance, and enterprise-focused customization. You can sign-up here to join our waitlist for Google Cloud’s AI trusted tester program.
We believe that addressing these use cases with large language models (LLMs) will usher in a major leap in productivity in enterprise development. Duet AI uses Codey, a family of code models built on PaLM 2.
Developers continuously seek ways to improve their productivity and, over the past few decades, these efforts have resulted in massive productivity leaps due to technological changes. From advanced debuggers and online developer communities, to modern IDEs/notebooks and cloud computing, each advance brought massive changes in productivity. Despite these improvements, developers still face numerous challenges, some of which are unique to cloud development:
- Disruptive context switching and friction when integrating a new tool or service
- Excessive time spent on repetitive tasks
- Time required to understand a new code base or project
- Large cognitive workload when working on large code bases or complex APIs
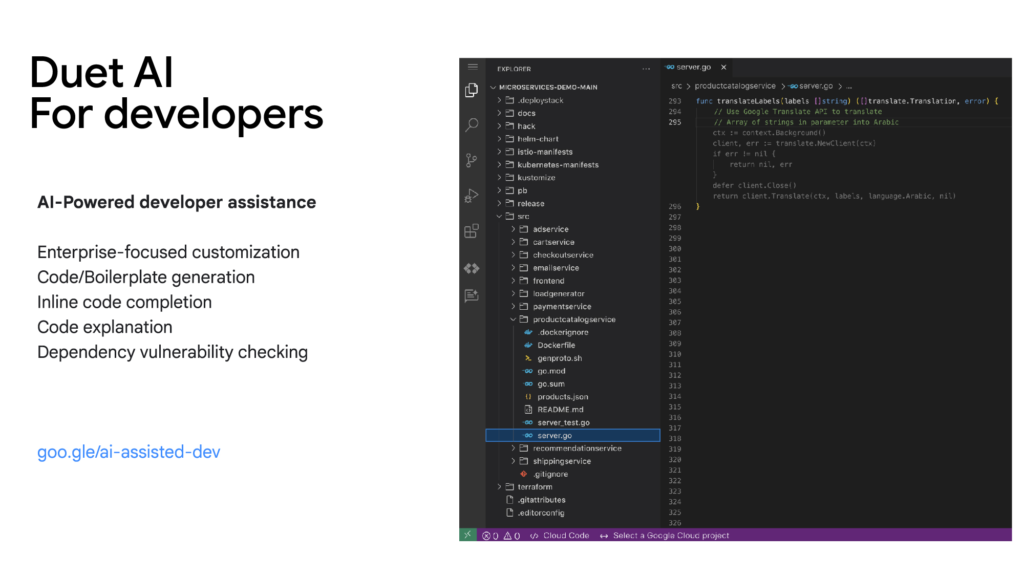
Duet AI for developers focuses on challenges and tasks across the development lifecycle:
Code/Boilerplate Generation — Developers can describe the tasks they have in mind as a comment or function name, such as creating a Cloud Pub/Sub topic. Duet AI will generate a reference implementation that can be reviewed and modified, so developers don’t need to spend time reading through multiple documentation pages.
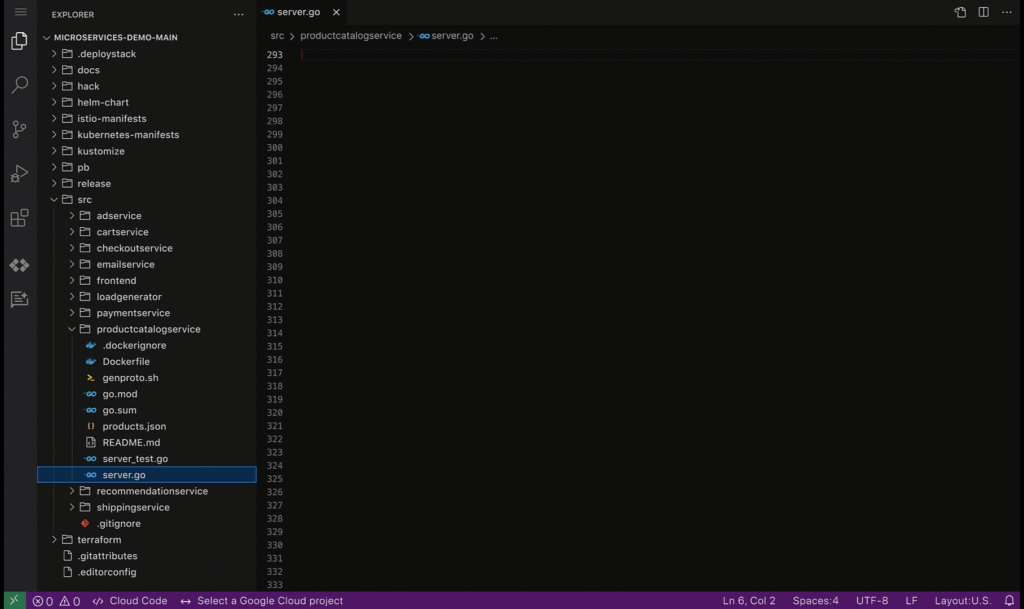
Inline Code Completion — To reduce the time spent on repetitive tasks and minimize the cognitive workload of tasks such as writing repetitive code or retrieving variable names, Duet AI provides intelligent, context-aware code completion, helping reduce the time spent on coding and enhancing the quality of the written code.
Enterprise Customization — Organizations frequently have massive code bases and specific recommended frameworks and best practices, which generic code assistance solutions may not be best positioned to support. With Vertex AI, developers will be able to tune and customize the underlying models and connect them to the Duet AI experience, allowing for assistance optimized to the needs of the organization.
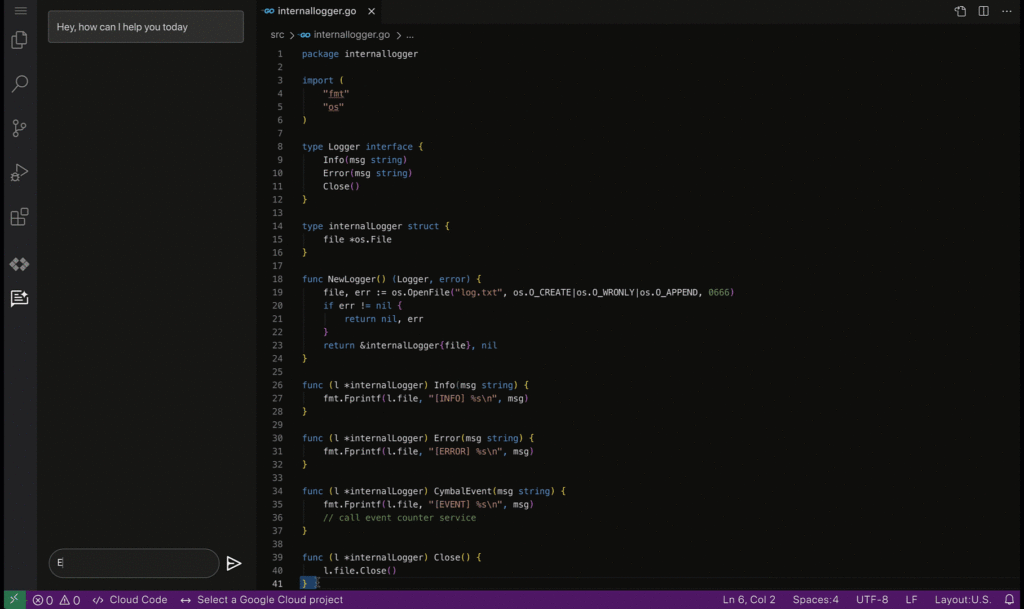
Code Explanation — Developers spend significant time and effort reading and understanding code written by their peers or external contributors. To help assist in this process, Duet AI for code assistance provides an “Explain this code” option available whenever a developer selects their code, allowing them to more quickly understand, map, and navigate unfamiliar code bases.
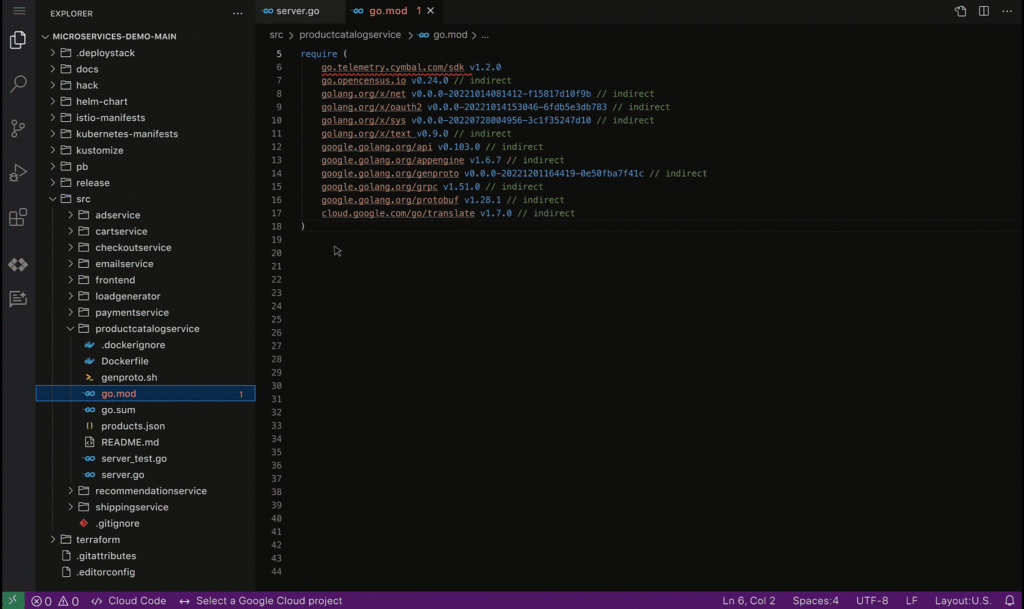
Code security guardrails — Code generated by Duet AI can also be scanned for vulnerable dependencies via Source Protect, helping surface known public vulnerabilities impacting code, along with suggested fixes when available, bringing additional security.
By harnessing the power of AI-driven developer assistance such as the one provided by Duet AI for developers, businesses can unlock unprecedented levels of productivity and efficiency in software development, paving the way for a new era of innovation and growth.
These early features of Duet AI for Google Cloud will be available for limited users and we will be expanding access very soon. Sign up here to join Google Cloud’s AI Trusted Tester Program.
11999
Of your peers have already watched this video.
3:26 Minutes
The most insightful time you'll spend today!
How L&T Financial Services Processes 95% of Motorcycle Loans in Less Than Two Minutes
L&T Financial Services is one of the largest lenders in India. India’s demonetization policy in recent years has led to a shift from cash transactions to digital payments. In 2016, the government withdrew 500 and 1000 rupee notes from circulation and encouraged a heavily cash-based population to deposit their canceled notes in banks. Financial institutions needed to pivot to a new way of doing business to stay competitive. L&T Financial Services modernized its IT infrastructure to keep up with changes and capture digital opportunities.
“Working capital is crucial to stimulate growth in rural communities. Our role as a lender is to provide access to funds. We don’t want to burden borrowers with the complexities of getting a loan. Towards this end, digitization is an important step,” says Dinanath Dubhashi, Managing Director and CEO at L&T Financial Services. “Google Cloud helps us streamline service delivery and identify the right customers. By offering the fastest processing time in the industry, we want to be the go-to lender for all customers.”
L&T Financial Services considered multiple cloud providers before choosing Google Cloud. According to Dinanath, Google Cloud understands both the need for businesses to move fast and the need for IT to modernize at different speeds. “We weren’t forced to abandon existing IT systems and migrate lock, stock, and barrel to Google Cloud on day one.”
L&T Financial Services engaged Google Cloud Professional Services to guide its digital transformation journey. The smooth migration from proof of concept to full-scale deployment on Google Cloud took a matter of months.
“Collaboration: a small idea with big opportunities. G Suite helps us connect remote branches with the head office, easily access shared files to submit and track approvals, and conduct face-to-face discussions to accelerate approval processes.”
—Dinanath Dubhashi, MD and CEO, L&T Financial Services
Digitizing the workforce with G Suite
The move to the cloud at L&T Financial Services started in 2017 when the company introduced G Suite to its 14,500 employees. The legacy email system was cumbersome to use, especially for frontline staff who need email access while they are on the road. Using Gmail, employees can connect with customers and co-workers from anywhere, on any device. Employees save time by scheduling meetings with Calendar, collaborating on Docs, and conducting video calls using Hangouts Meet.
Converting data into credit insights using BigQuery
Taking data intelligence one step further, L&T Financial Services adopts a responsible lending approach by applying algorithm-based data analytics to improve credit standards. Beyond traditional data such as credit score and credit payment history, the company also considers macro-economic indicators for risk audits. For example, a farmer’s ability to pay off the loan of his new tractor depends on a successful planting and harvest. So L&T Financial Services feeds long-term data into BigQuery and runs queries to predict loan defaults based on rainfall and crop yield.
6167
Of your peers have already watched this video.
18:00 Minutes
The most insightful time you'll spend today!
An Overview of Google’s Data Cloud
Data access, management and privacy has been at the center of priorities for enterprises that are aiming to be more agile, reliable and data-driven. Google Cloud’s technology innovations spanning products like BigQuery, Spanner, Looker and VertexAI help organizations navigate the complexities related to siloed data in large volumes sprawled across databases, data lakes, data warehouses, and data marts in multiple clouds and on-premises. Watch the video to learn how companies are building data on Google Cloud for better analysis, security and management to achieve bottomline!
3551
Of your peers have already watched this video.
2:30 Minutes
The most insightful time you'll spend today!
Google’s AutoML Vision Helps AES Fight Climate Change
Global warming is one of the big challenges of our times; if not the biggest challenge of our times, says Andres Gluski, President and CEO, AES, a Fortune 500 company that generates and distributes renewable energy in 15 countries to help end climate change.
AES relies on Google’s AutoML Vision to assess damage to its hundreds of wind turbines. It uses drones to inspect and photograph its turbines, but these drones typically take 30,000 images, and each one must be examined–which can be extremely time-taking.
With Google Cloud’s AutoML Vision, AES can use machine learning to auto-detect damage so that engineers can spend less time identifying damage and more time repairing it.
BigQuery Helps Insurance Firms Leverage Previous Storm Data for Better Pricing Insights

8550
Of your peers have already read this article.
2:00 Minutes
The most insightful time you'll spend today!
It may be surprising to know that U.S. natural catastrophe economic losses totaled $119 billion in 2020, and 75% (or $89.4B) of those economic losses were caused by severe storms and cyclones. In the insurance industry, data is everything. Insurers use data to influence underwriting, rating, pricing, forms, marketing, and even claims handling. When fueled by good data, risk assessments become more accurate and produce better business results. To make this possible, the industry is increasingly turning to predictive analytics, which uses data, statistical algorithms, and machine learning (ML) techniques to predict future outcomes based on historical data. Insurance firms also integrate external data sources with their own existing data to generate more insight into claimants and damages. Google Cloud Public Datasets offers more than 100 high-demand public datasets through BigQuery that helps insurers in these sorts of data “mashups.”
One particular dataset that insurers find very useful is Severe Storm Event Details from the U.S. National Oceanic and Atmospheric Administration (NOAA). As part of the Google Cloud Public Datasets program and NOAA’s Public Data Program, this severe storm data contains various types of storm reports by state, county, and event type—from 1950 to the present—with regular updates. Similar NOAA datasets within the Google Cloud Public Datasets program include the Significant Earthquake Database, Global Hurricane Tracks, and the Global Historical Tsunami Database.
In this post, we’ll explore how to apply storm event data for insurance pricing purposes using a few common data science tools—Python Notebook and BigQuery—to drive better insights for insurers.
Predicting outcomes with severe storm datasets
For property insurers, common determinants of insurance pricing include home condition, assessor and neighborhood data, and cost-to-replace. But macro forces such as natural disasters—like regional hurricanes, flash floods, and thunderstorms—can also significantly contribute to the risk profile of the insured. Insurance companies can leverage severe weather data for dynamic pricing of premiums by analyzing the severity of those events in terms of past damage done to property and crops, for example.
It’s important to set the premium correctly, however, considering the risks involved. Insurance companies now run sophisticated statistical models, taking into account various factors—many of which can change over time. After all, without accurate data, poor predictions can lead to business losses, particularly at scale.
The Severe Storm Event Details database includes information about a storm event’s location, azimuth (an angle measurement used in celestial coordination), distance, impact, and severity, including the cost of damages to property and crops. It documents:
- The occurrence of storms and other significant weather events of sufficient intensity to cause loss of life, injuries, significant property damage, and/or disruption to commerce.
- Rare, unusual weather events that generate media attention, such as snow flurries in South Florida or the San Diego coastal area.
- Other significant weather events, such as record maximum or minimum temperatures or precipitation that occur in connection with another event.
Data about a specific event is added to the dataset within 120 days to allow time for damage assessments and other analysis.
Driving business insights with BigQuery and notebooks
Google Cloud’s BigQuery provides easy access to this data in multiple ways. For example, you can query directly within BigQuery and perform analysis using SQL.
Another popular option in the data science and analyst community is to access BigQuery from within the Notebook environment to intersperse Python code and SQL text, and then perform ad hoc experimentation. This uses the powerful BigQuery compute to query and process huge amounts of data without having to perform the complex transformations within the memory in Pandas, for example.
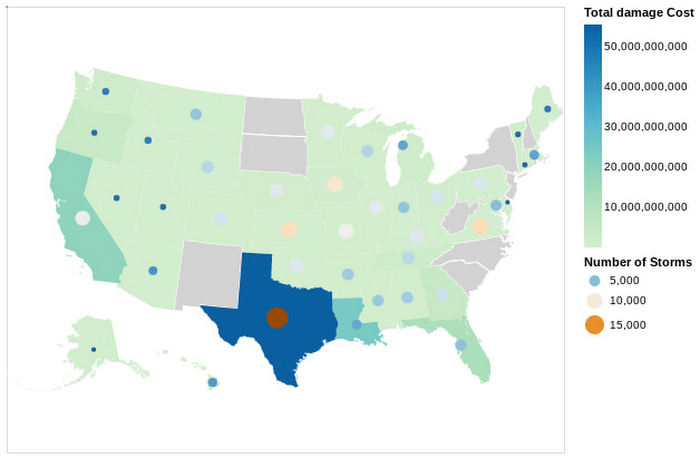
In this Python notebook, we have shown how the severe storm data can be used to generate risk profiles of various zip codes based on the severity of those events as measured by the damage incurred. The severe storm dataset is queried to retrieve a smaller dataset into the notebook, which is then explored and visualized using Python. Here’s a look at the risk profiles of the zip codes:
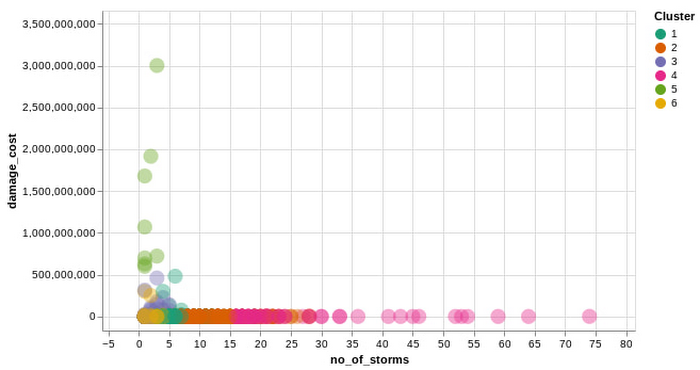
Another Google Cloud resource for insurers is BigQuery ML, which allows them to create and execute machine learning models on their data using standard SQL queries. In this notebook, with a K-Means Clustering algorithm, we have used BigQuery ML to generate different clusters of zip codes in the top five states impacted by severe storms. These clusters show different levels of impact by the storms, indicating different risk groups.
The example notebook is a reference guide to enable analysts to easily incorporate and leverage public datasets to augment their analysis and streamline the journey to business insights. Instead of having to figure out how to access and use this data yourself, the public datasets, coupled with BigQuery and other solutions, provide a well-lit path to insights, leaving you more time to focus on your own business solutions.
Making an impact with big data
Google Cloud’s Public Datasets is just one resource within the broader Google Cloud ecosystem that provides data science teams within the financial services with flexible tools to gather deeper insights for growth. The severe storm dataset is a part of our environmental, social, and governance (ESG) efforts to organize information about our planet and make it actionable through technology, helping people make a positive impact together.
To learn more about this public dataset collaboration between Google Cloud and NOAA, attend the Dynamic Pricing in Insurance: Leveraging Datasets To Predict Risk and Price session at the Google Cloud Financial Services Summit on May 27. You can also check out our recent blog and explore more about BigQuery and BigQuery ML.
New Capabilities in BigQuery to Ease Anomalies Detection in the Absence of Labeled Data

6320
Of your peers have already read this article.
4:00 Minutes
The most insightful time you'll spend today!
When it comes to anomaly detection, one of the key challenges that many organizations face is that it can be difficult to know how to define what an anomaly is. How do you define and anticipate unusual network intrusions, manufacturing defects, or insurance fraud? If you have labeled data with known anomalies, then you can choose from a variety of supervised machine learning model types that are already supported in BigQuery ML. But what can you do if you don’t know what kind of anomaly to expect, and you don’t have labeled data? Unlike typical predictive techniques that leverage supervised learning, organizations may need to be able to detect anomalies in the absence of labeled data.
Today we are announcing the public preview of new anomaly detection capabilities in BigQuery ML that leverage unsupervised machine learning to help you detect anomalies without needing labeled data. Depending on whether or not the training data is time series, users can now detect anomalies in training data or on new input data using a new ML.DETECT_ANOMALIES function (documentation), with the following models:
- Autoencoder model, now in Public Preview (documentation)
- K-means model, already GA (documentation)
- ARIMA_PLUS time series model, already GA (documentation)
How does anomaly detection with ML.DETECT_ANOMALIES work?
To detect anomalies in non-time-series data, you can use:
- K-means clustering models: When you use
ML.DETECT_ANOMALIESwith a k-means model, anomalies are identified based on the value of each input data point’s normalized distance to its nearest cluster. If that distance exceeds a threshold determined by the contamination value provided by the user, the data point is identified as an anomaly. - Autoencoder models: When you use
ML.DETECT_ANOMALIESwith an autoencoder model, anomalies are identified based on the reconstruction error for each data point. If the error exceeds a threshold determined by the contamination value, it is identified as an anomaly.
To detect anomalies in time-series data, you can use:
- ARIMA_PLUS time series models: When you use
ML.DETECT_ANOMALIESwith an ARIMA_PLUS model, anomalies are identified based on the confidence interval for that timestamp. If the probability that the data point at that timestamp occurs outside of the prediction interval exceeds a probability threshold provided by the user, the datapoint is identified as an anomaly.
Below we show code examples of anomaly detection in BigQuery ML for each of the above scenarios.
Anomaly detection with a k-means clustering model
You can now detect anomalies using k-means clustering models, by running ML.DETECT_ANOMALIES to detect anomalies in the training data or in new input data. Begin by creating a k-means clustering model:
Language: SQL
CREATE MODEL `mydataset.my_kmeans_model`OPTIONS(MODEL_TYPE = 'kmeans',NUM_CLUSTERS = 8,KMEANS_INIT_METHOD = 'kmeans++') ASSELECT* EXCEPT(Time, Class)FROM`bigquery-public-data.ml_datasets.ulb_fraud_detection`;
With the k-means clustering model trained, you can now run ML.DETECT_ANOMALIES to detect anomalies in the training data or in new input data.
To detect anomalies in the training data, use ML.DETECT_ANOMALIES with the same data used during training:
Language: SQL
SELECT*FROMML.DETECT_ANOMALIES(MODEL `mydataset.my_kmeans_model`,STRUCT(0.02 AS contamination),TABLE `bigquery-public-data.ml_datasets.ulb_fraud_detection`);

To detect anomalies in new data, use ML.DETECT_ANOMALIES and provide new data as input:
Language: SQL
SELECT*FROMML.DETECT_ANOMALIES(MODEL `mydataset.my_kmeans_model`,STRUCT(0.02 AS contamination),(SELECT * FROM `mydataset.newdata`));

How does anomaly detection work for k-means clustering models?
Anomalies are identified based on the value of each input data point’s normalized distance to its nearest cluster, which, if exceeds a threshold determined by the contamination value, is identified as an anomaly. How does this work exactly? With a k-means model and data as inputs, ML.DETECT_ANOMALIES first computes the absolute distance for each input data point to all cluster centroids in the model, then normalizes each distance by the respective cluster radius (which is defined as the standard deviation of the absolute distances of all points in this cluster to the centroid). For each data point, ML.DETECT_ANOMALIES returns the nearest centroid_id based on normalized_distance, as seen in the screenshot above. The contamination value, specified by the user, determines the threshold of whether a data point is considered an anomaly. For example, a contamination value of 0.1 means that the top 10% of descending normalized distance from the training data will be used as the cut-off threshold. If the normalized distance for a datapoint exceeds the threshold, then it is identified as an anomaly. Setting an appropriate contamination will be highly dependent on the requirements of the user or business.
For more information on anomaly detection with k-means clustering, please see the documentation here.
Anomaly detection with an autoencoder model
You can now detect anomalies using autoencoder models, by running ML.DETECT_ANOMALIES to detect anomalies in the training data or in new input data.
Begin by creating an autoencoder model:
Language: SQL
CREATE MODEL `mydataset.my_autoencoder_model`OPTIONS(model_type='autoencoder',activation_fn='relu',batch_size=8,dropout=0.2,hidden_units=[32, 16, 4, 16, 32],learn_rate=0.001,l1_reg_activation=0.0001,max_iterations=10,optimizer='adam') ASSELECT* EXCEPT(Time, Class)FROM`bigquery-public-data.ml_datasets.ulb_fraud_detection`;
To detect anomalies in the training data, use ML.DETECT_ANOMALIES with the same data used during training:
Language: SQL
SELECT*FROMML.DETECT_ANOMALIES(MODEL `mydataset.my_autoencoder_model`,STRUCT(0.02 AS contamination),TABLE `bigquery-public-data.ml_datasets.ulb_fraud_detection`);

To detect anomalies in new data, use ML.DETECT_ANOMALIES and provide new data as input:
Language: SQL
SELECT*FROMML.DETECT_ANOMALIES(MODEL `mydataset.my_autoencoder_model`,STRUCT(0.02 AS contamination),(SELECT * FROM `mydataset.newdata`));

How does anomaly detection work for autoencoder models?
Anomalies are identified based on the value of each input data point’s reconstructed error, which, if exceeds a threshold determined by the contamination value, is identified as an anomaly. How does this work exactly? With an autoencoder model and data as inputs, ML.DETECT_ANOMALIES first computes the mean_squared_error for each data point between its original values and its reconstructed values. The contamination value, specified by the user, determines the threshold of whether a data point is considered an anomaly. For example, a contamination value of 0.1 means that the top 10% of descending error from the training data will be used as the cut-off threshold. Setting an appropriate contamination will be highly dependent on the requirements of the user or business.
For more information on anomaly detection with autoencoder models, please see the documentation here.
Anomaly detection with an ARIMA_PLUS time-series model

With ML.DETECT_ANOMALIES, you can now detect anomalies using ARIMA_PLUS time series models in the (historical) training data or in new input data. Here are some examples of when might you want to detect anomalies with time-series data:
Detecting anomalies in historical data:
- Cleaning up data for forecasting and modeling purposes, e.g. preprocessing historical time series before using them to train an ML model.
- When you have a large number of retail demand time series (thousands of products across hundreds of stores or zip codes), you may want to quickly identify which stores and product categories had anomalous sales patterns, and then perform a deeper analysis of why that was the case.
Forward looking anomaly detection:
- Detecting consumer behavior and pricing anomalies as early as possible: e.g. if traffic to a specific product page suddenly and unexpectedly spikes, it might be because of an error in the pricing process that leads to an unusually low price.
- When you have a large number of retail demand time series (thousands of products across hundreds of stores or zip codes), you would like to identify which stores and product categories had anomalous sales patterns based on your forecasts, so you can quickly respond to any unexpected spikes or dips.
How do you detect anomalies using ARIMA_PLUS? Begin by creating an ARIMA_PLUS time series model:
Language: SQL
CREATE OR REPLACE MODEL mydataset.my_arima_plus_modelOPTIONS(MODEL_TYPE='ARIMA_PLUS',TIME_SERIES_TIMESTAMP_COL='date',TIME_SERIES_DATA_COL='total_amount_sold',TIME_SERIES_ID_COL='item_name',HOLIDAY_REGION='US') ASSELECTdate,item_description AS item_name,SUM(bottles_sold) AS total_amount_soldFROM`bigquery-public-data.iowa_liquor_sales.sales`GROUP BYdate,item_nameHAVINGdate BETWEEN DATE('2016-01-04') AND DATE('2017-06-01')AND item_name IN ("Black Velvet", "Captain Morgan Spiced Rum","Hawkeye Vodka", "Five O'Clock Vodka", "Fireball Cinnamon Whiskey");
To detect anomalies in the training data, use ML.DETECT_ANOMALIES with the model obtained above:
Language: SQL
SELECT*FROMML.DETECT_ANOMALIES(MODEL `mydataset.my_arima_plus_model`,STRUCT(0.8 AS anomaly_prob_threshold));

To detect anomalies in new data, use ML.DETECT_ANOMALIES and provide new data as input:
Language: SQL
WITHnew_data AS (SELECTdate,item_description AS item_name,SUM(bottles_sold) AS total_amount_soldFROM`bigquery-public-data.iowa_liquor_sales.sales`GROUP BYdate,item_nameHAVINGdate BETWEEN DATE('2017-06-02')AND DATE('2017-10-01')AND item_name IN ('Black Velvet','Captain Morgan Spiced Rum','Hawkeye Vodka',"Five O'Clock Vodka",'Fireball Cinnamon Whiskey') )SELECT*FROMML.DETECT_ANOMALIES(MODEL `mydataset.my_arima_plus_model`,STRUCT(0.8 AS anomaly_prob_threshold),(SELECT*FROMnew_data));

For more information on anomaly detection with ARIMA_PLUS time series models, please see the documentation here.
Thanks to the BigQuery ML team, especially Abhinav Khushraj, Abhishek Kashyap, Amir Hormati, Jerry Ye, Xi Cheng, Skander Hannachi, Steve Walker, and Stephanie Wang.
More Relevant Stories for Your Company

The Power of Personalization: Ocado Retail’s Strategy to Boost Revenue and Lower Churn
Retailers are becoming more skilled at making individual customers feel heard and valued. This is a necessity given the fact that 66% of respondents to a McKinsey survey stated that they expect email marketing messages to be tailored to their needs. While marketing personalization expertise is growing, it’s still difficult to manage,



Everything You Need to Know About Google Cloud ML Engine 101
Machine learning is all around us today. But data scientists and IT teams tasked with creating models have a hard time bringing together the right mix of ingredients—from data, infrastructure, tools, and APIs—to do their jobs effectively. Google’s Cloud ML Engine eases many of the challenges data scientists and IT
Google Introduces ML-based Predictive Autoscaling to Forecast Capacity and Match Scaling Demands
At Google Cloud, we believe you get most benefits from the cloud when you scale infrastructure based on changing demand. Compute Engine allows you to configure autoscaling to save costs during periods of low demand, and add capacity to support peak loads. When you use a managed instance group (MIG), you can have an autoscaler

Building Unique Customer Experiences with Speed & Scale: Sprinklr & Google Cloud
Enterprises are increasingly seeking out technologies that help them create unique experiences for customers with speed and at scale. At the same time, customers want flexibility when deciding where to manage their enterprise data, particularly when it comes to business-critical applications. That’s why I’m thrilled that Sprinklr, the unified customer
