





Intel-Google Collaboration Brings Edge Computing on Factory Floors: Hannover Messe 2022

3221
Of your peers have already read this article.
1:30 Minutes
The most insightful time you'll spend today!
The typical smart factory is said to produce around 5 petabytes of data per week. That’s equivalent to 5 million gigabytes, or roughly 20,000 smartphones.
Managing such vast amounts of data in one facility, let alone a global organization, would be challenging enough. Doing so on the factory floor, in near-real-time, to drive insights, enhancements, and particularly safety, is a big dream for leading manufacturers. And for many, it’s becoming a reality, thanks to the possibilities unlocked with edge computing.
Edge computing brings computation, connectivity, and data closer to where the information is generated, enabling better data control, faster insights, and actions. Taking advantage of edge computing requires the hardware and software to collect, process, and analyze data locally to enable better decisions and improve operations.
At Hannover Messe 2022, Intel and Google Cloud will demonstrate a new technology implementation that combines the latest generation of Intel processors with Google Cloud’s data and AI expertise to optimize production operations from edge to cloud. This proof-of-concept project is powered by the Edge Insights for Industrial platform (EII), an industry-specific platform from Intel; and a pair of Google Cloud solutions: Anthos, Google Cloud’s managed applications platform, and the newly-launched Manufacturing Data Engine.
Edge computing exploits the untapped gold mine of data sitting on-site and is expected to grow rapidly. The Linux Foundation’s “2021 State of the Edge” predicts that by 2025, edge-related devices will produce roughly 90 zettabytes of data. Edge computing can help provide greater data privacy and security, and can accomodate the reduced bandwidth needs between local storage and the cloud.
Imagine a world in which the power of big data and AI-driven data analytics is available at the point where the data is gathered to inform, make, and implement decisions in near real-time.
This could be anywhere on the factory floor, from a welding station to a painting operation or more. Data would be collected by monitoring robotic welders, for example, and analyzed by industrial PCs (IPCs) located at the factory edge. These edge IPCs would detect when the welders are starting to go off spec, predicting increased defect rates even before they appear, and adding preventive maintenance to correct the errors without any direct intervention. Real time, predictive analytics using AI could substantially prevent defects before they happen. Or the same IPCs could use digital cameras for visual inspection to monitor and identify defects in real-time, allowing them to be addressed quickly.
Edge computing has powerful potential applications in assisting with data gathering, processing, storage and analysis in many manufacturing sectors, including automotive, semiconductor and electronics manufacturing, and consumer packaged goods. Whether modeling and analysis is done and stored locally or in the cloud, or is predictive, simultaneous, or lagged, technology providers are aligning to meet these needs. This is the new world of edge computing.
The joint Intel and Google Cloud proof of concept aims to extend the Google Cloud capabilities and solutions to the edge. Intel’s full breadth of industrial solutions, hardware and software, are coming together in this edge-ready solution, encompassing Google Cloud industry-leading tools. The concept shortens the time to insights, streamlining data analytics and AI at the edge.
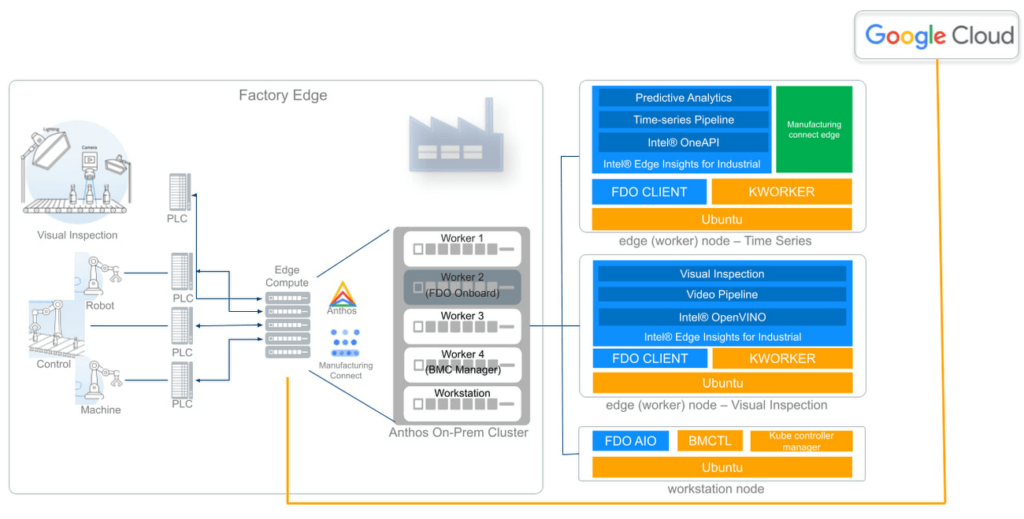
The Intel-Google Cloud proof of concept demonstrates how manufacturers can gather and analyze data from over 250 factory devices using Manufacturing Connect from Google Cloud, providing a powerful platform to run data ingestion and AI analytics at the edge.
In this demonstration in Hannover, Intel and Google Cloud show how manufacturers can capture time-series data from robotic welders to inspect welding quality and show how predictive analytics can benefit the factory operators. In addition, the video and image data is captured from a factory camera to show how visual inspection can highlight anomalies on plastic chips with model scoring. The demo also features zero-touch device onboarding using FIDO Device Onboard (FDO) to illustrate the ease with which additional computers could be added to the existing Anthos cluster.
By combining Google Cloud’s expertise in data, AI/ML and Intel’s Edge Insight’s for Industrial platform that was optimized to run on Google Anthos, manufacturers can run and manage their containerized applications at the edge, in on-premise data center, or in public clouds using an efficient and secure connection to the Manufacturing Data Engine from Google Cloud. It forges a complete edge-to-cloud solution.
Simplified device onboarding is available using Fido Device Onboard (FDO)—an open IoT protocol that brings fast, secure, and scalable zero-touch onboarding of new IoT devices to the edge. FDO allows factories to easily deploy automation and intelligence in their environment without introducing complexity into their OT infrastructure.
The Intel-Google Cloud implementation can analyze that data using localized Intel or third-party AI and machine learning algorithms. Applications can be layered on the Intel hardware and Anthos ecosystem, allowing customized data monitoring and ingestion, data management and storage, modeling, and analytics. This joint PoC facilitates and support improved decision making and operations, whether automated or triggered by the engineers on the front lines.
Intel collaborates with a vibrant ecosystem of leading hardware partners to develop solutions for the industrial market by using the latest generation of Intel processors. These processors can run data intensive workloads at the edge with ease.
Putting data and AI directly into the hands of manufacturing engineers can improve quality inspection loops, customer satisfaction, and ultimately the bottom line.
The new manufacturing solutions will be demonstrated in person for the first time at Hannover Messe 2022, May 30–June 2, 2022. Visit us at Stand E68, Hall 004, or schedule a meeting for an onsite demonstration with our experts.
10148
Of your peers have already watched this video.
1:00 Minutes
The most insightful time you'll spend today!
Predict User Churn on Gaming Apps with Google Analytics Data using BigQuery ML
User retention can be a major challenge for mobile game developers. According to the Mobile Gaming Industry Analysis in 2019, most mobile games only see a 25% retention rate for users after the first day. To retain a larger percentage of users after their first use of an app, developers can take steps to motivate and incentivize certain users to return. But to do so, developers need to identify the propensity of any specific user returning after the first 24 hours.
In this blog post, we will discuss how you can use BigQuery ML to run propensity models on Google Analytics 4 data from your gaming app to determine the likelihood of specific users returning to your app.
You can also use the same end-to-end solution approach in other types of apps using Google Analytics for Firebase as well as apps and websites using Google Analytics 4. To try out the steps in this blogpost or to implement the solution for your own data, you can use this Jupyter Notebook.
Using this blog post and the accompanying Jupyter Notebook, you’ll learn how to:
- Explore the BigQuery export dataset for Google Analytics 4
- Prepare the training data using demographic and behavioural attributes
- Train propensity models using BigQuery ML
- Evaluate BigQuery ML models
- Make predictions using the BigQuery ML models
- Implement model insights in practical implementations
Google Analytics 4 (GA4) properties unify app and website measurement on a single platform and are now default in Google Analytics. Any business that wants to measure their website, app, or both, can use GA4 for a more complete view of how customers engage with their business. With the launch of Google Analytics 4, BigQuery export of Google Analytics data is now available to all users. If you are already using a Google Analytics 4 property, you can follow this guide to set up exporting your GA data to BigQuery.
Once you have set up the BigQuery export, you can explore the data in BigQuery. Google Analytics 4 uses an event-based measurement model. Each row in the data is an event with additional parameters and properties. The Schema for BigQuery Export can help you to understand the structure of the data.
In this blogpost, we use the public sample export data from an actual mobile game app called “Flood It!” (Android, iOS) to build a churn prediction model. But you can use data from your own app or website.
Here’s what the data looks like. Each row in the dataset is a unique event, which can contain nested fields for event parameters.
SELECT *FROM `firebase-public-project.analytics_153293282.events_*`TABLESAMPLE SYSTEM (1 PERCENT)

This dataset contains 5.7M events from over 15k users.
SELECTCOUNT(DISTINCT user_pseudo_id) as count_distinct_users,COUNT(event_timestamp) as count_eventsFROM`firebase-public-project.analytics_153293282.events_*

Our goal is to use BigQuery ML on the sample app dataset to predict propensity to user churn or not churn based on users’ demographics and activities within the first 24 hours of app installation.

In the following sections, we’ll cover how to:
- Pre-process the raw event data from GA4
- Identify users & the label feature
- Process demographic features
- Process behavioral features
- Train classification model using BigQuery ML
- Evaluate the model using BigQueryML
- Make predictions using BigQuery ML
- Utilize predictions for activation
Pre-process the raw event data
You cannot simply use raw event data to train a machine learning model as it would not be in the right shape and format to use as training data. So in this section, we’ll go through how to pre-process the raw data into an appropriate format to use as training data for classification models.
This is what the training data should look like for our use case at the end of this section:

Notice that in this training data, each row represents a unique user with a distinct user ID (user_pseudo_id).
Identify users & the label feature
We first filtered the dataset to remove users who were unlikely to return the app anyway. We defined these ‘bounced’ users as ones who spent less than 10 mins with the app. Then we labeled all remaining users:
- churned: No event data for the user after 24 hours of first engaging with the app.
- returned: The user has at least one event record after 24 hours of first engaging with the app.
For your use case, you can have a different definition of bounce and churning. Also you can even try to predict something else other than churning, e.g.:
- whether a user is likely to spend money on in-game currency
- likelihood of completing n-number of game levels
- likelihood of spending n amount of time in-game etc.
In such cases, label each record accordingly so that whatever you are trying to predict can be identified from the label column.
From our dataset, we found that ~41% users (5,557) bounced. However, from the remaining users (8,031), ~23% (1,883) churned after 24 hours:
SELECTbounced,churned,COUNT(churned) as count_usersFROMbqmlga4.returningusersGROUP BY 1,2ORDER BY bounced

To create these bounced and churned columns, we used the following snippet of SQL code.
...#churned = 1 if last_touch within 24 hr of app installation, else 0IF (user_last_engagement < TIMESTAMP_ADD(user_first_engagement,INTERVAL 24 HOUR),1,0 ) AS churned,#bounced = 1 if last_touch within 10 min, else 0IF (user_last_engagement <= TIMESTAMP_ADD(user_first_engagement,INTERVAL 10 MINUTE),1,0 ) AS bounced,...
You can view the Jupyter Notebook for the full query used for materializing the bounced and churned labels.
Process demographic features
Next, we added features both for demographic data and for behavioral data spanning across multiple columns. Having a combination of both demographic data and behavioral data helps to create a more predictive model.
We used the following fields for each user as demographic features:
geo.countrydevice.operating_systemdevice.language
A user might have multiple unique values in these fields — for example if a user uses the app from two different devices. To simplify, we used the values from the very first user engagement event.
CREATE OR REPLACE VIEW bqmlga4.user_demographics AS (WITH first_values AS (SELECTuser_pseudo_id,geo.country as country,device.operating_system as operating_system,device.language as language,ROW_NUMBER() OVER (PARTITION BY user_pseudo_id ORDER BY event_timestamp DESC) AS row_numFROM `firebase-public-project.analytics_153293282.events_*`WHERE event_name="user_engagement")SELECT * EXCEPT (row_num)FROM first_valuesWHERE row_num = 1 #first engagement);
Process behavioral features
There is additional demographic information present in the GA4 export dataset, e.g. app_info, device, event_params, geo etc. You may also send demographic information to Google Analytics through each hit via user_properties. Furthermore, if you have first-party data on your own system, you can join that with the GA4 export data based on user_ids.
To extract user behavior from the data, we looked into the user’s activities within the first 24 hours of first user engagement. In addition to the events automatically collected by Google Analytics, there are also the recommended events for games that can be explored to analyze user behavior. For our use case, to predict user churn, we counted the number of times the follow events were collected for a user within 24 hours of first user engagement:
user_engagementlevel_start_quickplaylevel_end_quickplaylevel_complete_quickplaylevel_reset_quickplaypost_scorespend_virtual_currencyad_rewardchallenge_a_friendcompleted_5_levelsuse_extra_steps
The following query shows how these features were calculated:
WITHevents_first24hr AS (SELECTe.*FROM`firebase-public-project.analytics_153293282.events_*` eJOINbqmlga4.returningusers rONe.user_pseudo_id = r.user_pseudo_idWHERETIMESTAMP_MICROS(e.event_timestamp) <= r.ts_24hr_after_first_engagement)SELECTuser_pseudo_id,SUM(IF(event_name = 'user_engagement', 1, 0)) AS cnt_user_engagement,# ... repeated for all behavior data ...SUM(IF(event_name = 'use_extra_steps', 1, 0)) AS cnt_use_extra_steps,FROMevents_first24hrGROUP BY1
View the notebook for the query used to aggregate and extract the behavioral data. You can use different sets of events for your use case. To view the complete list of events, use the following query:
SELECTevent_name,COUNT(event_name) as event_countFROM`firebase-public-project.analytics_153293282.events_*`GROUP BY 1ORDER BYevent_count DESC
After this we combined the features to ensure our training dataset reflects the intended structure. We had the following columns in our table:
- User ID:
user_pseudo_id
- Label:
churned
- Demographic features
countrydevice_osdevice_language
- Behavioral features
cnt_user_engagementcnt_level_start_quickplaycnt_level_end_quickplaycnt_level_complete_quickplaycnt_level_reset_quickplaycnt_post_scorecnt_spend_virtual_currencycnt_ad_rewardcnt_challenge_a_friendcnt_completed_5_levelscnt_use_extra_stepsuser_first_engagement
At this point, the dataset was ready to train the classification machine learning model in BigQuery ML. Once trained, the model will output a propensity score between churn (churned=1) or return (churned=0) indicating the probability of a user churning based on the training data.
Train classification model
When using the CREATE MODEL statement, BigQuery ML automatically splits the data between training and test. Thus the model can be evaluated immediately after training (see the documentation for more information).
For the ML model, we can choose among the following classification algorithms where each type has its own pros and cons:

Often logistic regression is used as a starting point because it is the fastest to train. The query below shows how we trained the logistic regression classification models in BigQuery ML.
CREATE OR REPLACE MODEL bqmlga4.churn_logregTRANSFORM(EXTRACT(MONTH from user_first_engagement) as month,EXTRACT(DAYOFYEAR from user_first_engagement) as julianday,EXTRACT(DAYOFWEEK from user_first_engagement) as dayofweek,EXTRACT(HOUR from user_first_engagement) as hour,* EXCEPT(user_first_engagement, user_pseudo_id))OPTIONS(MODEL_TYPE="LOGISTIC_REG",INPUT_LABEL_COLS=["churned"]) ASSELECT*FROMbqmlga4.train
We extracted month, julianday, and dayofweek from datetimes/timestamps as one simple example of additional feature preprocessing before training. Using TRANSFORM() in your CREATE MODEL query allows the model to remember the extracted values. Thus, when making predictions using the model later on, these values won’t have to be extracted again. View the notebook for the example queries to train other types of models (XGBoost, deep neural network, AutoML Tables).
Evaluate model
Once the model finished training, we ran ML.EVALUATE to generate precision, recall, accuracy and f1_score for the model:
SELECT*FROMML.EVALUATE(MODEL bqmlga4.churn_logreg)

The optional THRESHOLD parameter can be used to modify the default classification threshold of 0.5. For more information on these metrics, you can read through the definitions on precision and recall, accuracy, f1-score, log_loss and roc_auc. Comparing the resulting evaluation metrics can help to decide among multiple models.Furthermore, we used a confusion matrix to inspect how well the model predicted the labels, compared to the actual labels. The confusion matrix is created using the default threshold of 0.5, which you may want to adjust to optimize for recall, precision, or a balance (more information here).
SELECTexpected_label,_0 AS predicted_0,_1 AS predicted_1FROMML.CONFUSION_MATRIX(MODEL bqmlga4.churn_logreg)

This table can be interpreted in the following way:

Make predictions using BigQuery ML
Once the ideal model was available, we ran ML.PREDICT to make predictions. For propensity modeling, the most important output is the probability of a behavior occurring. The following query returns the probability that the user will return after 24 hrs. The higher the probability and closer it is to 1, the more likely the user is predicted to return, and the closer it is to 0, the more likely the user is predicted to churn.
SELECTuser_pseudo_id,returned,predicted_returned,predicted_returned_probs[OFFSET(0)].prob as probability_returnedFROMML.PREDICT(MODEL bqmlga4.churn_logreg,(SELECT * FROM bqmlga4.train)) #can be replaced with a proper test dataset
Utilize predictions for activation
Once the model predictions are available for your users, you can activate this insight in different ways. In our analysis, we used user_pseudo_id as the user identifier. However, ideally, your app should send back the user_id from your app to Google Analytics. In addition to using first-party data for model predictions, this will also let you join back the predictions from the model into your own data.
- You can import the model predictions back into Google Analytics as a user attribute. This can be done using the Data Import feature for Google Analytics 4. Based on the prediction values you can Create and edit audiences and also do Audience targeting. For example, an audience can be users with prediction probability between 0.4 and 0.7, to represent users who are predicted to be “on the fence” between churning and returning.
- For Firebase Apps, you can use the Import segments feature. You can tailor user experience by targeting your identified users through Firebase services such as Remote Config, Cloud Messaging, and In-App Messaging. This will involve importing the segment data from BigQuery into Firebase. After that you can send notifications to the users, configure the app for them, or follow the user journeys across devices.
- Run targeted marketing campaigns via CRMs like Salesforce, e.g. send out reminder emails.
You can find all of the code used in this blogpost in the Github repository:
What’s next?
Continuous model evaluation and re-training
As you collect more data from your users, you may want to regularly evaluate your model on fresh data and re-train the model if you notice that the model quality is decaying.
Continuous evaluation—the process of ensuring a production machine learning model is still performing well on new data—is an essential part in any ML workflow. Performing continuous evaluation can help you catch model drift, a phenomenon that occurs when the data used to train your model no longer reflects the current environment.
To learn more about how to do continuous model evaluation and re-train models, you can read the blogpost: Continuous model evaluation with BigQuery ML, Stored Procedures, and Cloud Scheduler
More resources
If you’d like to learn more about any of the topics covered in this post, check out these resources:
- BigQuery export of Google Analytics data
- BigQuery ML quickstart
- Events automatically collected by Google Analytics 4
- Qwiklabs: Create ML models with BigQuery ML
Or learn more about how you can use BigQuery ML to easily build other machine learning solutions:
- How to build demand forecasting models with BigQuery ML
- How to build a recommendation system on e-commerce data using BigQuery ML
Let us know what you thought of this post, and if you have topics you’d like to see covered in the future! You can find us on Twitter at @polonglin and @_mkazi_.Thanks to reviewers: Abhishek Kashyap, Breen Baker, David Sabater Dinter.
7 Fantastic Ways Google Cloud VMWare Engine Stands Out from the Rest for Running VMWare Workloads in the Cloud!
3580
Of your peers have already read this article.
2:00 Minutes
The most insightful time you'll spend today!
Google Cloud VMware Engine delivers an enterprise-grade, cloud-native VMware experience that is built on Google Cloud’s highly performant and scalable infrastructure. By enabling a consistent VMware experience, the service allows customers to adopt Google Cloud rapidly, easily, and with minimal modifications to their vSphere workloads, bringing the best of VMware and Google Cloud together on one platform for a variety of use-cases. These include rapid data center exit, application lift and shift, disaster recovery, virtual desktop infrastructure, or modernization at your own pace.
Here are seven ways VMware Engine outshines alternatives for running your VMware workloads in the cloud, simplify your operations, and help you innovate faster:
- Dedicated 100Gbps east-west networking
Google Cloud VMware Engine nodes come with redundant switching and dedicated 100Gbps east-west networking with no oversubscription of bandwidth, unlike other options where there is generally oversubscription. This is especially important when it comes to running latency-sensitive workloads. - Four 9’s of availability in a single zone
The service offers 99.99% uptime SLA for a cluster in a single Zone with five to 16 nodes and FTT=2 or more without the need for stretched clusters, which is higher than the alternatives. Further, dedicated connectivity for core service functions such as vSAN and vMotion enables better solution stability and availability. This enables the service to support the needs of enterprise workloads that require high availability.
Note: “Cluster” means a deployment of three or more dedicated bare metal nodes running VMware ESXi and associated networking managed via management interfaces.
- Global networking without complex routing
Google Cloud VMware Engine networking is built based on Google Cloud’s powerful networking architecture. With simplified regional and global routing modes—which allow a VPC’s subnets to be deployed in any region where our service is available—you can architect global networks without the need or overhead of creating and connecting regional network designs. You get instant, direct Layer 3 access between them. In alternative cloud environments, you may have to configure special networking between regions, often requiring VPN-based tunnels over the WAN to enable global uniform network communication. This adds to the deployment and operational complexity, in addition to cost. - Integrated multi-VPC networking
Users often have application deployments in different VPC networks, such as separate dev/test and production environments or multiple administrative domains across business units. The service supports “many-to-many” access from VPC networks to Google Cloud VMware Engine networks with multi-VPC networking, allowing you to retain existing deployed architectures and extend them flexibly to your VMware environments. In addition, by providing multi-VPC networking, you can pool their VMware needs—say for QA and dev—to a smaller set of clusters, effectively reducing their costs.
For more information about the end-to-end networking capabilities and services available in Google Cloud VMware Engine, please refer to the Private Cloud Networking for Google Cloud VMware Engine whitepaper. Here, you’ll find details about network flows, configuration options, and the differentiated benefits of running your VMware workloads in Google Cloud.
- Unified, cloud-integrated model
Google Cloud VMware Engine is a fully managed Google first-party service, operated and supported by Google and its world-class team. With fully integrated identities, billing, and access control, you have a simpler end-to-end experience that is different from other services. You access Google Cloud VMware Engine service via the Google Cloud console, like any other Google Cloud service. You can also access other native Google Cloud services privately from your VMware private cloud running in Google Cloud VMware Engine over local connections. - Flexibility in third-party ecosystem compatibility
With Google Cloud VMware Engine, you can set up existing VMware on-premises third-party tools or products that require additional privileges by using a solution user account. This uniquely enables operational consistency, ensuring that the tools you have invested in and used over the years work on Google Cloud VMware Engine. Furthermore, in key areas such as vSAN data encryption, you have the choice of not only using Google Cloud Key Management Service (KMS)—which is turned on by default on vSAN datastores—but also external KMS providers such as HyTrust, Thales, and Fortanix. - Dense nodes with high storage:core and memory:core ratios and fast provisioning
Google Cloud VMware Engine nodes are dense. Each node is powered by Intel® Xeon® Scalable Processors and comes with 36 cores, 72 hyperthreaded cores, 768 GB memory, 19.2 TB NVMe data and 3.2 TB NVMe cache storage. This, along with oversubscription, leads to high consolidation ratios and compelling storage:core per dollar and memory:core per dollar. In addition, you can rapidly spin up these nodes in a VMware private cloud often in under an hour, enabling on-demand, VMware-consistent capacity in Google Cloud for your needs.
These are just a few examples of customer-centric innovation that set Google Cloud VMware Engine infrastructure apart. In addition, migrating to Google cloud can save you up to 38% in TCO. Get started by learning about Google Cloud VMware Engine and your options for migration, or talk to our sales team to join the customers who have embarked upon this journey.
The authors would like to thank the Google Cloud VMware Engine product team for their contributions on this blog.
Google Cloud Region in Columbus to Accelerate Ohioan Businesses and Tech Transformation

3199
Of your peers have already read this article.
1:30 Minutes
The most insightful time you'll spend today!
Digital tools such as cloud computing are fueling economic transformation across the US, including Ohio. Google continues to invest across cities and communities in Ohio, bringing over 200 jobs to the state, and helping provide $12.85 billion of economic activity for tens of thousands of Ohio businesses, nonprofits, publishers, creators and developers. To further accelerate the transformation of all Ohioan businesses and technologists, we’re thrilled to announce our newest Google Cloud region in Columbus, Ohio is open. The Columbus cloud region brings a second region to the Midwest, the 10th region to North America, and grows our global cloud region count to 33.
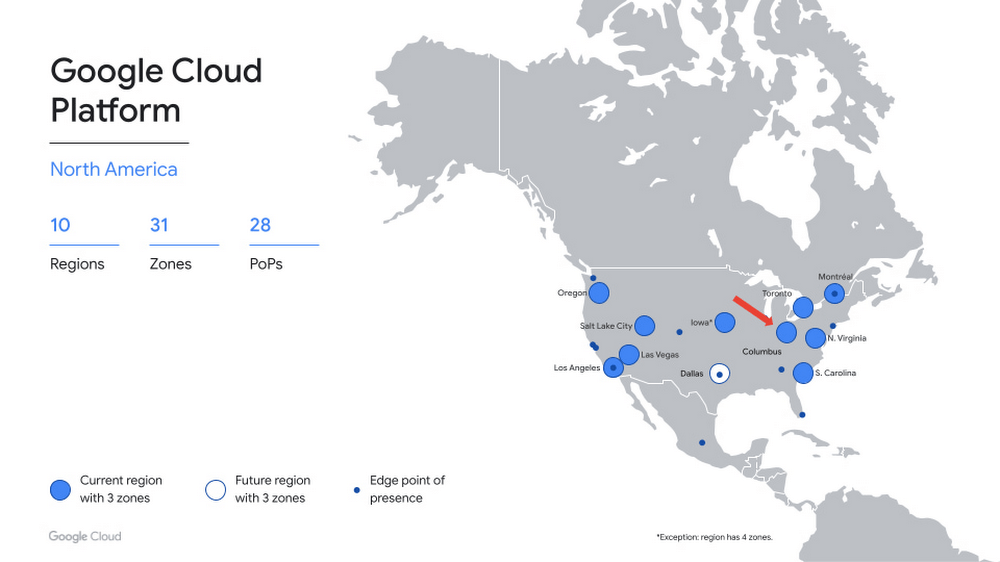
A region for the Buckeye State
Now open to Google Cloud customers, the Columbus region (us-east5) provides you with the speed and availability you need to innovate faster, build high-performing applications, and serve local customers — all on the cleanest cloud in the industry. Additionally, the region gives you added flexibility to distribute your workloads across the central, midwest, and eastern US.
The Columbus region offers immediate access to three zones, for high availability workloads, and our standard set of products, including Compute Engine, Google Kubernetes Engine, Cloud Storage, Persistent Disk, CloudSQL, and Cloud Identity. Our private backbone connects Columbus to our global network more quickly and securely. In addition, you can integrate your on-premises workloads with our new region using Cloud Interconnect. This means that Columbus-based customers can expand globally from their front door, and those based outside the region can more easily reach their users in the Midwest.
What customers are saying
Industries including retail, financial services, and IT are investing in Columbus. Organizations across these verticals have turned to the Google Cloud to innovate faster and help solve their most complex challenges
“As Wendy’s continues to innovate in new ways to create fast, frictionless, and fun interactions that redefine the way customers visit and enjoy our restaurants, our partnership with Google Cloud is a key enabler to delivering on our AI/ML and data analytics strategies. The proximity of the new Google Cloud region to Wendy’s headquarters provides the ability for us to move and scale quickly as business needs evolve. Additionally, Google Cloud’s investment in Columbus positions central Ohio as a true technology hub, which further boosts Wendy’s and other regional employers’ ability to recruit innovative talent,” said Kevin Vasconi, Chief Information Officer, Wendy’s.
“Huntington National Bank’s API Architecture is a central component to our growth and technology strategy. As our business segments grow from an offering and geographic perspective, we must evolve our technology to provide the optimal experience for our customers and our partners. Collaborating directly with Google Cloud on the build out of their cloud region in Central Ohio, provides the access our technology teams need to innovatively scale our infrastructure to meet the demands of our business with increased availability, lower latency, and greater resiliency,” said Geoff Preston, Chief Architect, Huntington National Bank.
“Google Cloud has been instrumental in our ability to scale and optimize data management and compute resources. We prioritize scale, elasticity and resilience in cloud services and Google Cloud delivers all three globally and locally. With Google Cloud security, we can efficiently process the quantities of application data required to accelerate alert detection and reduce response times for the critical infrastructure our customers depend on to enable the continuity of their vital applications.” said Sheryl Haislet, Chief Information Officer at Vertiv, a global provider of critical digital infrastructure and continuity systems headquartered in Columbus, Ohio, that leverages Google Cloud solutions to provide resilience for its operations and to better support customers.
“The addition of the new cloud region in Ohio continues to demonstrate Google Cloud’s commitment to the enterprise space and their presence in the region,” said Chris Delong, Chief Technology Officer, Designer Brands Inc. / DSW
What’s next
We are thrilled to welcome you to our new cloud region in Columbus, and eagerly await to see what you build with our platform. Register here for our Cloud Study Jam in June – an event for local developers to get hands-on training with Google Cloud. Stay tuned for more region announcements and launches this year, including our next U.S. region in Dallas, TX. And for more information, contact sales to get started with Google Cloud today.
Beyond Traditional Learning: AI-based Online Learning Platform and Google Cloud Solutions Push Learners to Get Ahead

10324
Of your peers have already read this article.
1:30 Minutes
The most insightful time you'll spend today!
The combination of a vital need for IT experts among businesses and a digital skills gap is making lifelong learning increasingly critical. Beyond professional development, learning new skills offers additional rewards from building peer connections to boosting your creativity. That’s why in 2020 Krishna Deepak Nallamilli and I launched KIMO.ai to reimagine how people approach learning, especially in developing markets. Our team is building the artificial intelligence needed to generate individual learning paths through a wide range of quality digital learning content.
Google Cloud and its Startup Program have been instrumental in connecting our team with the tools, people, processes, and best practices to grow our business.
Existing learning platforms lack engagement
Outside of traditional education settings, massive open online learning courses (MOOCs)—often modeled after university courses—can provide a flexible and affordable way to upskill or reskill. But the vast majority of people who participate in MOOC programs fail to complete courses. Based on our research, the challenge with existing learning platforms is a lack of engagement, primarily caused by limited direction on which skills to learn, whether AI, fintech, blockchain, or other in-demand disciplines.
We’ve also received feedback that many corporate learning management systems–developed as online training systems to upskill employees–tend to be poorly designed and time-consuming to use.
Overall, a significant challenge with most existing learning platforms is that they’re generic. For example, suppose you’re interested in learning about AI. In that case, you need AI-related coursework that applies to your industry and the job you want because AI in medicine is vastly different from AI in financial services. Today’s online learning options typically take a one-size-fits-all approach and fail to capture the nuances of what learners really need to get ahead.
Building a future-proof learning platform
The commitment to highly personalized, accessible learning inspired KIMO.ai, a platform that we believe is the future of education. Depending on your goals, current skills, location, and other factors, our AI-based platform will identify which coursework (and where to find those classes) to build the skills you need. The more personalized, relevant learning recommendations even take into account people’s preferences for podcasts, MOOCs, books, articles, videos, courses, publications, and more.
In a mix of cooperation and competition we call “coopetition,” KIMO.ai will regularly recommend courses from other established online learning systems if, based on our automated assessment, it’s the best option for a learner. There’s also the option to access free content only.
Google cultural alignment fosters trust
Our platform started with one developer exploring NLP models and Google APIs. As we’ve grown our team and launched our beta to 110,000 users in developing markets, we discovered there is a lot of interest in our platform, and we believe we can make a significant impact. In feedback forums, we also learned that we need to focus our efforts on the mobile experience to improve engagement since 99% of the beta testers use mobile devices.
Beyond our team’s high level of trust in Google Cloud solutions, our team also appreciates the cultural alignment with Google. We value Google’s developer-centric approach and rely on tools like Dataflow for batch data processing and Cloud TPU to reliably run machine learning models with AI services on Google Cloud. We also build all of our deployments on Google Kubernetes Engine (GKE), which makes it easy to manage all our containerized workloads
On the front end, Google App Engine makes it easy to deploy apps and experiment, and it integrates seamlessly with Firebase for authentication and more. BigQuery is our serverless data warehouse that efficiently scales to support the millions of articles, videos, and other learning resources we need to analyze to provide the targeted coursework recommendations our learners require.
As we grow our business having a network of trusted advisors is also extremely valuable. By working closely with DoIT International, the 2020 Google Cloud Global Reseller Partner of the Year, our team has access to their cloud, Kubernetes, and machine learning expertise. DoIT has already helped us quickly resolve IT issues and create analytics dashboards that give us insights to continually enhance our services.
Building for a growing industry
The dynamic edtech market is growing rapidly and estimated to become an $11B industry by 2025. We’re proud to be part of the next wave of personalized education that has the potential to empower people in developing markets and beyond to grow their skills with coursework tailored to their exact needs and how they like to learn. This year, we will deliver our platform to at least 400,000 more people. We’re excited to see how they use it and where it takes them.
If you want to learn more about how Google Cloud can help your startup, visit our Startup Program application page here to get more information about our program, and sign up for our communications to get a look at our community activities, digital events, special offers, and more.

How The New York Times Increased Speed of Delivery by Using Kubernetes
DOWNLOAD CASE STUDY6163
Of your peers have already downloaded this article
2:40 Minutes
The most insightful time you'll spend today!
When New York Times decided a few years ago to move out of its data centers, its first deployments on the public cloud were smaller and less critical applications that were being managed on virtual machines.
“We started building more and more tools, and at some point, we realized that we were doing a disservice by treating Amazon as another data center,” says Deep Kapadia, Executive Director, Engineering at The New York Times.
Kapadia was tapped to lead a Delivery Engineering Team that would “design for the abstractions that cloud providers offer us.”
The team decided to use Google Cloud Platform and its Kubernetes-as-a-service offering, GKE (Google Kubernetes Engine). Owing to Google Cloud solution and GKE, The New York Times was able to increase the speed of delivery.
Some of the legacy VM-based deployments took 45 minutes; with Kubernetes, that time was “just a few seconds to a couple of minutes,” says Brian Balser, Engineering Manager at The New York Times.
“Teams that used to deploy on weekly schedules or had to coordinate schedules with the infrastructure team, now deploy their updates independently, and can do it daily when necessary,” says Tony Li, Site Reliability Engineer, The New York Times.
Adopting Cloud Native Computing Foundation technologies allowed The New York Times to have a more unified approach to deployment across the engineering staff, and portability for the company.
More Relevant Stories for Your Company
Building a Large-Scale Migration Program with Google Cloud
Many organizations are looking to the public cloud to solve on-premises infrastructure challenges. These range from capacity constraints, aging hardware, or reliability issues; or alternatively, organizations may be looking to capitalize on the value that cloud infrastructure can bring - saving money through automatic scaling, or deriving business value from

Business Value of Google Cloud for SAP Environments
IDC’s research demonstrates the value of running SAP environments on Google Cloud. Customers interviewed by IDC described achieving strong value through improved agility, high performance, and cost and staff efficiencies. The business and operational benefits of running SAP environments on Google Cloud range from lowering downtime to improving productivity to

Customer Search Experience that Takes Advantage of Enterprise Edge Capabilities!
Every year at CES, people from around the world experience the latest and greatest that consumer tech has to offer. In 2021, CES will be in an all-digital format for the first time. So how can a virtual show like CES create immersive experiences for attendees tuning in remotely? That’s

Public Cloud’s Zero Trust Architecture Keeps Enterprise Data Safe
Over the past decade, cybersecurity has posed an increasing risk for organizations. In fact, cyber incidents topped the recent Allianz Risk Barometer for only the second time in the survey’s history. The challenges in combating these risks only continue to grow. Adversaries tend to be agile and are consistently looking
