





How Data Teams in EdTech Firms Make Most of the Educational Data at All Levels

3553
Of your peers have already read this article.
1:30 Minutes
The most insightful time you'll spend today!
Education data can inform strategy, enhance both teaching and learning, and help us better understand customer needs. But that data is only as useful as an organization’s ability to access, analyze, and act upon it. Education Technology (EdTech) companies with a strong data warehouse management policy can help to make the most of educational data at all levels.
Creating a data team
When an EdTech doesn’t have a dedicated data team, databases will likely be poorly maintained and data can be hard to find, it can lack critical security, or fail to meet a customer’s specific requirements. A dedicated data team can prevent this and better support an organization’s data needs. There’s a correlation between the maturity of a data team and the success of an organization’s data utilization. When considering the three primary components of team, outlook, and results, we can better understand an organization’s maturity. By using this matrix from Looker’s Analytical Maturity Playbook, you can assess the maturity of your organization’s data team. Most would agree, the goal is for your operation to move from data chaos to data-driven. But, how can you do that? Think about your data this way: the intelligence you gain from your data is not only an asset…it’s a product. When your data team views your business intelligence as a product—one that’s just as important as the services you offer—they can set the stage for creating a successful data-driven company. Mature data organizations:
- Report functionality regularly
- Constantly assess potential improvements to existing systems
- Manage content rollout to internal employees
Redivis: Making data accessible, connected & secure
Redivis is a platform that connects academic researchers with data and the tools to understand education intelligence. Their customers, who are researchers, expressed how difficult it is to find new datasets for their studies. Once they found a dataset, they often had to access and work with it before they could tell if the information would be useful for their studies. Redivis Data administrators were also concerned about data security. Redivis built their platform on top of Google Cloud’s security infrastructure, making it a highly scalable data processing environment.
Redivis developed a transparent, tiered access system for datasets that allows researchers to request separate access to a dataset’s documentation to determine whether they can use the dataset. Detailed audit logs (supported by Google Cloud Logging) and robust application-level security controls tighten data access. To offer more insights for their researchers, they securely connected their private datasets with public datasets hosted in BigQuery allowing researchers to run queries on billions of records in seconds, not hours.
With a data team in place, it’s time to visualize where to store and organize your data. Data is an asset. You want to invest in collecting, operationalizing, and storing it properly. “Inadequate data aggregation, harmonization, and processing impedes teams from making the right data-driven decisions and pivoting when needed,” according to Jesus Trujillo Gomez, a strategic business executive at Google Cloud. You can determine how mature your warehouse is by using this matrix to help you identify where your organization falls on the spectrum (least mature on the left, most mature on the right). A company’s data warehouse can be assessed in four areas: Technology, Pipeline, Quality, and Performance. Here are some suggested steps to bring your EdTech company one step closer to a data powerhouse.
Classcraft: Using a data-driven approach to make learning fun
Launched in 2014, learning company Classcraft is reimagining the classroom, creating better learning environments with gamification. To support their mission, their team has created a complete data platform that uses data analytics to find new ways to engage students in the classroom. Classcraft became a Google for Education Build Partner to keep up with rising demand. They expanded their footprint to reach 6 million students and educators in 165 countries.
They also migrated to Google Cloud, building on several integrations with Google Workspace for Education, Google Classroom, and Chrome for Education, allowing them to support customers ranging from individual teachers to entire school districts. Classcraft migrated its database and analytics infrastructure to BigQuery and Cloud Storage. “We capture about 10 million new data points every month related to school culture and student performance,” says Chief Technology Officer and VP of Product Stéphane Guillemette. “With BigQuery and other Google Cloud tools, we can quickly deliver valuable insights to educators.”
Vodafone Leverages Google Cloud to Aid COVID-19 Frontline with Anonymized Insights on Population Mobility

11213
Of your peers have already read this article.
1:30 Minutes
The most insightful time you'll spend today!
Editor’s note: When Europe’s largest mobile communications company, Vodafone, was asked by the European Commission to help understand population movement across the European Union and the UK to help fight COVID-19, it was able to provide anonymized mobile network-based insights to answer the call. Here’s how Vodafone, with the support of Google Cloud, rapidly mobilized the COVID-19 frontline, while respecting its customers’ privacy.
With the emergence of COVID-19 in early 2020, the European Commission—the executive branch of the European Union (EU)—knew that technology would be instrumental in its fight to control the pandemic. With various lockdowns imposed across its member states, the Commission was keen to predict and prevent the spread of COVID-19 and to manage the related social, political and financial impacts.
Mobile network data helps track COVID-19 across the EU
Mobile networks produce location data, which can be turned into useful anonymous insights to understand population movement within a geographic area. The European Commission, working with mobile industry association GSMA (Groupe Speciale Mobile Association), asked Europe’s major mobile phone operators for help in producing insights to support the fight against COVID-19. As the largest mobile network operator within the EU, Vodafone saw this as a critical opportunity to participate.
Vodafone had previous experience of using mobile network data to support pandemic research. For example, in 2019, Vodafone provided mobility pattern analysis to help track the spread of Malaria in Mozambique. And, during the early stages of the COVID-19 pandemic (prior to working with the European Commission), Vodafone assisted the Italian and Spanish governments in understanding their citizens’ mobility patterns. Vodafone had also previously offered anonymized and aggregated population mobility insights to support public transport and tourism authorities and retail organizations in a number of countries. Consequently, Vodafone was perfectly placed to play a greater role in supporting the European Commission’s response to the pandemic.
When asked to assist the European Commission, Vodafone first considered how it could safely share its data with the governing body without providing details on the individual movements of its customers. It realized it could achieve this through an elaborate set of anonymization and aggregation techniques. Insights are aggregated from a minimum of 50 users and Vodafone only shared these anonymous insights and never the actual raw data with the Commission. As specified by the EU, these insights are then presented onto a large geographical region, typically a city or a county with thousands of people living in that area.
These insights illustrate how people move, helping to determine how lockdowns and self-isolation measures were impacting behaviors.
Using Google Cloud to collate and store population mobility data
In April 2020, Vodafone began migrating its operations, including its mobile data, to Google Cloud on servers in Europe and the UK with elaborate security safeguards, including encryption, building on a previous partnership.
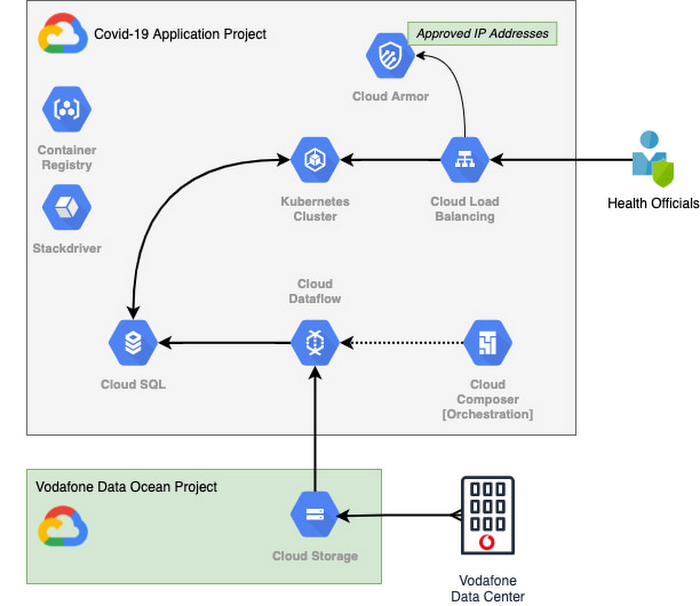
With the data residing in EU and UK data centers and not the United States, Vodafone could then retrieve anonymous insights from Google Cloud Storage instantaneously. Before supplying any information to the European Commission, however, Vodafone used Dataflow to validate the data and run a series of tests to ensure the database had accurate data, before ingesting and archiving the relevant metrics. For instant access, the data was then made available to the European Commission using a Redis database on Google Kubernetes Engine.
To ensure aggregate Vodafone customer data was always safe, secure, and anonymous, all entry points to the front-end were protected behind Google Cloud Armor, where only specific IP addresses were allowed. Using these tools, seamless data pipelines fed in predefined key performance indicators from each specified European market. While data quality measures ensured the definitions for metrics across markets were consistent and could be accurately compared.
The architecture (pictured below) shows how Vodafone integrated and anonymized its data on Google Cloud.
Live interactive dashboard shows population mobility in real-time
With its data integrated on Google Cloud, Vodafone created a live, interactive dashboard to track mobility patterns and share relevant information with the European Commission in real-time.
The European Commission Joint Research Center (JRC) was able to gather valuable information from these insights, which enabled them to see where population mobility was aiding the spread of the disease, when cross-referenced with health data. It could also assess the implications of lockdowns on different populations and forecast cross-country spreading.
Mobile data aids disease modeling for multiple stakeholders
The Vodafone data became instrumental in modeling the likely course of the disease too. For example, the University of Southampton in the UK used it to predict the outcome of different coordinated COVID-19 exit strategies across Europe. This research was published in Science Magazine in September 2020.
The Vodafone data dashboard continues to be used by individual governments, NGOs and organizations to further investigate the impacts of the pandemic and to measure the effectiveness of response strategies alongside the rollout of vaccination programs. The project also helped Vodafone win a DataIQ award for most effective stakeholder engagement.
Using the learnings from this project, Vodafone has been able to adapt its own B2B solution, called Vodafone Analytics, by adaptIng and migrating the code to work in Google Cloud Platform. This solution has been rolled out across Germany, Greece, Portugal and South Africa, and new countries are being onboarded every day. Vodafone Analytics already has more than 100 customers leveraging it for a variety of use cases—Italian fashion retailer OVS, uses it for its smart retail operation, while global real estate company, JLL, uses it to understand the footfall passing through its properties.
Working together, Vodafone and Google Cloud continue to help a range of organizations, governments, and NGOs navigate through the ongoing pandemic, optimize their operations, and help the greater good, without infringing individuals’ fundamental rights to privacy.
To learn more about Google Cloud and Vodafone, watch our full interview here.
Dataplex Data Lineage: Leverage the Complete Data Story for Better Business Decisions

1465
Of your peers have already read this article.
3:30 Minutes
The most insightful time you'll spend today!
Today, we are excited to announce the general availability of Dataplex data lineage — a fully managed Dataplex capability that helps you understand how data is sourced and transformed within the organization. Dataplex data lineage automatically tracks data movement across BigQuery, BigLake, Cloud Data Fusion (Preview), and Cloud Composer (Preview), eliminating operational hassles around manual curation of lineage metadata.
With rising data volume spread across data silos, it can be challenging for organizations to ensure users have a self-service mechanism to discover, understand and trust the data. Organizations constantly struggle with questions such as:
- Is the data extracted from an authoritative source?
- What is the impact if I drop this table?
- The data in this table seems corrupted – where did this data come from, and when was it last refreshed?
- How is sensitive information being moved or copied? Is it in adherence to data governance practices?
To answer the above questions, organizations need to track how data is sourced and transformed, which can be complex and requires significant effort.
Dataplex data lineage describes each lineage relationship by detailing what happened and when it happened in an interactable lineage graph, providing data observability.
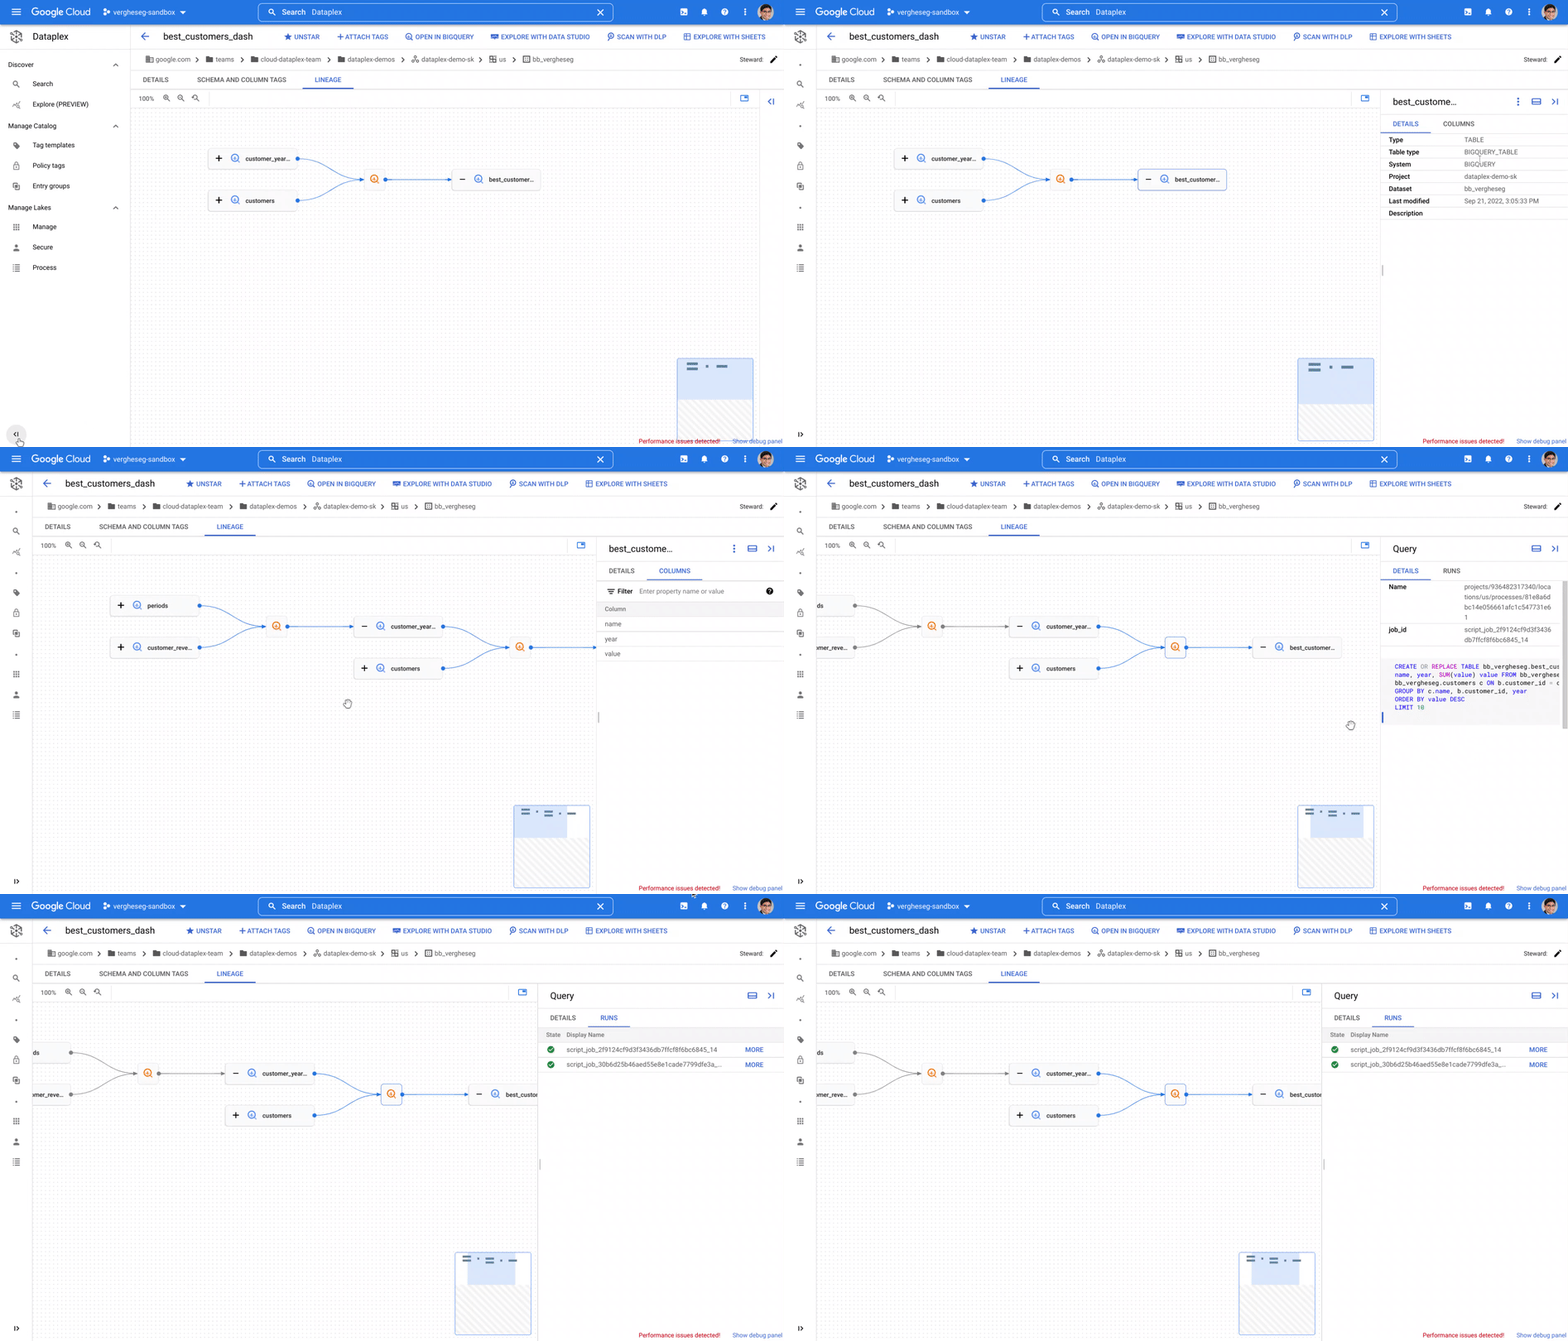
Data analysts who want to know if a table originates from an authoritative source can now answer this in a self-service manner with a simple look-up of lineage for the concerned table — available in Dataplex and in BigQuery for in-context analysis.
Data engineers can reduce time to identify and resolve data issues through root cause analysis using the operational metadata trace asserting a lineage relationship. Data lineage also aids deterministic change management by providing the ability to evaluate the impact of a change and collaborate with the corresponding stakeholders to minimize any adverse impact.
Finally, data lineage provides a map of data movement which can become the foundation for data governance practice. It enables data stewards and owners to evaluate and enforce adherence to governance requirements, especially when tracking the movement of sensitive information.
Dataplex data lineage provides APIs for extensibility so that organizations can report lineage from various systems and have a single map of how data entries are related.
What our customers are saying
L’Oréal, the world’s largest cosmetics company, is on a mission to ‘create the beauty that moves the world.’ “Dataplex data lineage helps us understand how data moves across our organization,” said Sébastien Morand, Head of Data Engineering team, L’Oréal. “As a fully managed solution, it becomes the main entry point to diagnose data issues and evaluate the impact of a change or incident — providing insight on what happened and when it happened, including reference to the execution metadata. Directly integrated into our beauty tech data platform, data lineage helps us reduce data issues and also enables us to mitigate issues faster when it does happen.”
“At Wayfair, we treat data-as-a-product and are building a robust data platform that provides self-service access and compliance constructs,” said Vinit Rajopadhye, Associate Director on Data Infrastructure & Data Enablement at Wayfair. “We are excited about Dataplex data lineage as it helps our data consumers trust data based on where it originates and the transformations applied.”
Hurb is an online travel agency in Brazil with a mission to optimize travel through technology. “Hurb has a rapidly growing data platform, with new data assets created and registered daily to support business decision-making and Machine Learning models,” said Vinícius dos Santos Mello, Senior Data Engineer. “Thanks to Dataplex data lineage features, we have end-to-end data observability across data in BigQuery. We can proactively address schema changes, data quality issues, and asset depreciation that could otherwise negatively affect the business.”
“As a company with many business domains and services, we handle a large volume of data and use it to power our decision making, so it is crucial to ensure data quality. Dataplex data lineage provides a visual understanding of the flow of data across our organization, improving efficiency of impact investigations when problems occur and increasing the reliability of the data.” said Mitsunori Fukase, Data Platform Department Group Manager, DeNA.
Get started with Dataplex data lineage
You can get started with Dataplex data lineage by enabling the Data Lineage API on your project. You can learn more here.
Additional Resources:
What Drives Your Organization to be Data-driven?

4904
Of your peers have already read this article.
4:00 Minutes
The most insightful time you'll spend today!
Every organization has its own unique data culture and capabilities. Yet each is expected to use technology trends and solutions in the same way as everyone else. Your organization may be built on years of legacy applications, you may have developed a considerable amount of expertise and knowledge, yet you may be asked to adopt a new approach based on a technology trend. On the other hand, you may be on the other side of the spectrum, a digitally native organization built with engineering principles from scratch without legacy systems but expected to follow the same principles as process driven, established organizations. The question is, should we treat these organizations in the same way when it comes to data processing? In this series of blogs and papers this is what we are exploring: how to set up an organization from the first principles from data analyst, data engineering and data science point of view. In reality, there is no such organization that is solely driven by one of these but it is likely to be a combination of multiple types. What type of organization you become is then driven by how much you are influenced by each of these principles.
When you are considering what data processing technology encompasses, take a step back and make a strategic decision based on your key goals. This can be whether you optimize for performance, cost, reduction in operational overhead, increase in operational excellence, integration of new analytical and machine learning approaches. Or perhaps you’re looking to leverage existing employees’ skills while meeting all your data governance and regulatory requirements. We will be exploring these different themes and will focus on how they guide your decision-making process. You may be coming from technologies which are solving some of the past problems and some of the terminologies may be more familiar, however they don’t scale your capabilities. There is also the opportunity cost of prioritizing legacy and new issues that arise from a transformation effort, and as a result your new initiative can set you further behind on your core business while you play catch up to an ever changing technology landscape.
Data value chain
The key for any ingestion and transformation tool is to extract data from a source and start acting on it. The ultimate goal is to reduce the complexity and increase the timeliness of the data. Without data, it is impossible to create a data driven organization and act on the insights. As a result, data needs to be transformed, enriched, joined with other data sources, and aggregated to make better decisions. In other words, insights on good timely data mean good decisions.
While deciding on the data ingestion pipeline, one of the best approaches is to look into the volume of data, the velocity of the data, and type of data that is arriving. Other considerations include the number of different data sources you are managing, whether you need to scale to thousands of sources using generic pipelines, whether you want to create one generic pipeline but then apply data quality rules and governance. ETL tools are ideal for this use case as generic pipelines can be written and then parameterized.
On the other hand, consider the data source. Can the data be directly ingested without transforming and formatting the data? If the data does not need to be transformed and can be ingested directly into the data warehouse as a managed solution. This not only reduces the operational costs but also allows for more timely data delivery. If the data is coming in through an unstructured format such as XML or in a format such as EBCDIC and needs to be transformed and formatted, then a tool with ETL Capabilities can be used depending on the speed of the data arrival.
It is also important to understand the speed and time of arrival of the data. Think about your SLAs and time durations/windows that are relevant for your data ingestion plans. This would not only drive the ingestion profiles but would also dictate which framework to use. As discussed above, velocity requirements would drive the decision-making process.
Type of Organization
Different organizations can be successful by employing different strategies based on the talent that they have. Just like in sports, each team plays with a different strategy with the ultimate goal of winning.
Organizations often need to decide on what’s the best strategy to take in respect to data ingestion and processing – whether you need to hire an expensive group of data engineers, or exploit your data wizards and analysts to enrich and transform data that can be acted on, or whether it would be more realistic to train the current workforce to do more functional/high value work rather than to focus on building generally understood and available foundational pieces.
On the other hand, the transformation part of ETL pipelines as we know it, dictates where the load will be. All of these are made a reality in the cloud native world where data can be enriched, aggregated, and joined. Loading data into a powerful and modern data warehouse means that you can already join and enrich the data using ELT. Consequently, ETL isn’t really needed in its strict terms anymore if the data can be loaded directly into the data warehouse.
All of the above was not possible in the traditional, siloed, and static data warehouses and data ecosystems whereby systems would not talk to each other or there were capacity constraints in respect to both storing and processing the data in the expensive Data Warehouse. This is no longer the case in the BigQuery world as storage is now cheap and transformations are now much more capable without constraints of virtual appliances.
If your organization is already heavily invested into an ETL tool, one option is to use them to load BigQuery and transform the data initially within the ETL tool. Once the as-is and to-be are verified to be matching, then with the improved knowledge and expertise one can start moving workloads into BigQuery SQL, and effectively do ELT.
Furthermore, if your organization is coming from a more traditional data warehouse that extensively relies on stored procedures and scripting, then the question that one may ask is, do I continue leveraging these skills and expertise and use these capabilities that are also provided in BigQuery? ELT with BigQuery is more natural, similar to what’s already in Teradata BTEQ, Oracle PL/SQL but migrating from ETL to ELT requires changes. This change then enables exploiting streaming use cases, such as real-time use cases in retail. This is because there is no preceding step before data is loaded and made available.
Organizations can be broadly classified under 3 types as Data Analyst Driven, Data Engineering driven, and Blended organization. We will be covering a Data Science driven organization within the Blended category.
Data Analyst Driven
Analysts understand the business and are used to using SQL/spreadsheets. Allowing them to do advanced analytics through interfaces that they are accustomed to enables scaling. As a result, easy to use ETL tooling to bring data quickly into the target system becomes a key driver. Ingesting data directly from a source or staging area then also becomes critical as it allows analysts to exploit their key skills using ELT and increases timeliness of the data. This is commonplace with traditional EDWs and realized by extended capabilities of using Stored Procedures and Scripting. Data is enriched, transformed, and cleansed using SQL and ETL tools act as the orchestration tools.
The capabilities brought by cloud computing on separation of data and computation changes the face of the EDW as well. Rather than creating complex ingestion pipelines, the role of the ingestion becomes, bringing data close to the cloud, staging on a storage bucket or on a messaging system before being ingested into the cloud EDW. This then releases data analysts to focus on looking into data insights using tools and interfaces that they are accustomed to.
Data Engineering / Data Science Driven
Building complex data engineering pipelines is expensive but enables increased capabilities. This allows creating repeatable processes and scaling the number of sources. Once complemented with cloud it enables agile data processing methodologies. On the other hand, data science organizations allow carrying out experiments and producing applications that work for specific use cases but are not often productionised or generalized.
Real-time analytics enables immediate responses and there are specific use cases where low latency anomaly detection applications are required to run. In other words, business requirements would be such that it has to be acted upon as the data arrives on the fly. Processing this type of data or application requires transformation done outside of the target.
All the above usually requires custom applications or state-of-the-art tooling which is achieved by organizations that excel with their engineering capabilities. In reality, there are very few organizations that can be truly engineering organizations. Many fall into what we call here as the blended organization.
Blended org
The above classification can be used on tool selection for each project. For example, rather than choosing a single tool, choose the right tool for the right workload, because this would reduce operational cost, license cost and use the best of the tools available. Let the deciding factor be driven by business requirements: each business unit or team would know the applications they need to connect with to get valuable business insights. This coupled with the data maturity of the organization would be the key to making sure the right data processing tool would be the right fit.
In reality, you are likely to be somewhere on a spectrum. Digital native organizations are likely to be closer to being engineering driven, due to their culture and business that they are in. However, brick and mortar organizations would be closer to being analyst driven due to the significant number of legacy systems and processes they possess. These organizations are either considering or working toward digital transformation with an aspiration of having a data engineering / software engineering culture like Google.
The blended organization with strong skills around data engineering, would have built the platform and built frameworks, to increase reusable patterns would increase productivity and then reduce costs. Data engineers focus on running Spark on Kubernetes whereas infrastructure engineers focus on container work. This in turn provides unparalleled capabilities as application developers focus on the data pipelines and even the underlying technologies or platforms changes code stays the same. As a result, security issues, latency requirements, cost demands and portability are addressed at multiple layers.
Conclusion – What type of organization are you?
Often an organization’s infrastructure is not flexible enough to react to a fast changing technological landscape. Whether you are part of an organization which is engineering driven or analyst driven, organizations frequently look at technical requirements that inform which architecture to implement. But a key, and frequently overlooked, component needed to truly become a data-driven organization is the impact of the architecture on your data users. When you take into account the responsibilities, skill sets, and trust of your data users, you can create the right data platform to meet the needs of your IT department as well as your business.
To become a truly data-driven organization, the first step is to design and implement an analytics data platform that meets your technical and business needs. The reality is that each organization is different and has a different culture, different skills, and capabilities. Key is to leverage its strengths to stay competitive while adopting new technologies when it is needed and as it fits to your organization.
To learn more about the elements of how to build an analytics data platform depending on the organization you are, read our paper here.
3355
Of your peers have already watched this video.
28:03 Minutes
The most insightful time you'll spend today!
Crux Accelerates Data Operations with Google BigQuery
Being in the constantly evolving and changing data business, Crux Informatics has integrated with Google Cloud and BigQuery to achieve the benefits of a data cloud, including fully managed global scale, load management, high performance, and genuinely good support.
Watch this video to learn more about how this partnership will help Crux get success with BigQuery.
How Pantheon Improved Performance and Reliability by Moving to Google Cloud

5592
Of your peers have already read this article.
1:30 Minutes
The most insightful time you'll spend today!
Google Cloud Results
- Improves performance and reliability, enabling Pantheon to serve larger customers
- Supports 99.95% uptime across 200,000+ websites
- Reduces cloud infrastructure costs by 40%
- Enables future analytics offerings based on machine learning and big data analytics
Nearly every business needs a web presence—but the vast majority of companies don’t want to be involved in the technical aspects of coding, deployment, hosting, security, and scaling websites. To stay focused on the business value and creative aspects of their websites and avoid managing infrastructure, thousands of companies turn to Pantheon, a website operations and hosting platform that powers over 200,000 websites.
Pantheon promises its customers speed, reliability, and scalability plus world-class collaboration and workflow tools. For five years, the company was able to deliver high service levels in all three areas running its platform on bare-metal virtual cloud servers. However, as its business grew, network links began to saturate under heavy load, risking instability. As Pantheon’s business evolved to focus on servicing some of the largest websites in the world, the company wanted to partner with a more innovative cloud services provider.
“We wanted a partner that could give us what we offer to our own customers: the flexibility to scale smoothly and consume services without building them from scratch,” says David Strauss, CTO, Pantheon. “It was time to move beyond custom containers on managed VMs and extend our cloud strategy to include next-generation technologies for container management and analytics.”
Pantheon evaluated several leading cloud providers and determined that Google Cloud Platform would be the best fit for its business and customers. Engineering had the final say, running a battery of functionality and performance tests at the storage, database, and web server layers.
“In every test our engineers did, Google Cloud Platform came in as better, faster, and more cost effective than the competition,” says Niall Hayes, COO, Pantheon. “We compared MariaDB to Google Cloud SQL and Cassandra to Google Bigtable, and container density improved from 250 to 400 containers per server.”
Migrating 200,000+ sites in 2 weeks
Pantheon wanted to make the transition transparent to its customers, so a fast and smooth migration to Google Cloud Platform was essential. With help from Google, Pantheon completed the migration quickly and moved 500TB of databases, code, and files with zero customer impact.
“We migrated over 200,000 websites to Google Cloud Platform in 2 weeks, including 50,000 that are heavily trafficked and actively developed, and nobody noticed,” says Josh Koenig, Co-founder and Head of Products at Pantheon. “The speed was incredible. There was no downtime, and we filed no additional support tickets with Google during the entire process.”
The platform for platforms
For its content management system runtime environment, Pantheon runs its own homegrown container management technology on Google Compute Engine. To automate scaling for other core services such as its routing layer and distributed file system, it uses Google Kubernetes Engine for cluster management and orchestration.
“Google is the clear leader in Kubernetes and container management, which aligns very well with our open source values and our vision for the future,” says Niall. “With Google Kubernetes Engine we get better resource efficiency, and automated operations and autoscaling take a lot of administration off our plate.”
In addition to smooth scaling, Pantheon and its customers benefit from improved performance and reliability thanks to the high-quality private network offered by Google.
Further, the Google partnership with Fastly enables direct connectivity to Google Cloud Platform to improve performance for edge caching. As a result of these improvements, Pantheon raised its availability service level agreement (SLA) from 99.9% to 99.95% and can now take on even larger customers.
“Google’s network topology, both locally and globally, performs better and more reliably than competing solutions, making Google Cloud Platform the best choice for us and for our customers,” says David. “Google beats any other cloud provider as the best platform-for-platforms.”
Adds Josh: “Google has unbelievable technology around persistence and replication between zones and regions, and that is not something we could find anywhere else. This allows us to offer advanced disaster recovery and failover services to our customers.”
Strengthening customer relationships
Pantheon uses Google BigQuery, a fully managed, cloud-based data warehouse, to integrate with Fastly and analyze website traffic on behalf of its customers. Previously, Pantheon was unable to ingest edge data quickly enough from Fastly, limiting its ability to identify issues and provide the best customer service. Today, Fastly streams logs in real time into Google BigQuery for analysis, giving Pantheon a wealth of insights.
“We use Google BigQuery to identify customers that have outgrown their infrastructure or need to right-size for business growth,” says David. “We can have proactive conversations and add a lot of value to the relationships. Soon, we plan to make Google BigQuery available to our customers so they can better understand their own traffic.”
Adds Niall: “Google Cloud Platform is more data-oriented than other cloud providers, making it a better match for our needs and our customers’ strategic initiatives.”
Integrated, granular security
Pantheon appreciates that Google Cloud services are built for public cloud, with granular security as a core design and development requirement. Employees simply use their G Suite credentials to gain access to Google Cloud Platform infrastructure and services.
“We’ve been a G Suite shop for years because of the paperless collaboration benefits,” says Josh. “G Suite connects our distributed company, and it was very natural to use those same logins for Google Cloud Platform.”
Staying competitive and productive
Moving to Google Cloud Platform opens up new possibilities for services Pantheon can offer to customers in the future, including machine learning and big data analytics, to give them a more complete view of how digital experiences are driving their businesses. Internally, engineers can move faster, do more effective capacity planning, and provide better service as Pantheon moves its products upmarket.
Pantheon expected to save 20% on cloud infrastructure costs by moving to Google Cloud Platform, but was able to double that savings with resource optimization and managed services.
“Since moving to Google Cloud Platform, our platform is more secure, reliable, and scalable than ever. We reduced our cloud infrastructure costs by 40%, and our customers’ sites run 45% faster than industry benchmarks,” says Niall. “Our engineers are Google fans for a reason—they’re happier, more efficient, and more productive on Google Cloud Platform.”
More Relevant Stories for Your Company

A Recap on Google Cloud Databases and Storage Options- Part 2
Isaac Newton said, “If I have seen farther than others it is because I have stood on the shoulders of giants.” He meant that in order to explain the Law of Gravity, he used the work of major thinkers who came before him in order to make intellectual progress (as-in

HSBC Overcomes Capacity Challenges and Innovation-Blocks With Google BigQuery
At HSBC, we serve 39 million customers, in-person and online, from consumers to businesses, in 66 countries. We maintain data centers in 21 countries, with more than 94,000 servers. With an on-premises infrastructure supporting our business, we kept running into capacity challenges, which really became an innovation blocker and ultimately




Skincare Firm Scales 4X in Minutes with SAP on Google Cloud
As the number one skincare brand in the United States, Rodan + Fields must support its team of over 300,000 of independent contractors as well as work to ensure a really personalized experience for customers. To keep pace with the company’s growth, Rodan + Fields realized it needed a more

Harnessing the Power of Data and AI to Transform Life Science Supply Chains
Global life science supply chains are lengthy and complex with many moving parts. One small disruption can create serious delays and affect your ability to deliver therapeutics for patients. Supply chain disruptors Over the last few years, healthcare organizations have encountered a range of obstacles, from both internal and external
