





How Constellation Brands’ Direct-to-Customer Tech Delivers Economic Impact across Business Portfolio

6298
Of your peers have already read this article.
3:00 Minutes
The most insightful time you'll spend today!
Editor’s note: Today we’re hearing from Ryan Mason, Director, Head of DTC Growth & Strategy, at alcoholic beverage firm, Constellation Brands on the company’s shift to Direct-to-Consumer (DTC) sales and how Google Cloud’s powerful technology stack helped with this transformation.
It’s no secret that consumer businesses have been up-ended in a lasting manner after 18 months of the pandemic. Consumers have been forced to shop differently over the past year – and as a result, they’ve evolved to be more comfortable with online spending and have grown to expect a certain level of convenience. While the e-commerce share of consumer sales has grown steadily over the past decade, the pandemic was the catalyst for the famous “10 years of growth in 3 months” which many argue is here to stay.
Facing this reality head-on, we placed a new emphasis on Direct-to-Consumer (DTC) with our acquisition of Empathy Wines, a DTC-native wine brand that sells directly to consumers via e-commerce. To accelerate our innovation in the DTC space, we added headcount and new functions to the existing Empathy team and empowered the newly-minted DTC group to apply their digital commerce operating model across the rest of the wine and spirits portfolio, which includes Robert Mondavi Winery, Meiomi Wines, The Prisoner Wine Company, High West Whiskey, and more.
One pandemic and one year later, DTC sales have surged in the wine and spirits category with Constellation positioned as a leader armed with a unique and powerful cloud technology stack, best-in-class e-commerce user experiences, modernized fulfillment solutions, and data-driven growth marketing.
Benefits of Going DTC
A report from McKinsey estimates that the strategic business shift to DTC has been accelerated by two years because of the pandemic and argues that consumer brands that want to thrive will need to aim for a 20% DTC business or higher, which is already taking shape in the market: Nike’s direct digital channels are on track to make up 21.5% of the total business by the end of 2021, up from 15.5% in the last fiscal year, and Adidas is aiming for 50% DTC by 2025. But outside of the clear revenue upside, the auxiliary benefits of going DTC are robust.
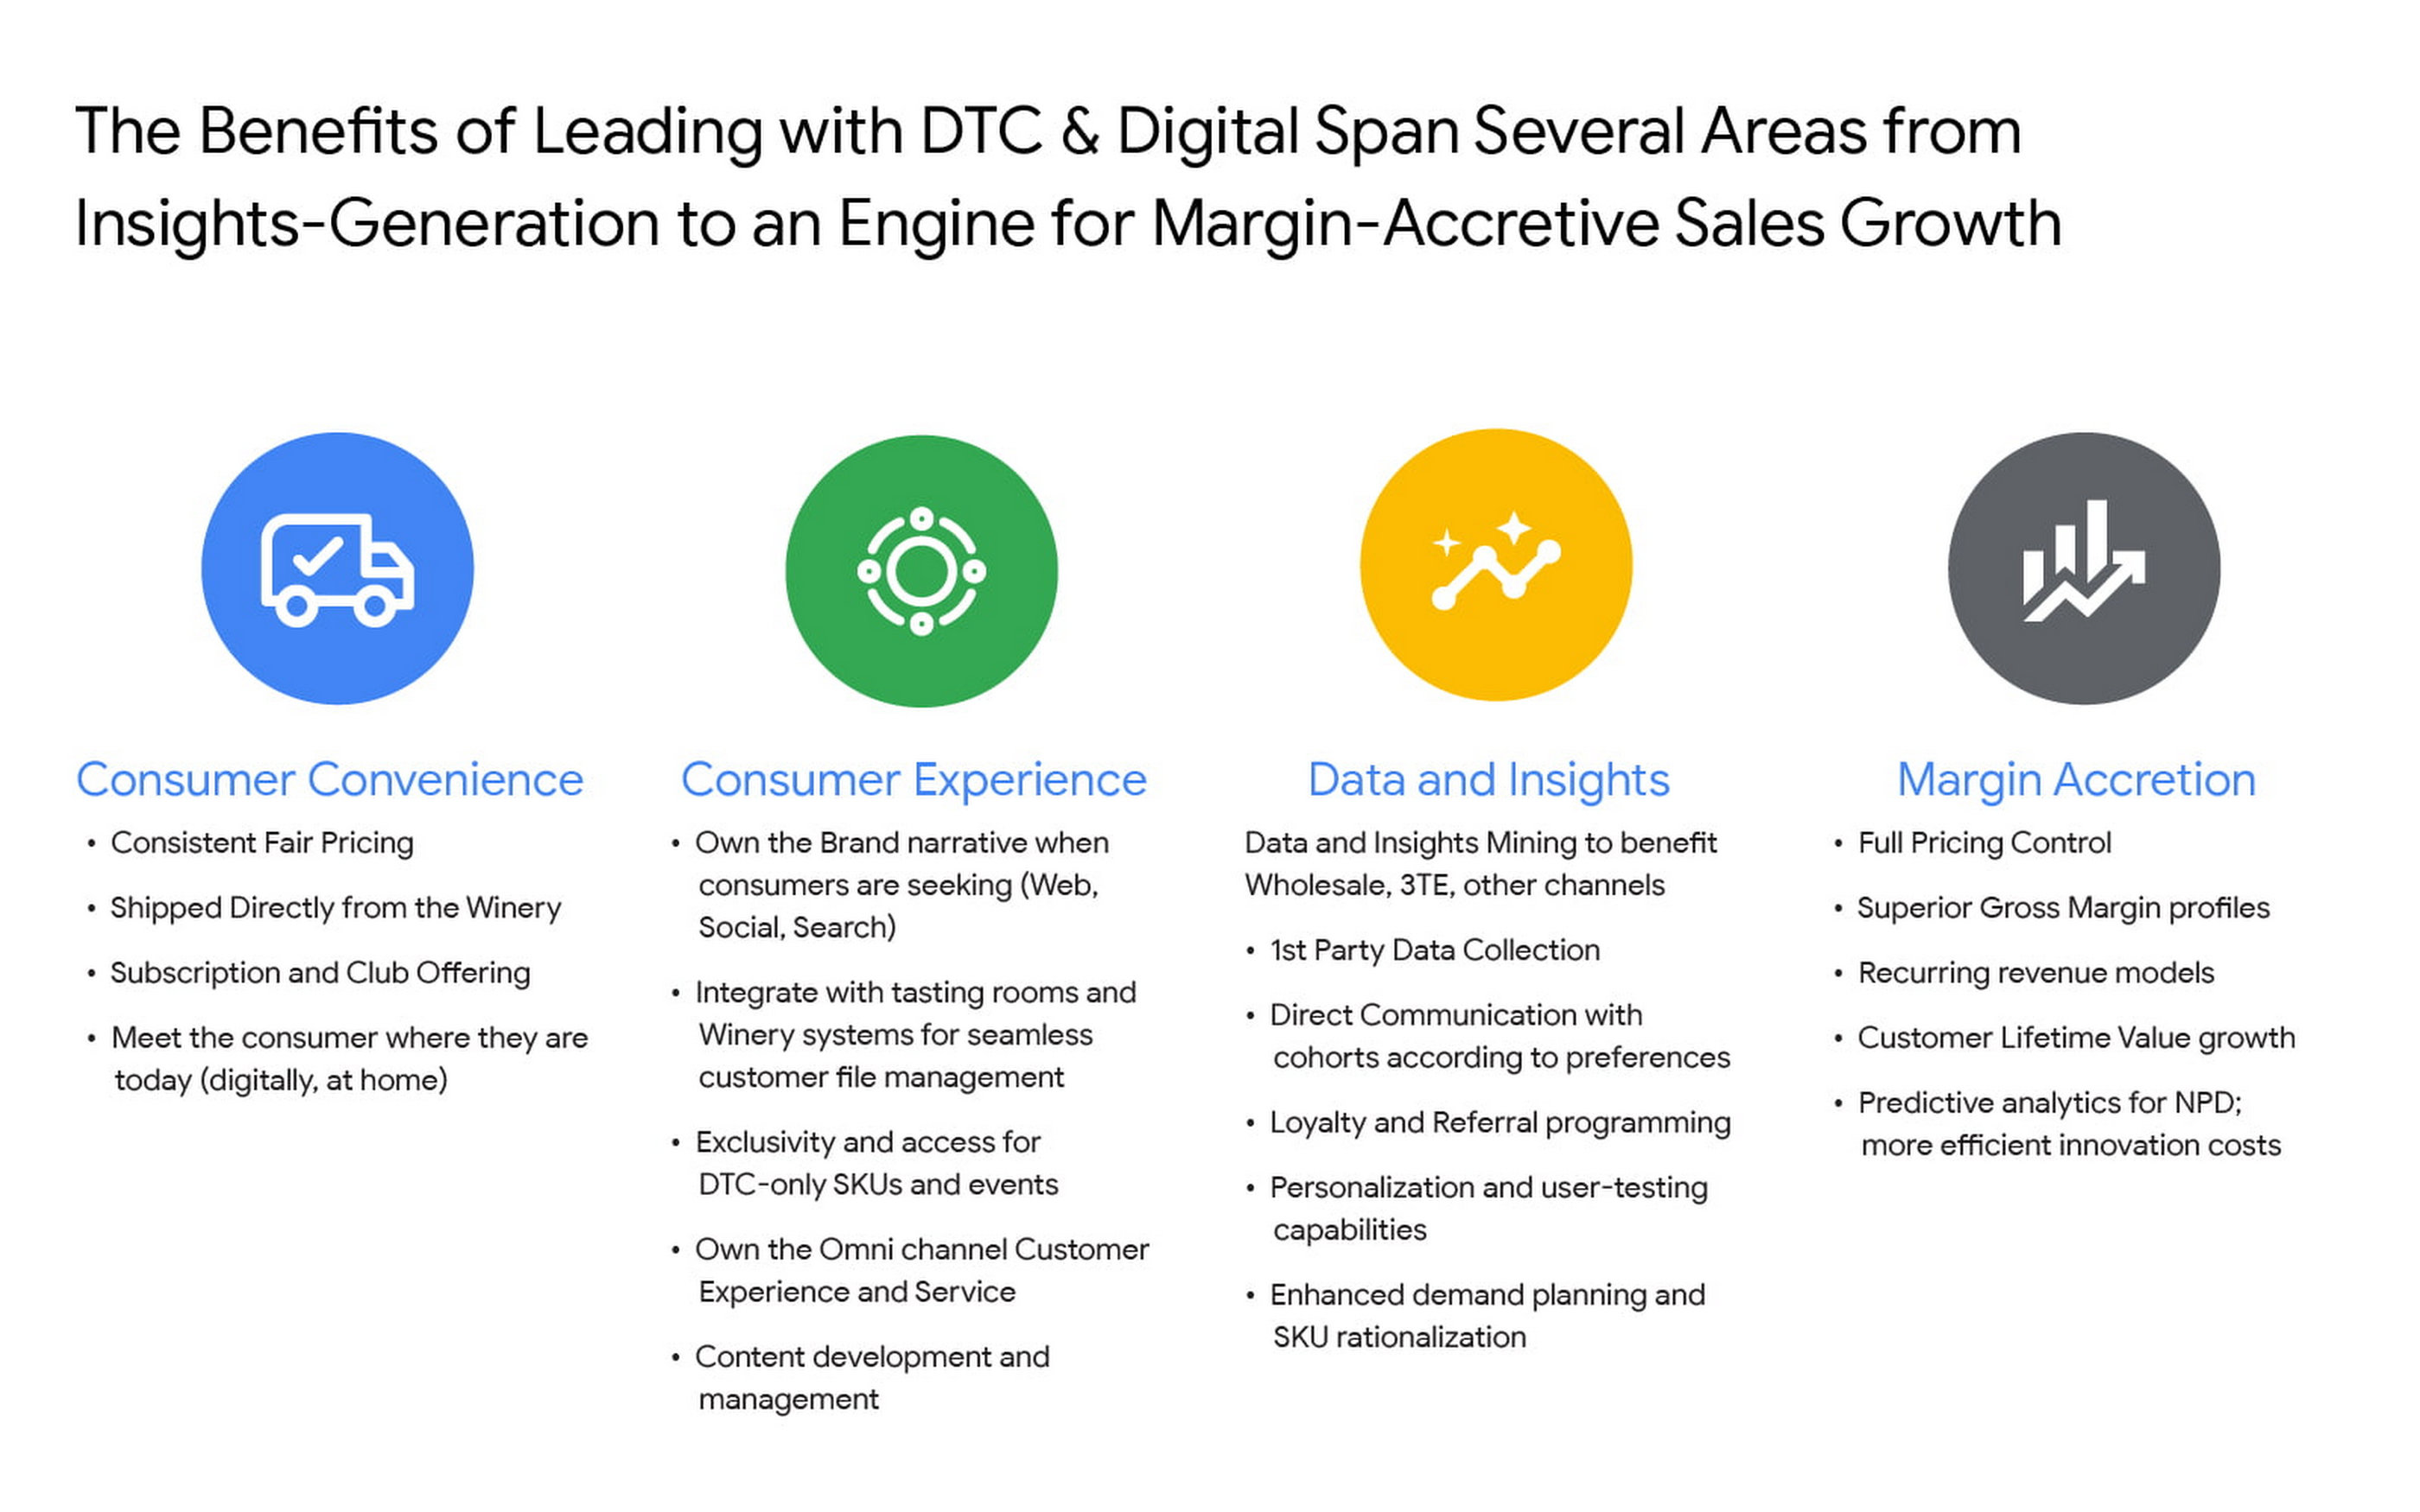
For Constellation Brands, each of these four pillars ring true, and our shift toward DTC is as much about margin accretion and revenue mix management as it is about consumer insights and data. The added complexities of the alcohol space add wrinkles to our DTC approach and manifest in many areas like consumer shopping preference, shipping and logistics hurdles, and more. In order to win share early and continue to lead the category, we recognized the need to harness the immense amount of first-party data to power impactful and actionable insights.
Our DTC technology architecture has fostered a value chain that is completely digitized: website traffic, marketing expenditures, tasting room transactions, e-commerce transactions, logistics and fulfillment events, cost of goods sold (COGS) and margin profiles, etc. are recorded and stored in a data warehouse in real time. For the first time, at any given moment, we can easily and deterministically answer complex business questions like “what is the age and gender distribution of my customers from Los Angeles who have purchased SKU X from Brand.com Y in the last 6 months? What is the cohort net promoter score? Did that increase after we introduced same-day shipping in this zip code? By how much?”
The ability to answer these questions and understand the root causes allows us to stay nimble with product offerings and iterate marketing strategies at the speed of consumer preference. Further, it enables us to optimize our omnichannel presence in the same manner by leaning on DTC consumer insights to develop valuable strategies with key wholesale distribution partners and 3-Tier eCommerce partners like Drizly and Instacart. At its core, Constellation’s DTC practice is designed to be the consumer-centric “tip-of-the-spear” responsible for generating insights from which all sales channels, including wholesale, can benefit.
Constellation’s DTC technology approach prioritizes consumer-centricity and insights generation
We have taken a modern approach to building a digital commerce technology stack, leveraging a hub-and-spoke model built around Shopify Plus and other key emergent technology providers like email provider Klaviyo, loyalty platform Yotpo, Net Promoter Score measurer Delighted, Customer Service module Gorgias, payments processor Stripe, event reservations platform Tock, and many more. For digital marketing and analytics, we use Google Cloud and Google Marketing Platform, which includes products like Analytics 360, Tag Manager 360, and Search Ads 360.
To help gather, organize, and store all of the inbound data from the ecosystem, we partnered with SoundCommerce, a data processing platform for eCommerce businesses. Together with SoundCommerce, we are able to automate data ingestion from all endpoints into a central data warehouse in Google BigQuery. With BigQuery, our data team is able to break data silos and quickly analyze large volumes of data that help unlock actionable insights about our business. BigQuery itself allows for out-of-the-box predictive analytics using SQL via BigQuery ML, and a key differentiator for us is that all Google Marketing Platform data is natively accessible for analysis within BigQuery.
But data possession only addresses half of the opportunity: we needed a powerful and modern business intelligence platform to help make sense of the vast amounts of data flowing into the system. Core to the search was to find a partner that approached BI in a way that fit with our future-looking strategy.
Our DTC team relies on the accurate measurement of variable metrics like Customer Acquisition Cost (CAC), Customer Lifetime Value (CLV), Churn, and Net Promoter Score (NPS) as a bellwether of the health of the business and monitoring these figures on a daily basis is paramount to success. To enable us to keep an accurate pulse on strategic KPIs, we considered several incumbent BI platforms. Ultimately we selected Google Cloud’s Looker for a range of benefits that separated it from the rest of the pack.

From a vision perspective, in this particular case we felt Looker was most aligned with our belief that better decisions are made when everyone has access to accurate, up-to-date information. Looker allows us to realize that vision by surfacing data in a simple web-based interface that empowers everyone to take action with real-time data on critical commercial activities. Furthermore, Looker’s ability to automate and distribute formatted modules to a myriad of stakeholders on a regular cadence increases data literacy and business performance transparency.
From a product perspective, we chose Looker for it’s cloud offering, web-based interface, and centralized, agile modeling layer that creates a trusted environment for all users to confidently interact with data — without any actual data extraction. While other BI tools have centralized semantic layers that require skilled IT resources, we’ve experienced that those can lead to bottlenecks and limited agility. With Looker’s semantic layer, LookML, our BI Team, led by Peter Donald, can easily build upon their SQL knowledge to add both a high degree of control as well as flexibility to our data model. The fully browser-based development environment allows the data team to rapidly develop, test, and deploy code and is backed by robust and seamless Git source code management.
In parallel, LookML empowers business users to collaborate without the need for advanced SQL knowledge. Our data team curates interactive data experiences with Looker to help scale access and adoption. Business users can explore ad hoc analysis, create dashboards, and develop custom data experiences in the web-based environment to get the answers they need without relying on IT resources each time they have a new question, while also maintaining the confidence that the underlying data will always be accurate. This helps us meet our primary goal of providing all businesses users with the data access they need to monitor the pulse of key metrics in near real-time.
Impact and future of DTC BI at Constellation
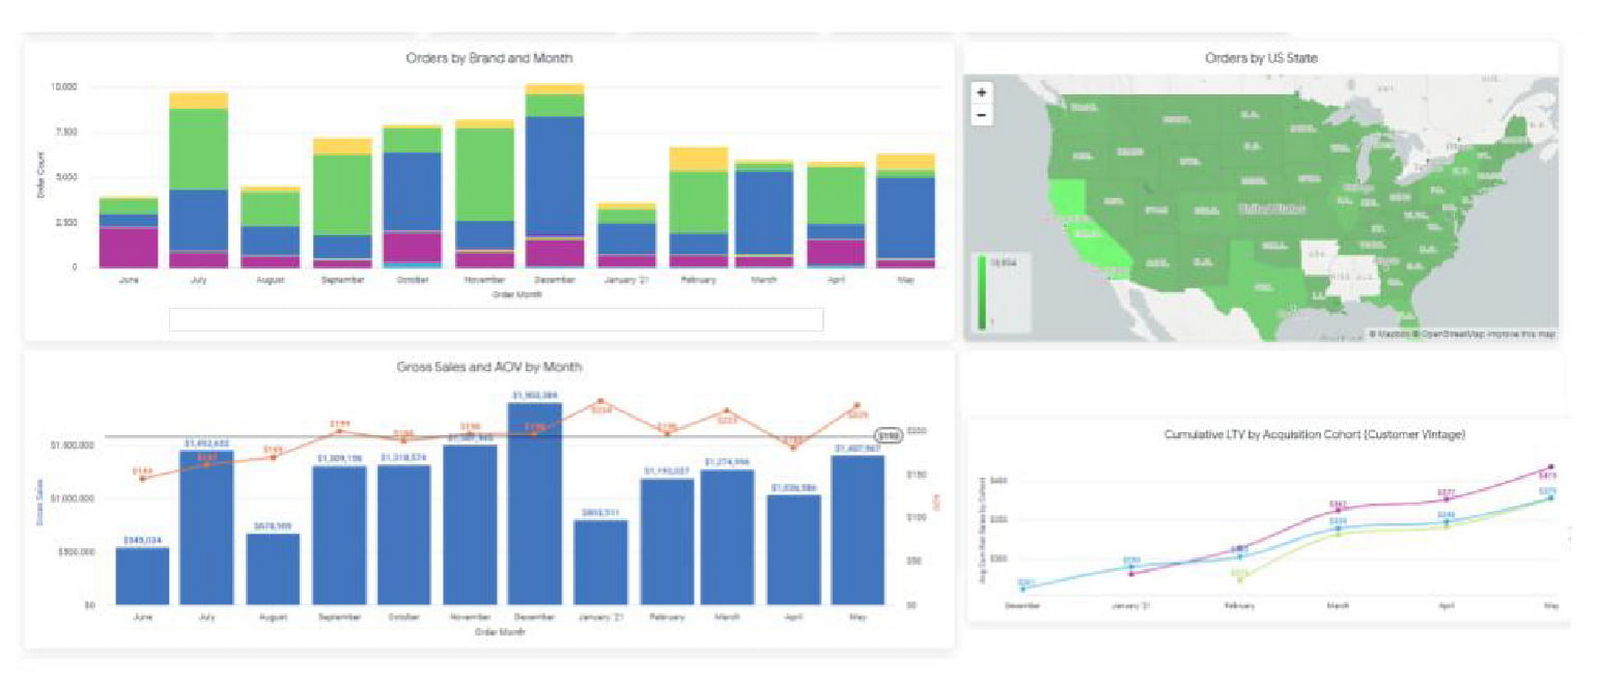
In short order, taking a modern and integrated approach to the DTC technology stack has delivered economic impact across the portfolio, helping our team understand and combat customer churn, increase conversion rates, and optimize the customer acquisition cost (CAC) and customer lifetime value (CLV) ratios. Perhaps most important is the benefit it can provide to the customer base. Mining customer data and consumer behavior generates data into what our customers are seeking, giving us insights to supply more, or less of it. For example, observing sales velocity and conversion rates by SKU or by region can help us better understand changes in customer taste profiles and fluctuations in demand, providing the foundation for a more powerful innovation pipeline and more effective sales and distribution tactics in wholesale. Our team has also been an early pilot tester for Looker’s new integration with Customer Match, which contributes to the virtuous cycle between data insight and data activation. In the future, our plan is to leverage this cycle to amplify the impact of Google Ads across Search, Shopping, and YouTube placements for the wine and spirits portfolio.
The operational impact of Looker is also substantial: our team estimates that the number of hours needed to reach critical business decisions has been reduced by nearly 60%, boosting productivity and accelerating the daily operating rhythm. A thoughtfully curated technology stack together with a modern BI solution allows us to stay at the vanguard of the industry. While the DTC sales channel is not designed to surpass the core business of wholesale for Constellation in terms of size, the approach enables unparalleled insights and measurement abilities that will pay dividends for the entire business for years to come.
How to Enhance Incremental Pipeline Performance while Ingesting Data into BigQuery

6338
Of your peers have already read this article.
3:00 Minutes
The most insightful time you'll spend today!
When you build a data warehouse, the important question is how to ingest data from the source system to the data warehouse. If the table is small you can fully reload a table on a regular basis, however, if the table is large a common technique is to perform incremental table updates. This post demonstrates how you can enhance incremental pipeline performance when you ingest data into BigQuery.
Setting up a standard incremental data ingestion pipeline
We will use the below example to illustrate a common ingestion pipeline that incrementally updates a data warehouse table. Let’s say that you ingest data into BigQuery from a large and frequently updated table in the source system, and you have Staging and Reporting areas (datasets) in BigQuery.

The Reporting area in BigQuery stores the most recent, full data that has been ingested from the source system tables. Usually you create the base table as a full snapshot of the source system table. In our running example, we use BigQuery public data as the source system and create reporting.base_table as shown below. In our example each row is identified by a unique key which consists of two columns: block_hash and log_index.
CREATE TABLE reporting.base_table --156 GB processedPARTITION BY TIMESTAMP_TRUNC(block_timestamp, DAY) ASSELECT log_index, data, topics, block_timestamp, block_hashFROM bigquery-public-data.crypto_ethereum.logsWHERE block_timestamp BETWEEN TIMESTAMP '2020-01-01' AND TIMESTAMP '2020-11-30';
In data warehouses it is common to partition a large base table by a datetime column that has a business meaning. For example, it may be a transaction timestamp, or datetime when some business event happened, etc. The idea is that data analysts who use the data warehouse usually need to analyze only some range of dates and rarely need the full data. In our example, we partition the base table by block_timestamp which comes from the source system.
After ingesting the initial snapshot you need to capture changes that happen in the source system table and update the reporting base table accordingly. This is when the Staging area comes into the picture. The staging table will contain captured data changes that you will merge into the base table. Let’s say that in our source system on a regular basis we have a set of new rows and also some updated records. In our example we mock the staging data as follows: first, we create new data, than we mock the updated records:
CREATE TABLE staging.load_delta AS --5 GB processedSELECT log_index, data, topics, block_timestamp, block_hashFROM bigquery-public-data.crypto_ethereum.logsWHERE block_timestamp BETWEEN TIMESTAMP '2020-12-01' AND TIMESTAMP '2020-12-07';INSERT INTO staging.load_delta --2 GB processedSELECT log_index, CONCAT(data, RAND()), topics, block_timestamp, block_hashFROM bigquery-public-data.crypto_ethereum.logs TABLESAMPLE SYSTEM (5 PERCENT)WHERE block_timestamp BETWEEN TIMESTAMP '2020-10-01' AND TIMESTAMP '2020-11-30';
Next, the pipeline merges the staging data into the base table. It joins two tables by unique key and than updates the changed value or inserts a new row
MERGE INTO reporting.base_table T --161 GB processedUSING staging.load_delta SON T.block_hash = S.block_hashAND T.log_index = S.log_indexWHEN MATCHED THEN UPDATE SETT.data = S.dataWHEN NOT MATCHED THEN INSERT (log_index, data, topics, block_timestamp, block_hash)VALUES (log_index, data, topics, block_timestamp, block_hash);
It is often the case that the staging table contains keys from various partitions but the number of those partitions are relatively small. It holds, for instance, because in the source system the recently added data may get changed due to some initial errors or ongoing processes but older records are rarely updated. However, when the above MERGE gets executed, BigQuery scans all partitions in the base table and processes 161 GB of data. You might add additional join condition on block_timestamp:
MERGE INTO reporting.base_table T --161 GB processedUSING staging.load_delta SON T.block_hash = S.block_hashAND T.log_index = S.log_indexAND T.block_timestamp = S.block_timestampWHEN MATCHED THEN UPDATE SETT.data = S.dataWHEN NOT MATCHED THEN INSERT (log_index, data, topics, block_timestamp, block_hash)VALUES (log_index, data, topics, block_timestamp, block_hash);
But BigQuery would still scan all partitions in the base table because condition T.block_timestamp = S.block_timestamp is a dynamic predicate and BigQuery doesn’t automatically push such predicates down from one table to another in MERGE.
Can you improve the MERGE efficiency by making it scan less data? The answer is Yes.
As described in the MERGE documentation, pruning conditions may be located in a subquery filter, a merge_condition filter, or a search_condition filter. In this post we show how you can leverage the first two. The main idea is to turn a dynamic predicate into a static predicate.
Steps to enhance your ingestion pipeline
The initial step is to compute the range of partitions that will be updated during the MERGE and store it in a variable. As was mentioned above, in data ingestion pipelines, staging tables are usually small so the cost of the computation is relatively low.
DECLARE src_range STRUCT<date_min TIMESTAMP, date_max TIMESTAMP> --115 MB processedDEFAULT(SELECT STRUCT(MIN(block_timestamp) AS date_min,MAX(block_timestamp) AS date_max) FROM staging.load_delta);
Based on your existing ETL/ELT pipeline, you can add the above code as-is to your pipeline or you can compute date_min, data_max as part of some already existing transformation step. Alternatively, date_min, data_max can be computed on the Source System side while capturing the next ingestion data batch.
After computing date_min, date_max you pass those values to the MERGE statement as static predicates. There are several ways to enhance the MERGE and prune partitions in the base table based on precomputed date_min, data_max.
If your initial MERGE statement uses a subquery, you can incorporate a new filter into it:
BEGINDECLARE src_range STRUCT<date_min TIMESTAMP, date_max TIMESTAMP> --115 MB processedDEFAULT(SELECT STRUCT(MIN(block_timestamp) AS date_min,MAX(block_timestamp) AS date_max) FROM staging.load_delta);MERGE INTO reporting.base_table T --41 GB processedUSING (SELECT *FROM staging.load_deltaWHERE block_timestamp BETWEEN src_range.date_min AND src_range.date_max) SON T.block_hash = S.block_hashAND T.log_index = S.log_indexAND T.block_timestamp = S.block_timestampWHEN MATCHED THEN UPDATE SETT.data = S.dataWHEN NOT MATCHED THEN INSERT (log_index, data, topics, block_timestamp, block_hash)VALUES (log_index, data, topics, block_timestamp, block_hash);END;
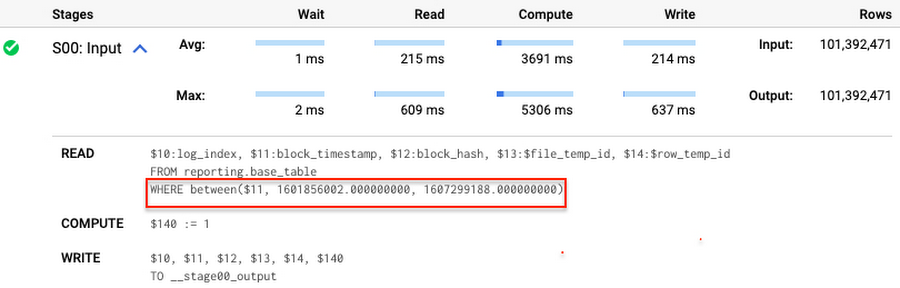
Note that you add the static filter to the staging table and keep T.block_timestamp = S.block_timestamp to convey to BigQuery that it can push that filter to the base table. This MERGE processes 41 GB of data in contrast to the initial 161 GB. You can see in the query plan that BigQuery pushes the partition filter from the staging table to the base table:
This type of optimization, when a pruning condition is pushed from a subquery to a large partitioned or clustered table, is not unique for MERGE. It also works for other types of queries. For instance:
SELECT * -- 41 GB processedFROM reporting.base_table TINNER JOIN staging.load_delta SON T.block_hash = S.block_hashAND T.log_index = S.log_indexAND T.block_timestamp = S.block_timestampWHERE S.block_timestamp BETWEEN TIMESTAMP '2020-10-05' AND TIMESTAMP '2020-12-07'
And you can check the query plan to verify that BigQuery pushed down the partition filter from one table to another.
Moreover, for SELECT statements, BigQuery can automatically infer a filter predicate on a join column and push it down from one table to another if your query meets the following criteria:
- The target table must be clustered or partitioned.
- The result size of the other table, i.e. after applying all filters, must qualify for broadcast join. Namly, the result set must be relatively small, less than ~100MB.
In our running example, reporting.base_table is partitioned by block_timestamp. If you define a selective filter on staging.load_delta and join two tables, you can see an inferred filter on the join key pushed to the target table
SELECT *FROM reporting.base_table TINNER JOIN staging.load_delta SON T.block_timestamp = S.block_timestampWHERE S.block_hash = '0x0c1caa16b34d94843aabfebc0d5a961db358135988f7498a6fdc450ad55f0870'
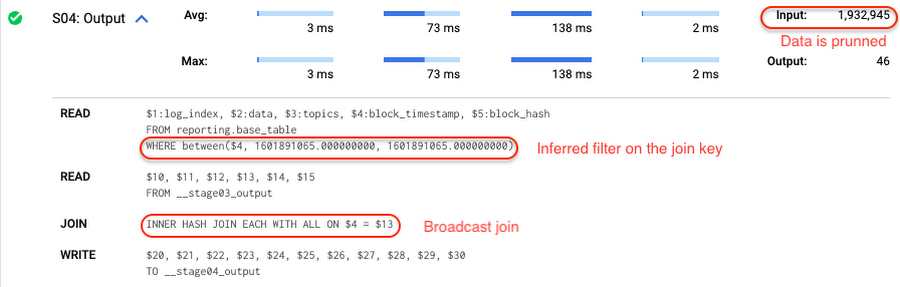
There is no requirement to join tables by partitioning or clustering key to kick off this type of optimization. However, in this case the pruning effect on the target table would be less significant.
But let us get back to the pipeline optimizations. Another way to enhance MERGE is to modify the merge_condition filter by adding static predicate on the base table:
BEGINDECLARE src_range STRUCT<date_min TIMESTAMP, date_max TIMESTAMP> --115 MB processedDEFAULT(SELECT STRUCT(MIN(block_timestamp) AS date_min,MAX(block_timestamp) AS date_max) FROM staging.load_delta);MERGE INTO reporting.base_table T --41 GB processedUSING staging.load_delta SON T.block_hash = S.block_hashAND T.log_index = S.log_indexAND T.block_timestamp BETWEEN src_range.date_min AND src_range.date_maxWHEN MATCHED THEN UPDATE SETT.data = S.dataWHEN NOT MATCHED THEN INSERT (log_index, data, topics, block_timestamp, block_hash)VALUES (log_index, data, topics, block_timestamp, block_hash);END;
To summarize, here are the steps that you can perform to enhance incremental ingestion pipelines in BigQuery. First you compute the range of updated partitions based on the small staging table. Next, you tweak the MERGE statement a bit to let BigQuery know to prune data in the base table.
All the enhanced MERGE statements scanned 41 GB of data, and setting up the src_range variable took 115 MB. Compare it with the initial 161 GB scan. Moreover, given that computing src_range may be incorporated into some existing transformation in your ETL/ELT, it results in a good performance improvement which you can leverage in your pipelines.
In this post we described how to enhance data ingestion pipelines by turning dynamic filter predicates into static predicates and letting BiQuery prune data for us. You can find more tips on BigQuery DML tuning here.
Special thanks to Daniel De Leo, who helped with examples and provided valuable feedback on this content.
Unlock Powerful Insights: Monitor Cloud Expenses with BigQuery’s Data Export

1314
Of your peers have already read this article.
1:30 Minutes
The most insightful time you'll spend today!
TL;DR – Regular file export for Google Cloud billing is going away on May 15th! Try out this interactive tutorial to set up exporting and explore your billing data with BigQuery
You may have seen an email from Google Cloud reminding you to set up billing data export to BigQuery, and letting you know that file export options are going away. More specifically:
Starting May 15, 2023, your daily usage and cost estimates won’t be automatically exported to a Cloud Storage bucket. Your existing Cloud Storage buckets will continue to exist, but no new files will be added on an ongoing basis.
In fact, I even received one of these notifications since I had an old billing account (or two) that still had file export enabled. Even though the file export is going away, exporting your billing data to BigQuery gives you more detail and more capabilities to analyze, so it’s a big upgrade.
Start from the start
While Google Cloud does offer a free trial and free tier of services, it shouldn’t come as a surprise that most cloud services cost money to use. With the unique properties of the cloud, it’s much easier to bill for exact usage of various services, like pay-per-second for virtual machines. However, this can also become an overwhelming amount of information when a large number of services are being used across multiple teams. In order to make sure you understand your billing data, Google Cloud offers that data through direct reporting in the Cloud console, file exports, and exporting to BigQuery.
Most importantly, the file export for Cloud Billing data is going away on May 15th (the file exports for specific reports, like the cost table, aren’t going away). This was an option for billing accounts to generate daily CSV or JSON files into a Cloud Storage bucket so you could download the files and analyze them as needed. While these exports were definitely helpful for looking at your billing data, over time they couldn’t keep up with the complexity and volume of data that comes out of a billing account.
The most important thing to note here is simple: this export option is being deprecated entirely, so if you’re currently using it (and even if you’re not), you should make sure exporting to BigQuery is enabled.
Large data, large queries
Exporting from your billing account into BigQuery has been an option for the past few years, and now more than ever it’s the central option for managing your billing data. Of course, BigQuery is a natural home for large datasets with the scale and granularity of your billing data. In addition to that, exporting to BigQuery also happens more frequently than a daily file export, so you can do cost anomaly detection much faster.
As teams and organizations become larger, it can be increasingly difficult to figure out which groups are responsible for different costs. If your organization is using a chargeback model (where one group pays for all resources and then breaks down cost details for individual teams/groups to be responsible for their usage), then using BigQuery is the best way for you to accurately collect and analyze costs. On top of being able to query directly against your data, BigQuery also makes it much easier to integrate with other tools, like Looker or Looker Studio for visualization.
The actual data being exported to BigQuery are hourly records of every service your billing account is responsible for, along with detailed information like the SKU, what type of unit is being measured, and how many of that unit you’re paying for.
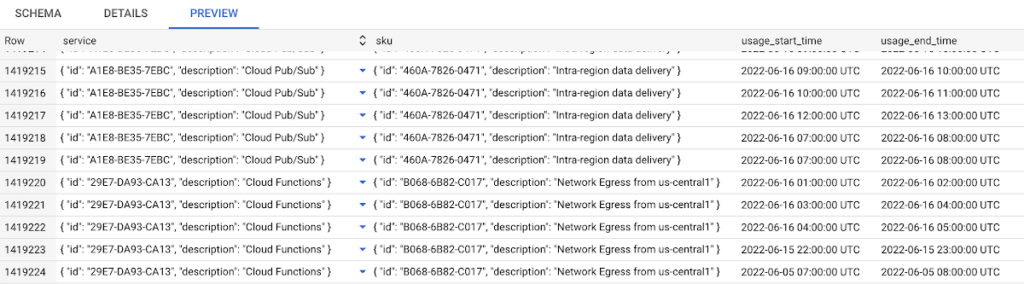
I suspect most folks using the file export (and probably most folks overall) will be fine with the standard export for BigQuery, and can use the detailed cost and pricing options if they need even more details. You can find some more details on all the exports in this blog post.
With the file export going away, it’s also important to mention: exporting your Cloud Billing data to BigQuery starts when you enable it, and doesn’t include older data. So make sure you set yourself up for future success by enabling billing export as soon as possible. Try using our built-in walkthrough to help you enable the export and to get started analyzing the data! You can also read more in the documentation.
Become Truly Data-driven with Unified Analytics Platform Built on Google Cloud

3678
Of your peers have already read this article.
2:00 Minutes
The most insightful time you'll spend today!
Every company these days is becoming a data company whether they know it or not. This results in preparing the company to create an ecosystem for data processing. Traditionally, organisations’ data ecosystems consisted of point solutions that used to provide data services. For example, one of the most common questions we get from customers is, “Do I need a data lake, or should I consider a data warehouse? Do you recommend I consider both?” Traditionally, these two architectures have been viewed as separate systems, applicable to specific data types and user skill sets. Increasingly, we are seeing a blurring of lines between data warehouses and data lakes, which provide customers with an opportunity to create a more comprehensive platform that gives them the best of both worlds.
What if we don’t need to compromise? And we create an end-to-end solution compromising the entire data management and processing stages, from data collection to serving. Thus, Data platforms are typically used to store vast amounts of data in varying formats and doing so without compromising on latency. At the same time, providing a platform for all users throughout the data lifecycle.
Emerging Trends
There are data solutions and architectures we’re seeing and anticipating. Emerging concepts include data lakehouses, data meshes, and data vaults. Some are not new and have been around in different shapes and formats, however, all of them work naturally within a Google Cloud environment. Lets look into both ends of the spectrum of enabling data and enabling teams.
Data mesh facilitates a decentralized approach to data ownership, allowing individual lines of business to publish and subscribe to data in a standardized manner, instead of forcing data access and stewardship through a single, centralized team. On the other hand, a data lake house brings raw and processed data closer together, allowing for a more streamlined and centralized repository of data needed throughout the organization. Processing can be done in transit via ELT, reducing the need to copy datasets across systems. This allows for easier data exploration and easier governance. Data vault is designed to separate data driven and model driven parts, so the way data is integrated in the raw vault enables parallel loading so that large implementations can scale out easily.
In Google Cloud, there is no need to keep them separate. In fact, with interoperability among our portfolio of data analytics products, you can easily provide access to data residing in different places, effectively bringing your data lake and data warehouse together on a single platform.
Let’s look at some of the technological innovations that make this reality. BigQuery’s storage API allows treating a data warehouse like a data lake, letting you access the data residing in BigQuery. For example, you can use Spark to access data residing in the data warehouse without it affecting performance of any other jobs accessing it. This is all made possible by the underlying architecture, which separates compute and storage.
We continue to offer specialized products and solutions around data lake and data warehouse functionality but over time we expect to see a significant enough convergence of the two systems that the terminology will change. At Google Cloud, we consider this combination an “analytics data platform”.
Tactical or Strategical
Key differentiators of Google Cloud’s data analytics platform are being open, intelligent, flexible, and tightly integrated. There are many technologies in the market which provide tactical solutions that may feel comfortable and familiar. However, this can be a rather short-term approach that simply lifts and shifts a siloed solution into the cloud. In contrast, an analytics data platform built on Google Cloud provides modern data warehousing and data lake capabilities with close integration to our AI Platform. It also provides built-in streaming, ML, and geospatial capabilities and an in-memory solution for BI use cases. Depending on your organizational data needs, Google Cloud has the set of products, tools, and services to create the right data platform for you.
To become a truly data-driven organization, the first step is to design and implement an analytics data platform that meets your technical and business needs. Whether you want to empower teams to own, publish, and share their data across the organization, or you want to create a streamlined store of raw and processed data for easier discovery, there is a solution that best meets the needs of your company.
To learn more about the elements of a unified analytics data platform built on Google Cloud, and the differences in platform architectures and organizational structures, read our Unified Analytics Platform paper.
Mid-Sized B2B Firm Achieves the Business Trifecta with a Single Strategy

6915
Of your peers have already read this article.
2:45 Minutes
The most insightful time you'll spend today!
Thirteen years’ experience in e-commerce has given Teddy Chan, Chief Executive Officer and Chief Technology Officer, AfterShip, a deep understanding of the challenges of shipping and tracking packages to customers worldwide.
“The key problem many merchants face is customers asking ‘where is my order?’ and ‘when I will get the package?’” Chan says. “When I considered this issue, I came up with the idea of AfterShip.” Chan helped found AfterShip in 2011 to enable merchants to keep track of packages sent to customers via a web portal or an API. AfterShip also allows merchants to notify customers of anticipated delivery times.
“Using AfterShip, merchants can provide the same experience to buyers regardless of which couriers they use,” Chan says. “Merchants can also improve their customer engagement by including up-selling or marketing content with their delivery notifications.”
Hong Kong-headquartered AfterShip continues to grow quickly and now has a 40-person team. Thirty members of this team are based on the China special administrative region and 10 are based in India.
“Google Cloud Platform has a network of global datacentres with deep connectivity that enables us to put our infrastructure close to our customers. In addition, the ability to horizontally scale our global database using tools such as Google Cloud Spanner eliminates any limits on our geographic expansion.”
—Teddy Chan, Chief Executive Officer and Chief Technology Officer, AfterShip
By October 2017, the business was tracking about 30 million packages per month and had expanded its services to include label and rate calculation and self-service return. Revenue, package transaction numbers and team size have doubled every year for the past three years, while more than 300,000 merchants and 426 couriers are signed up to the service. Key customers include Wish, Etsy and Groupon.
Close to half AfterShip’s customers are based in the United States, about one third in Europe and the remainder are located in Asia. AfterShip had initially delivered its applications and services from an incumbent public cloud service. However, the company wanted to continue its growth trajectory while automating key infrastructure processes, implementing a continuous deployment model and controlling costs.
The business needed to achieve these objectives while maintaining a global presence and high-quality service. AfterShip started reviewing its options and decided to migrate to Google Cloud Platform (GCP). “Google Cloud Platform has a network of global datacentres with deep connectivity that enables us to place our infrastructure close to our customers,” Chan says.
“In addition, the ability to horizontally scale our global database using tools such as Google Cloud Spanner eliminates any limits to our geographic expansion. Furthermore, the managed services provided through GCP would allow us to focus on building better features for online merchants.” The reliability provided by GCP would also enable AfterShip to meet the stringent service level requirements of large digital marketplaces in the United States, Asia and elsewhere.
“Google Cloud Platform could manage the high volumes and enable us to deliver the service levels that would realise our ambition of becoming the number one tracking API platform in the world,” Chan says. “For example, with Google Cloud Platform, we can provide a 99.95% monthly uptime service level to our customers.” Finally, GCP provided managed solutions, including Google Kubernetes Engine powered by open source container orchestrator Kubernetes, that would enable AfterShip to automate processes such as scaling and enable its team to focus on developing applications.
AfterShip has moved its websites into GCP infrastructure in three datacentres around the world and anticipates completing the migration in Q4 2017. “Google provided a lot of assistance, particularly early in the project when we needed it,” Chan says. “They briefed us on several services we hadn’t known about that could replace the equivalents in the public cloud we were using previously.” The business then completed the migration using its own skilled team members. As well as Google Kubernetes Engine and Google Cloud Spanner, AfterShip is using Google BigQuery to store and analyse transaction information.
“Google Cloud Platform could manage the high volumes and enable us to deliver the service levels that would realise our ambition of becoming the number one tracking API platform in the world.”
—Teddy Chan, Chief Executive Officer and Chief Technology Officer, AfterShip
Deployment times down from one hour to two minutes
With deployment times falling from up to one hour in its previous cloud environment to about two minutes in GCP, AfterShip has been able to adopt a continuous deployment model. “This has improved our service levels,” Chan says. “If there are any issues we can fix them quickly, while we can iterate faster to create new features in response to customer requests or changes in the market. “This enables us to continue to lead our competitors.”
Targeting a 30 percent reduction in costs
AfterShip is now targeting a 30% reduction in costs by optimising its use of Docker containerisation technology on GCP.
“By using Docker with Kubernetes, we have been able to fine-tune our use of compute resources and better control our costs,” Chan says. “We’re extremely pleased with Google Cloud Platform as it really is built for engineers,” he adds. “In addition, its documentation is extremely clear, allowing us to troubleshoot or carry out activities on the platform ourselves. “We look forward to continuing to grow and extend our package tracking and associated services with Google Cloud Platform.”
Developers and Practitioners’ Guide for Moving On-prem Data Warehouse to BigQuery

5424
Of your peers have already read this article.
3:00 Minutes
The most insightful time you'll spend today!
Data teams across companies have continuous challenges of consolidating data, processing it and making it useful. They deal with challenges such as a mixture of multiple ETL jobs, long ETL windows capacity-bound on-premise data warehouses and ever-increasing demands from users. They also need to make sure that the downstream requirements of ML, reporting and analytics are met with the data processing. And, they need to plan for the future – how will more data be handled and how new downstream teams will be supported?
Checkout how Independence Health Group is addressing their enterprise data warehouse (EDW) migration in the video above.
Why BigQuery?
On-premises data warehouses become difficult to scale so most companies’ biggest goal is to create a forward looking system to store data that is secure, scalable and cost effective. GCP’s BigQuery is serverless, highly scalable, and cost-effective and is a great technical fit for the EDW use-case. It’s a multicloud data warehouse designed for business agility. But, migrating a large, highly-integrated data warehouse from on-premise to BigQuery is not a flip-a-switch kinda migration. You need to make sure your downstream systems dont break due to inconsistent results in migrating datasets, both during and after the migration. So..you have to plan your migration.
Data warehouse migration strategy
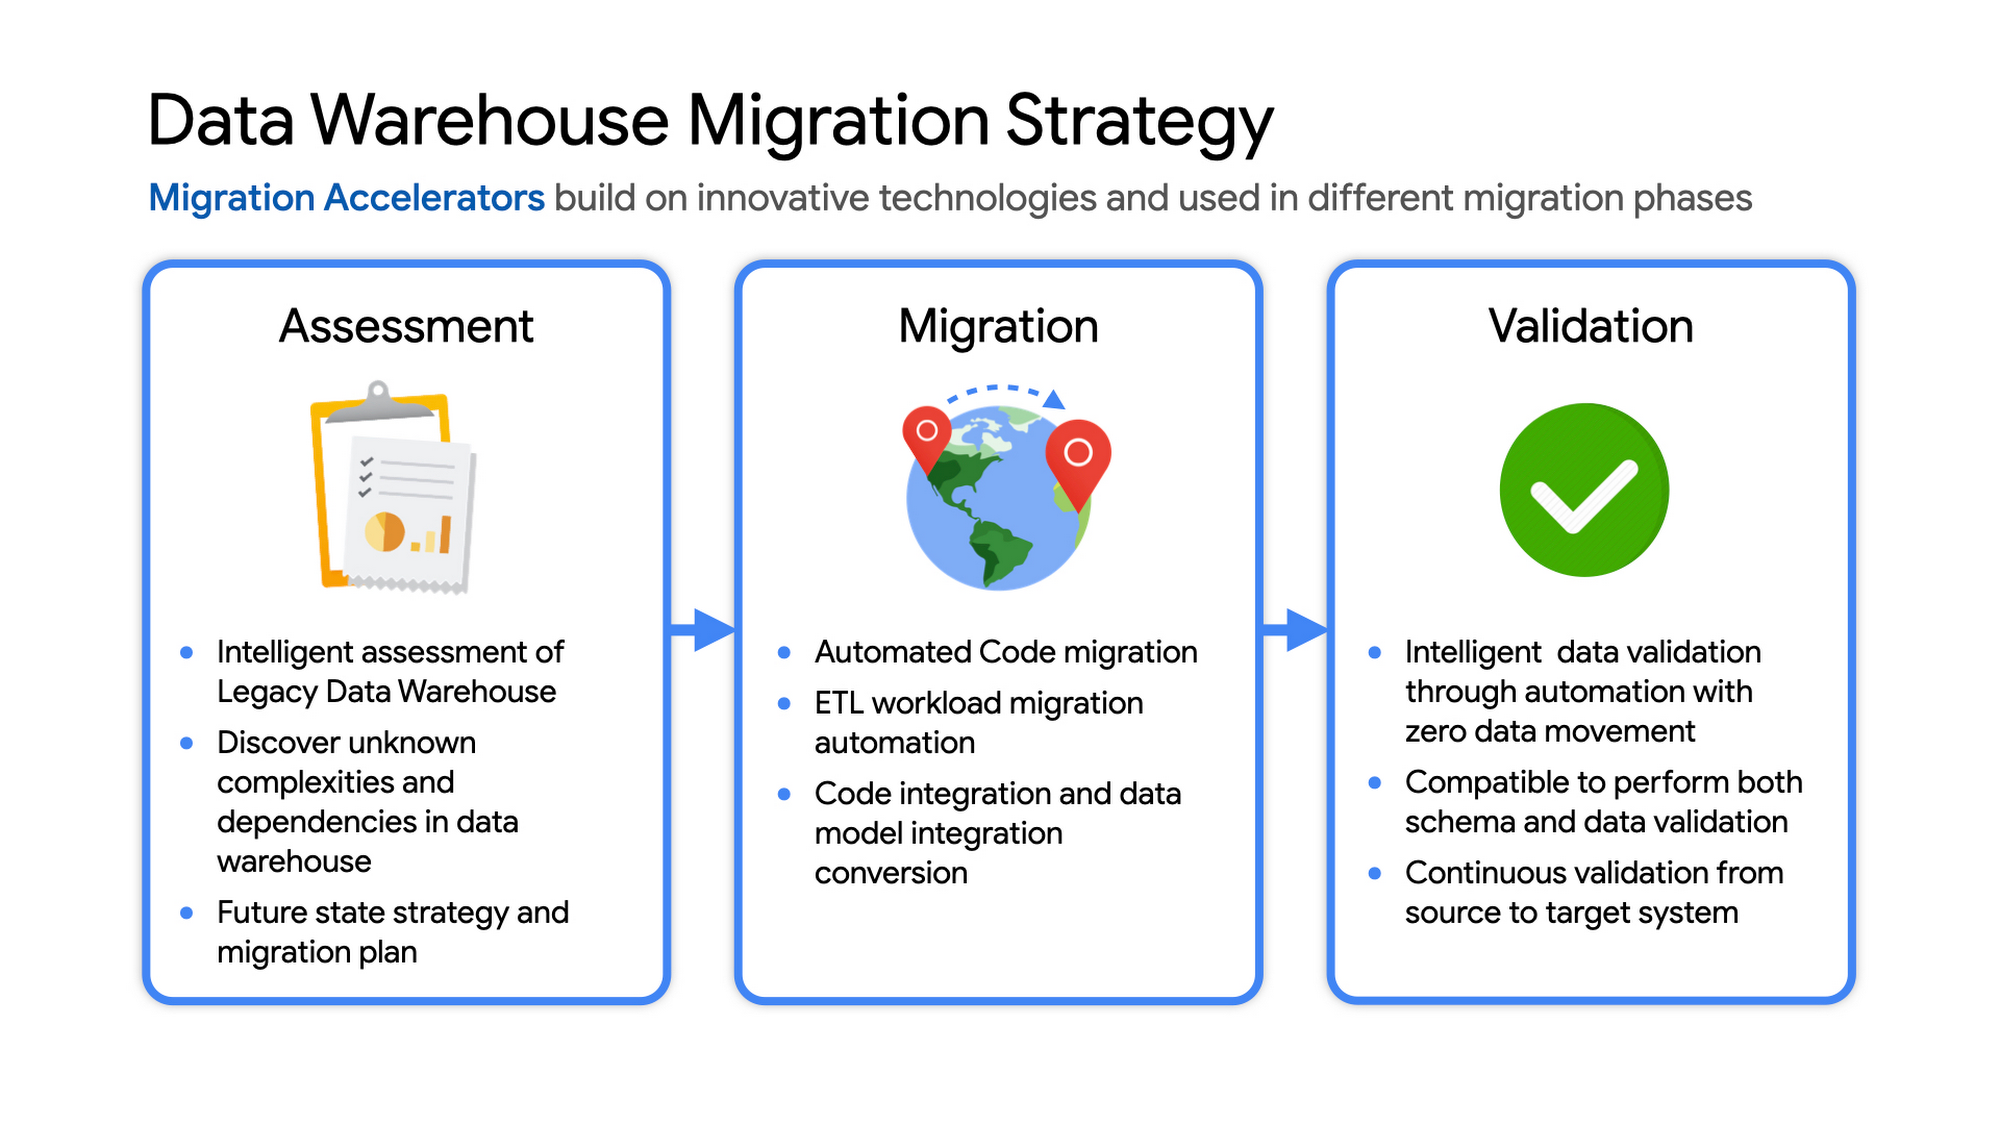
The following steps are typical for a successful migration:
- Assessment and planning: Find the scope in advance to plan the migration of the legacy data warehouse
- Identify data groupings, application access patterns and capacities
- Use tools and utilities to identify unknown complexities and dependencies
- Identify required application conversions and testing
- Determine initial processing and storage capacity for budget forecasting and capacity planning
- Consider growth and changes anticipated during the migration period
- Develop a future state strategy and vision to guide design
- Migration: Establish GCP foundation and begin migration
- As the cloud foundation is being set up, consider running focused POCs to validate data migration processes and timelines
- Look for automated utilities to help with any required code migration
- Plan to maintain data synchronization between legacy and target EDW during the duration of the migration. This becomes a critical business process to keep the project on schedule.
- Plan to integrate some enterprise tooling to help existing teams span both environments
- Consider current data access patterns among EDW user communities and how they will map to similar controls available in Big Query.
- Key scope includes code integration and data model conversions
- Expect to refine capacity forecasts and refine allocation design. In Big Query there are many options to balance cost and performance to maximize business value. For example, you can use either on-demand or flat-rate slot pricing or a combination of both.
- Validation and testing
- Look for tools to allow automated, intelligent data validation
- Scope must include both schema and data validation
- Ideally solutions will allow continuous validation from source to target system during migration
- Testing complexity and duration will be driven by number and complexity of applications consuming data from the EDW and rate of change of those applications
A key to successful migration is finding Google Cloud partners with experience migrating EDW workloads. For example, our Google Cloud partner Datametica offers services and specialized Migration Accelerators for each of these migration stages to make it more efficient to plan and execute migrations.
Data warehouse migration: Things to consider
- Financial benefits of open source: Target moving to ‘Open Source’ where none of the services have license fees. For example BigQuery uses Standard SQL; Cloud Composer is managed Apache Airflow, Dataflow is based on Apache Beam. Taking these as managed services provides the financial benefits of open source, but avoids the burden of maintaining open source platforms internally.
- Serverless: Move to “serverless” big data services. The majority of the services used in a recommended GCP data architecture scale on demand allowing more cost effective alignment with needs. Using fully managed services lets you focus engineering time on business roadmap priorities, not building and maintaining infrastructure.
- Efficiencies of a Unified platform: Any data warehouse migration involves integration with services that surround the EDW for data ingest and pre-processing and advanced analytics on the data stored in the EDW to maximize business value. A cloud provider like GCP offers a full breadth of integrated and managed ‘big data’ services with built-in machine learning. This can yield significantly reduced long-term TCO by increasing both operational and cost efficiency when compared to EDW-specific point solutions.
- Establishing a solid cloud foundation: From the beginning, take the time to design a secure foundation that will serve the business and technical needs for workloads to follow. Key features include: Scalable Resource Hierarchy, Multi-layer security, multi-tiered network and data center strategy and automation using Infrastructure-as-Code. Also allow time to integrate cloud-based services into existing enterprise systems such as CI/CD pipelines, monitoring, alerting, logging, process scheduling, and service request management.
- Unlimited expansion capacity: Moving to cloud sounds like a major step, but really look at this as adding more data centers accessible to your teams. Of course, these data centers offer many new services that are very difficult to develop in-house and provide nearly unlimited expansion capacity with minimal up-front financial commitment. .
- Patience and interim platforms: Migrating an EDW is typically a long running project. Be ready to design and operate interim platforms for data synchronization, validation and application testing. Consider the impact on up-stream and down-stream systems. It might make sense to migrate and modernize these systems concurrent with the EDW migration since they are probably data sources and sinks and may be facing similar growth challenges. Also be ready to accommodate new business requirements that develop during the migration. Take advantage of the long duration to have existing your operational teams learn new services from the partner leading the deployment so your teams are ready to take over post-migration.
- Experienced partner: An EDW migration can be a major undertaking with challenges and risks during migration, but offers tremendous opportunities to reduce costs, simplify operations and offer dramatically improved capacities to internal and external EDW users. Selecting the right partner reduces the technical and financial risks, and allows you to plan for and possibly start leveraging these long-term benefits early in the migration process.
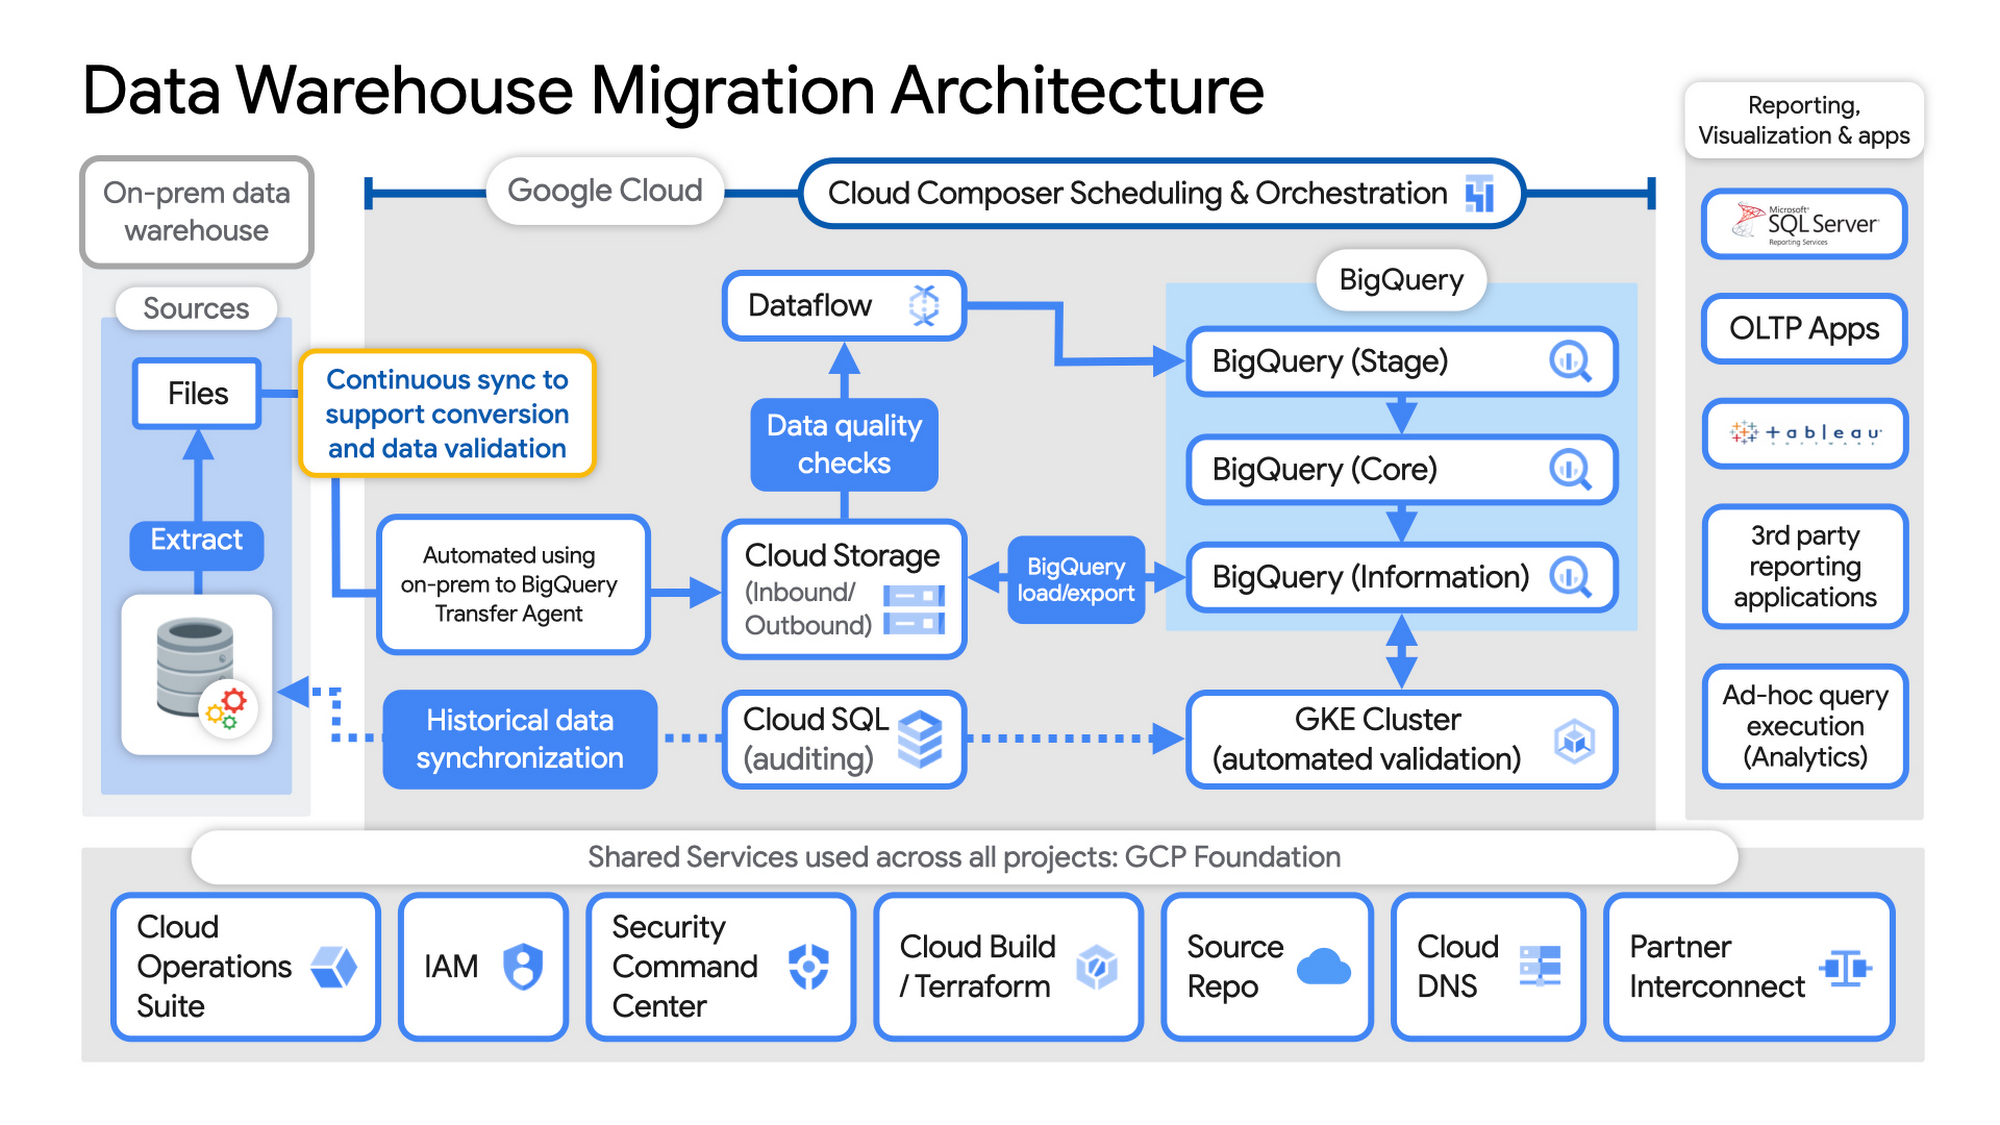
Example Data Warehouse Migration Architecture
- Setup foundational elements. In GCP these include, IAM for authorization and access, cloud resource hierarchy, billing, networking, code pipelines, Infrastructure as Code using Cloud Build with Terraform ( GCP Foundation Toolkit), Cloud DNS and a dedicated/partner Interconnect to connect to the current data centers.
- Activate monitoring and security scanning services before real user data is loaded using Cloud Operations for monitoring and logging and Security Command Center for security monitoring.
- Extract files from on-premise legacy EDW and move to Cloud Storage and establish on-going synchronization using Big Query Transfer services.
- From Cloud Storage, process the data in Dataflow and Load/Export data to BigQuery.
- Validate the export using Datametica’s validation utilities running in a GKE cluster and Cloud SQL for auditing and historical data synchronization as needed. Application teams test against the validated data sets throughout the migration process.
- Orchestrate the entire pipeline using Cloud Composer, integrated with on-prem scheduling services as needed to leverage established processes and keep legacy and new systems in sync.
- Maintain close coordination with teams/services ingesting new data into the EDW and down-streams analytics teams relying on the EDW data for on-going advanced analytics.
- Establish fine-grained access controls to data sets and start making the data in Big Query available to existing reporting, visualization and application consumption tools using BigQuery data connectors for ‘down-stream’ user access and testing.
- Incrementally increase Big Query flat-rate processing capacity to provide the most cost-effective utilization of resources during migration.
To learn more about migrating from on-premises Enterprise Data Warehouses (EDW) to Bigquery and GCP here.
More Relevant Stories for Your Company

How Google Cloud & NGIS’ Partnership Powers Sustainability & Responsible Sourcing for Consumer Brands
In the competitive world of consumer goods, sustainability matters more than ever. In recent Google survey, 82% of consumers said sustainability is more top of mind now than it was before COVID-191 and 78% said that big businesses have a role to play in helping to fight climate change.2 As well as delivering on
The future of data warehousing
While data has influenced major business decisions throughout the ages, the term “data warehouse” isn’t even half a century old. But it’s an important concept; by centralizing data from many disparate sources, analysts can make more informed decisions. Traditionally, this has meant collecting data in on-premises infrastructure. But as data

Google Launches Open Saves To Power Gaming Platforms Scale to User Demands
Many of today’s games are rich, immersive worlds that engage the audience in ways that make a gamer a part of a continuing storyline. To create these persistent experiences, numerous storage technologies are required to ensure game data can scale to the standards of gamers’ demands. Not only do game

New Capabilities in BigQuery to Ease Anomalies Detection in the Absence of Labeled Data
When it comes to anomaly detection, one of the key challenges that many organizations face is that it can be difficult to know how to define what an anomaly is. How do you define and anticipate unusual network intrusions, manufacturing defects, or insurance fraud? If you have labeled data with
