





How AI and ML Helps Interpret Baseball Fandom during this MLB Season

4547
Of your peers have already read this article.
1:30 Minutes
The most insightful time you'll spend today!
The game of baseball has no shortage of statistics — from batting average to exit velocity, strikeouts to wins above replacement. Among all sports, Major League Baseball (MLB) arguably contains the most analytical and data-driven participants and fan base. Subconsciously or viscerally, players and managers on the field and those following from anywhere are constantly assessing and making decisions based off of game play trends and expectations — whether a batter will come through with a hit in an important situation, when a pitcher should be pulled. Less analyzed, however, is what leads fans to become engaged with certain players or teams, and what factors drive their love of the game. This is the motivation behind the problem being posed by Major League Baseball in their Kaggle competition for Player Digital Engagement Forecasting. Can you use machine learning to deconstruct baseball fandom?
This competition asks you to predict measures of digital engagement for each active player on a daily basis during the MLB season. So, how large was the surge in fan interest after Joe Musgrove threw the first no-hitter in Padres history? Is Shohei Ohtani’s engagement higher when he pitches well, when he hits a monster home run…or when he does both? You’re provided a wealth of game, team and player information – detailed stats, awards, rosters, and transaction information – as well as social and digital engagement data as your inputs. Data scientists will recognize this as an exciting forecasting problem with both traditional regression and time series components, where having this input data just prior to the prediction date is critical to determining which players will receive the most engagement.
With so many variables in the game, there are an endless number of vectors which could possibly influence fan engagement. Eleven-time All-Star Miguel Cabrera delighted fans by hitting the first home run of the season – in the snow! Occasionally a lesser-known player like Musgrove or Carlos Rodón “wins the day” with an unlikely no-hitter. And sometimes just getting traded to an iconic franchise like the Yankees generates a ton of fan interest, like it did for Rougned Odor in early April.
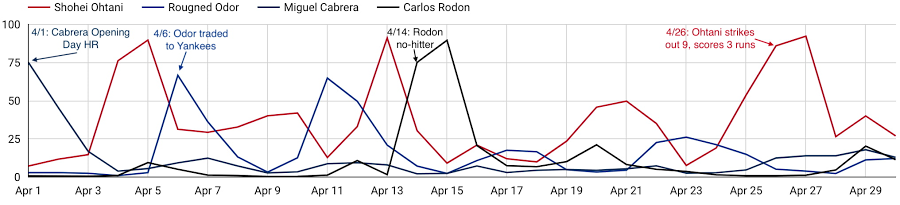
As these examples show, a player’s digital engagement can be pretty dynamic during the season, with many different potential contributors to who is “trending” on a given day. How can you use data to uncover which factors are the most influential of engagement with each player’s digital content?
Ready to play ball? Check out the competition on Kaggle for all the details. $50,000 in prizes is up for grabs in two prize categories. The code competition puts your machine learning skills to the test, to see who can build the most accurate forecasting models to predict daily digital engagement for every active player. You’ll have until July 31st to build your models and then be evaluated on a future time frame, which will determine the winners. For data visualization and exploration experts out there, the explainability prizes give you an opportunity to analyze more broadly which factors, even those outside of what we’re providing directly, most influence digital engagement. You’ll be evaluated on how well you can use what the data is telling you to support your findings.
And if you’re looking to get started, we’ve provided an introductory video and some notebook tutorials, including a starting point for harnessing the power of Vertex AI through tools including Cloud Notebooks, Explainable AI, and Vizier.
With the second half of the season upon us, it’s an exciting time to be an MLB fan. With this Kaggle competition, it’s also a perfect opportunity to use data science to help understand baseball fandom and potentially earn some of your own accolades in the process. Step up to the plate!
Major League Baseball trademarks and copyrights are used with permission of Major League Baseball. Visit MLB.com.
Recommendations for Modelling SAP Data inside BigQuery

8421
Of your peers have already read this article.
4:00 Minutes
The most insightful time you'll spend today!
Over the past few years, many organizations have experienced the benefits of migrating their SAP solutions to Google Cloud. But this migration can do more than reduce IT maintenance costs and make data more secure. By leveraging BigQuery, SAP customers can complement their SAP investments and gain fresh insights by consolidating enterprise data and easily extending it with powerful datasets and machine learning from Google.
BigQuery is a leading cloud data warehouse, fully managed and serverless, and allows for massive scale, supporting petabyte-scale queries at super-fast speeds. It can easily combine SAP data with additional data sources, such as Google Analytics or Salesforce, and its built-in machine learning lets users operationalize machine learning models using standard SQL — all at a comparatively low cost.
If your SAP-powered organization is looking to supercharge its analytics with the strength of BigQuery, read on for considerations and recommendations for modeling with SAP data. These guidelines are based on our real-world implementation experience with customers and can serve as a roadmap to the analytics capabilities your business needs.
Considerations for data replication
Like most technology journeys, this one should start with a business objective. Keeping your intended business value and goals in mind is critical to making the right decisions in the early steps of the design process.
When it comes to replicating the data from an SAP system into BigQuery, there are multiple ways to do it successfully. Decide which method will work best for your organization by answering these questions:
- Does your business need real-time data? Will you need to time travel into past data?
- Which external datasets will you need to join with the replicated data?
- Are the source structures or business logic likely to change? Will you be migrating the SAP source systems any time soon? For instance, will you be moving from SAP ECC to SAP S/4HANA?
You’ll also need to determine whether replication should be done on a table-by-table basis or whether your team can source from pre-built logic. This decision, along with other considerations such as licensing, will influence which replication tool you should use.
Replicating on a table-by-table basis
Replicating tables, especially standard tables in their raw form, allows sources to be reused and ensures more stability of the source structure and functional output. For example, the SAP table for sales order headers (VBAK) is very unlikely to change its structure across different versions of SAP, and the logic that writes to it is also unlikely to change in a way that affects a replicated table.
Something else to consider: Reconciliation between the source system and the landing table in BigQuery is linear when comparing raw tables, which helps avoid issues in consolidation exercises during critical business processes, such as period-end closing. Since replicated tables aren’t aggregated or subject to process-specific data transformation, the same replicated columns can be reused in different BigQuery views. You can, for instance, replicate the MARA table (the material master) once and use it in as many models as needed.
Replicating pre-built logic
If you replicate pre-built models, such as those from SAP extractors or CDS views, you don’t need to build the logic in BigQuery, since you’re using existing logic. Some of these extraction objects have embedded delta mechanisms, which may complement a replication tool that can’t handle deltas. This will save initial development time, but it can also lead to challenges if you create new columns, or if customizations or upgrades change the logic behind the extraction.
It’s also important to note that different extraction processes may transform and load the same source columns multiple times, which creates redundancy in BigQuery and can lead to higher maintenance needs and costs. However, replicating pre-built models may still be a good choice, since doing so can be especially useful for logic that tends to be immutable, such as flattening a hierarchy, or logic that is highly complex.
How you approach replication will also depend on your long-term plans and other key factors — for example, the availability (and curiosity) of your developers, and the time or effort they can put into applying their SQL knowledge to a new data warehouse.
With either replication approach, bear in mind when designing your replication process that BigQuery is meant to be an append-always database — so post-processing of data and changes will be required in both cases.
Processing data changes
The replication tool you choose will also determine how data changes are captured (known as CDC – change data capture). If the replication tool allows for it (for example as SAP SLT does) the same patterns described in the CDC with BigQuery documentation also apply to SAP data.
Because some data, like transactions, are known to be less static than others (e.g., master data), you need to decide what should be scanned in real time, what will require immediate consistency, and what can be processed in batches to manage costs. This decision will be based on the reporting needs from the business.
Consider the SAP table BUT000, containing our example master data for business partners, where we have replicated changes from an SAP ERP system:
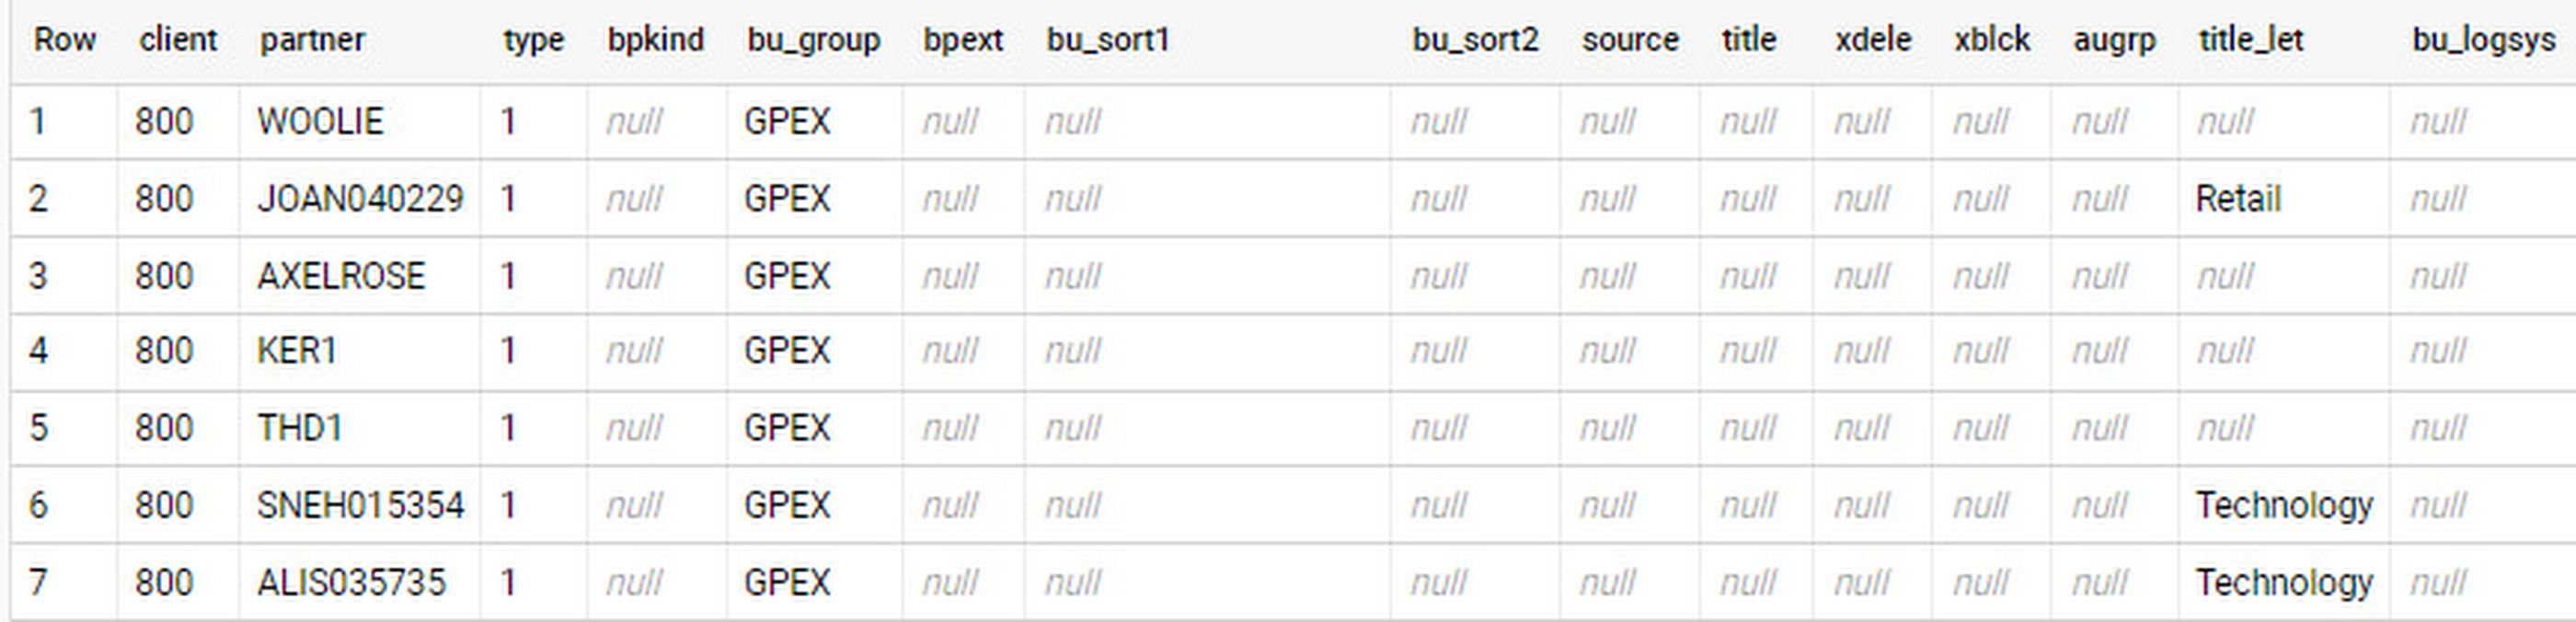
In an append-always replication in BigQuery, all updates are received as new records. For example, deleting a record in the source will be represented as a new record in BigQuery with a deletion flag. This applies to whether the records are coming from raw tables like BUT000 itself or pre-aggregated data, as from a BW extractor or a CDS view.
Let’s take a closer look at data coming particularly from the partners “LUCIA” and “RIZ”. The operation flag tells us whether the new record in BigQuery is an insert (I), update (U) or deletion (D), while the timestamps help us identify the latest version of our business partner.
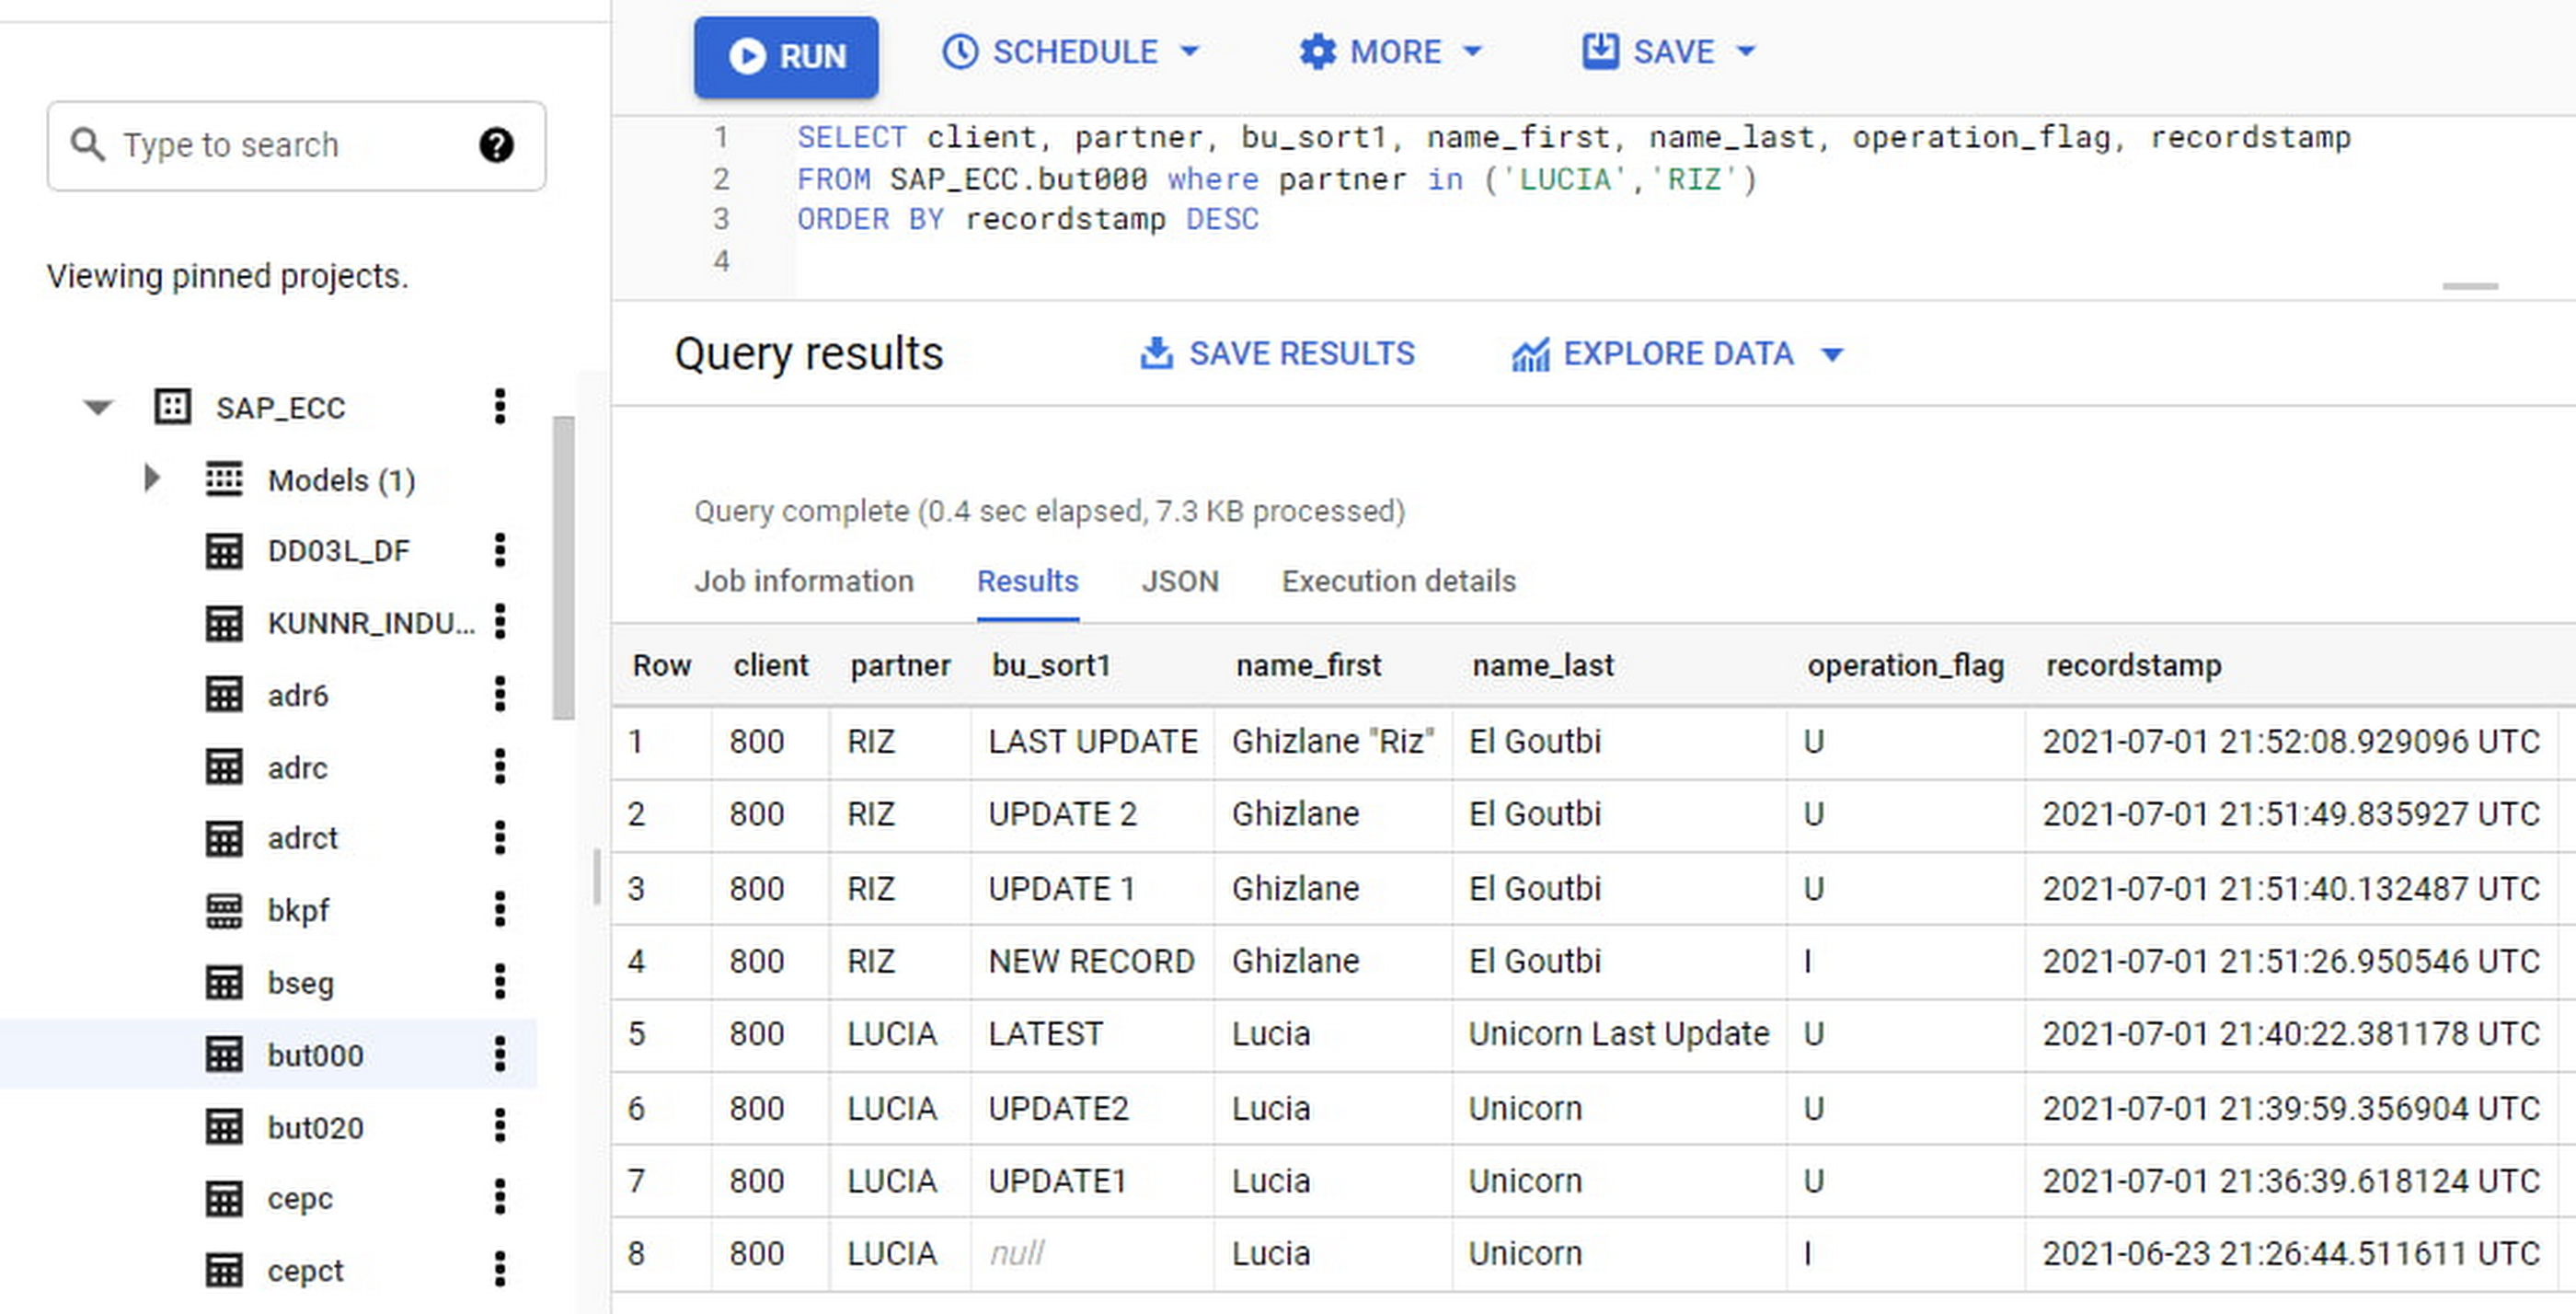
If we want to find the latest updated record for the partners LUCIA and RIZ, this is what the query would look like:
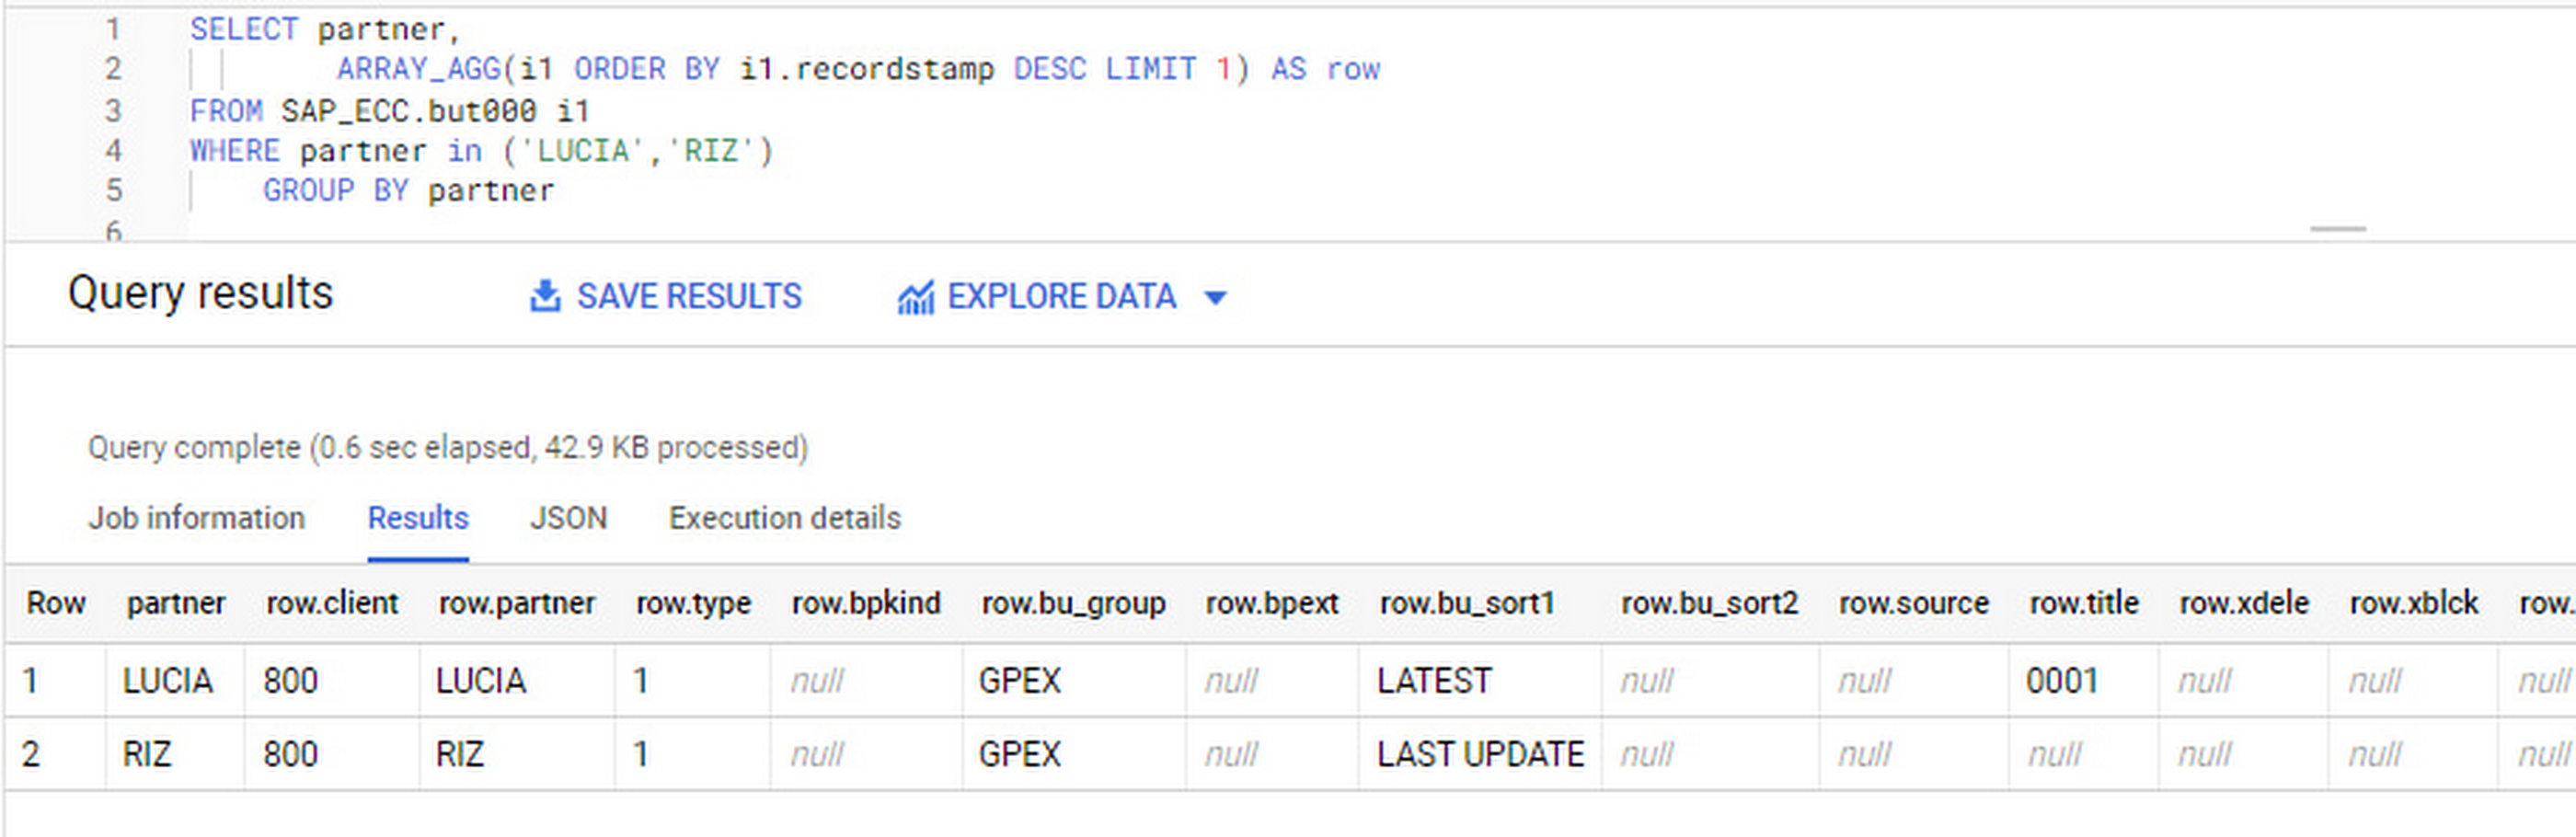
SELECT partner,ARRAY_AGG(i1 ORDER BY i1.recordstamp DESC LIMIT 1) AS rowFROM SAP_ECC.but000 i1WHERE partner in ('LUCIA','RIZ')GROUP BY partner
With the following result:
After identifying stale records for “LUCIA” and “RIZ” business partners, we can proceed to deleting all stale records for “LUCIA” if we do not want to retain the history. In this example, we are using a different table to which the same replication has been done, for the purpose of comparison and to check that all stale records have been deleted for the selection made and that we only kept last updated records. For example:
DELETE SAP_HANA.but000 i1WHEREi1.recordstamp < TIMESTAMP_SUB(CURRENT_TIMESTAMP(), INTERVAL 3 HOUR) ANDi1.recordstamp < (SELECT MAX(recordstamp) FROM SAP_HANA.but000 i2WHEREi1.partner = i2.partnerand partner="LUCIA")
You can also use the following query to retrieve stale records for “LUCIA” partner before moving forward with deletion
SELECT partner, operation_flag, recordstamp FROM SAP_HANA.but000 i1WHEREi1.recordstamp < TIMESTAMP_SUB(CURRENT_TIMESTAMP(), INTERVAL 3 HOUR)ANDi1.recordstamp < (SELECT MAX(recordstamp) FROM SAP_HANA.but000 i2WHEREi1.partner = i2.partnerand partner="LUCIA")
Which produces all of the records, except the latest update:

Partitioning and clustering
To limit the number of records scanned in a query, save on cost and achieve the best performance possible, you’ll need to take two important steps: determine partitions and create clusters.
Partitioning
A partitioned table is one that’s divided into segments, called partitions, which make it easier to manage and query your data. Dividing a large table into smaller partitions improves query performance and controls costs because it reduces the number of bytes read by a query.
You can partition BigQuery tables by:
- Time-unit column: Tables are partitioned based on a “timestamp,” “date,” or “datetime” column in the table.
- Ingestion time: Tables are partitioned based on the timestamp recorded when BigQuery ingested the data.
- Integer range: Tables are partitioned based on an integer column.
Partitions are enabled when the table is created, as in the example below. A great tip is to always include the partition filter as shown on the left-hand side of the query.

Clustering
Clustering can be created on top of partitioned tables by applying the fields that are likely to be used for filtering. When you create a clustered table in BigQuery, the table data is automatically organized based on the contents of one or more of the columns in the table’s schema. The columns you specify are then used to colocate related data.
Clustering can improve the performance of certain query types — for example, queries that use filter clauses or that aggregate data. It makes a lot of sense to use them for large tables such as ACDOCA, the table for accounting documents in SAP S/4HANA. In this case, the timestamp could be used for partitioning, and common filtering fields such as the ledger, company code, and fiscal year could be used to define the clusters.
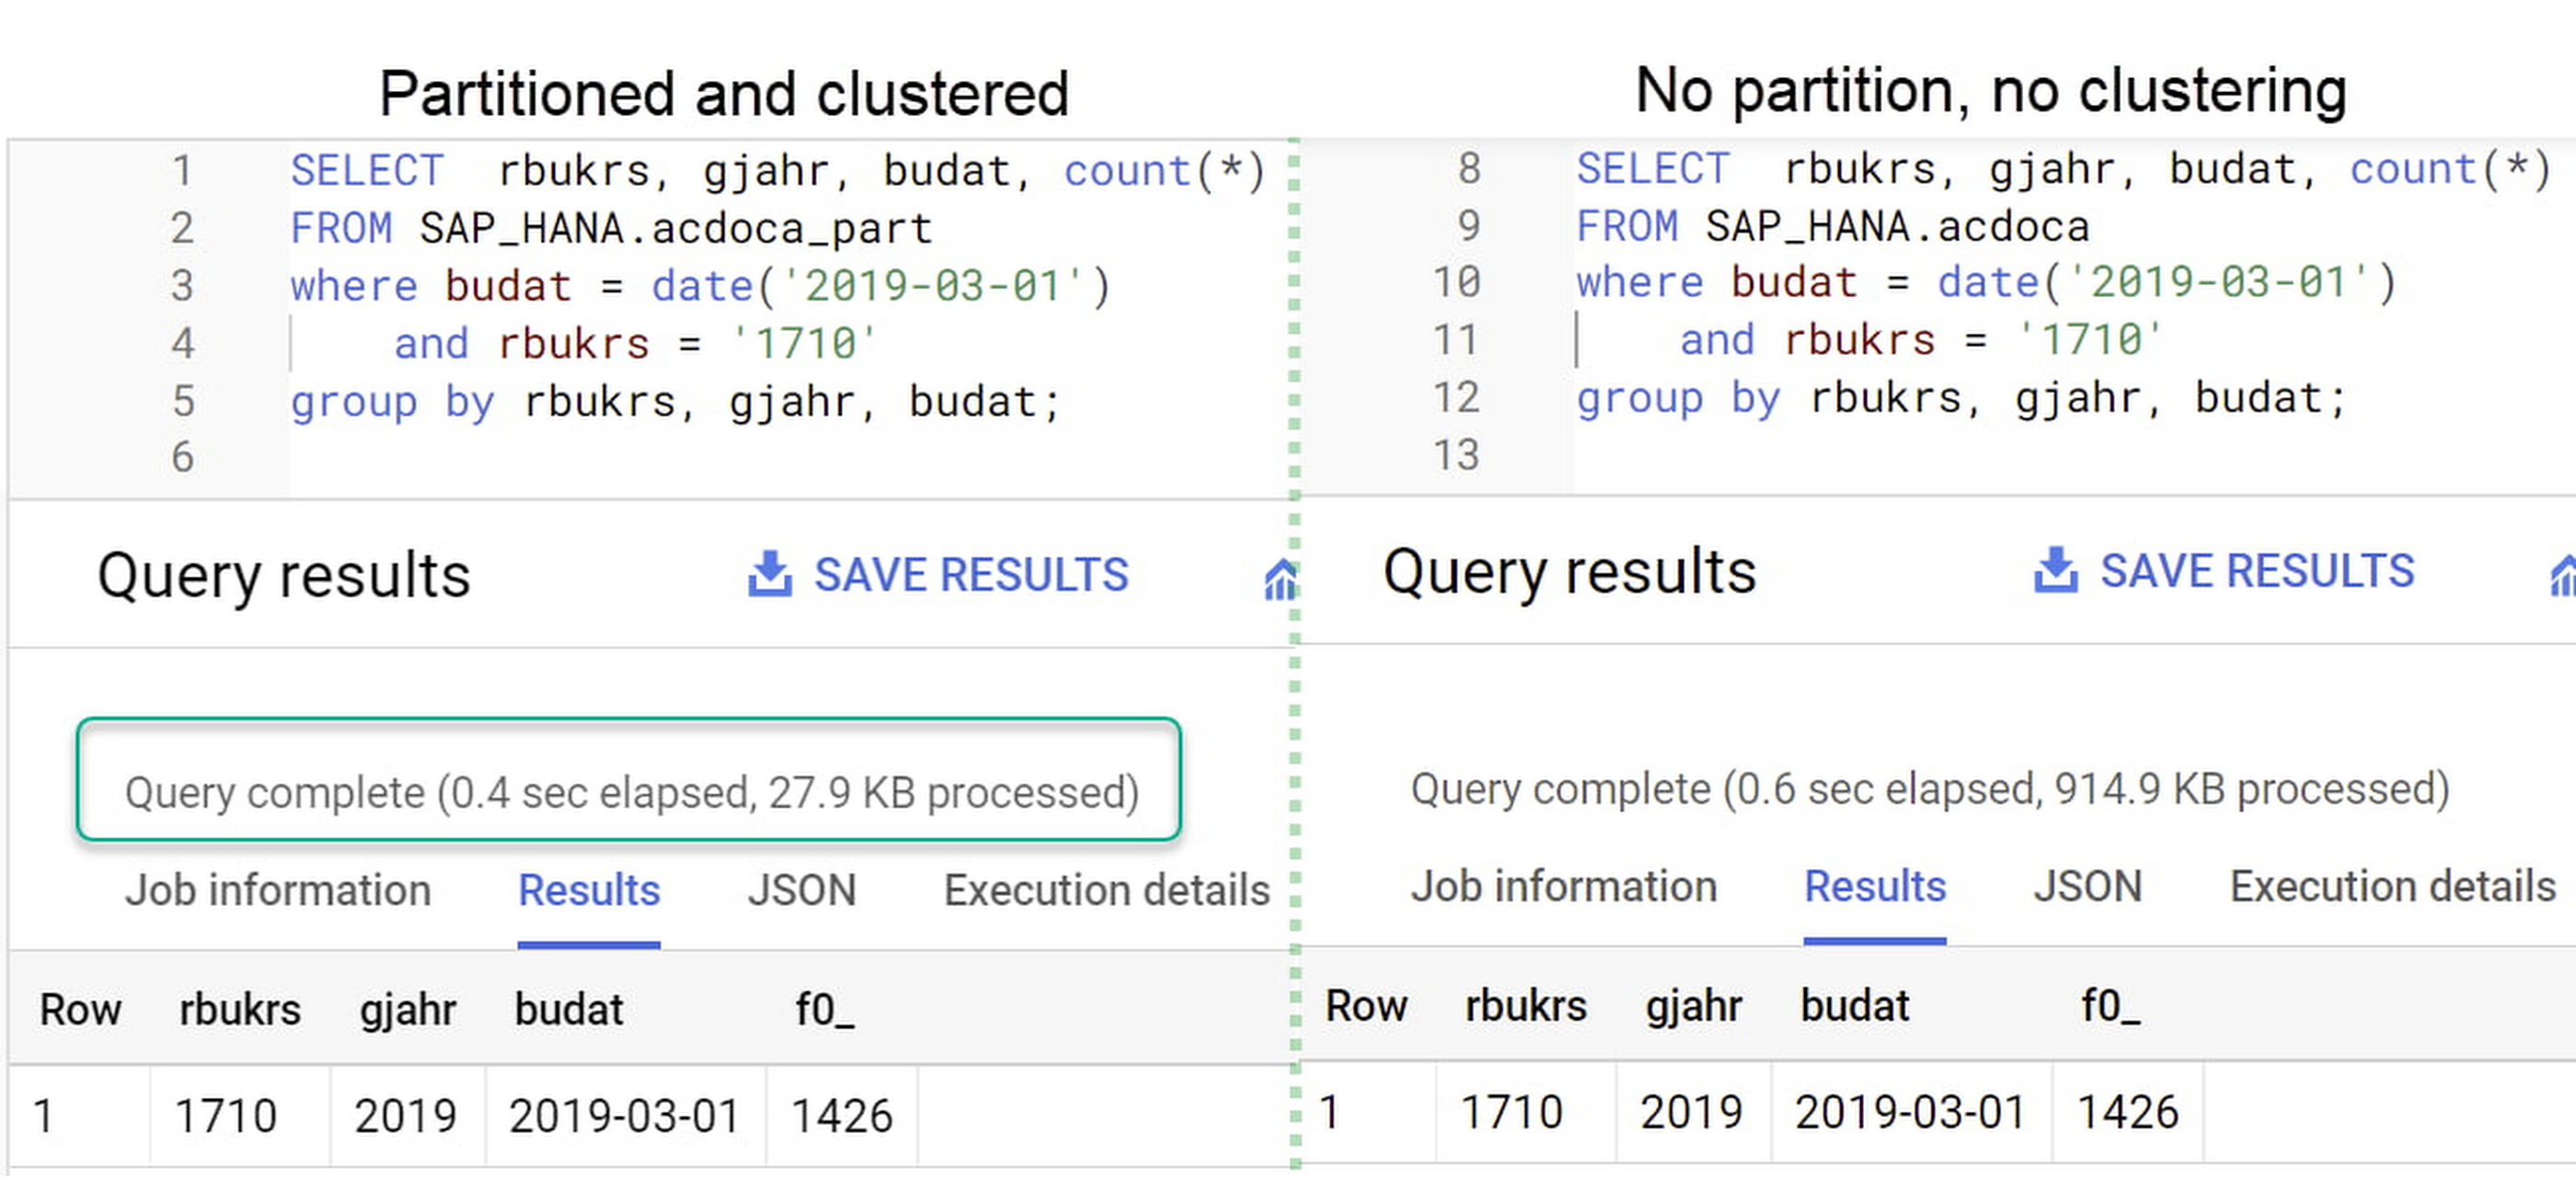
A great feature is that BigQuery will also periodically recluster the data automatically.
Materialized views
In BigQuery, materialized views are precomputed views that periodically cache the results of a query for better performance and efficiency. BigQuery uses precomputed results from materialized views and, whenever possible, reads only the delta changes from the base table to compute up-to-date results quickly. Materialized views can be queried directly or can be used by the BigQuery optimizer to process queries to the base table.
Queries that use materialized views are generally completed faster and consume fewer resources than queries that retrieve the same data only from the base table. If workload performance is an issue, materialized views can significantly improve the performance of workloads that have common and repeated queries. While materialized views currently only support single tables, they are very useful common and frequent aggregations like stock levels or order fulfillment.
Further tips on performance optimization while creating select statements can be found in the documentation for optimizing query computation.
Deployment pipeline and security
For most of the work you’ll do in BigQuery, you’ll normally have at least two delivery pipelines running — one for the actual objects in BigQuery and the other to keep the data staging, transforming, and updated as intended within the change-data-capture flows. Note that you can use most existing tools for your Continuous Integration / Continuous Deployment (CI/CD) pipeline — one of the benefits of using an open system like BigQuery. But, if your organization is new to CI/CD pipelines, this is a great opportunity to gradually gain experience. A good place to start is to read our guide for setting up a CI/CD pipeline for your data-processing workflow.
When it comes to access and security, most end-users will only have access to the final version of the BigQuery views. While row and column-level security can be applied, as in the SAP source system, separation of concerns can be taken to the next level by splitting your data across different Google Cloud projects and BigQuery datasets. While it’s easy to replicate data and structures across your datasets, it’s a good idea to define the requirements and naming conventions early in the design process so you set it up properly from the start.
Start driving faster and more insightful analytics
The best piece of advice we can give you is this: Try it yourself. Anyone with SQL knowledge can get started using the free BigQuery tier. New customers get $300 in free credits to spend on Google Cloud during the first 90 days. All customers get 10 GB storage and up to 1 TB queries/month, completely free of charge. In addition to discovering the massive processing capabilities, embedded machine learning, multiple integration tools, and cost benefits, you’ll soon discover how BigQuery can simplify your analytics tasks.
If you need additional assistance, our Google Cloud Professional Services Organization (PSO) and Customer Engineers will be happy to help show you the best path forward for your organization. For anything else, contact us at cloud.google.com/contact.
10 Reasons that Make Google Cloud the Champion of IaaS

10405
Of your peers have already read this article.
5:00 Minutes
The most insightful time you'll spend today!
When you choose to run your business on Google Cloud you benefit from the same planet-scale infrastructure that powers Google’s products such as Maps, YouTube, and Workspace.
We have picked 10 ways in which Google Cloud Infrastructure services outshine alternatives in the market in how they simplify your operations, save money, and secure your data.
1. Custom Machine Types means no wasted resources
Compute Engine offers predefined machine types that you can use when you create a VM instance. A predefined machine type has a preset number of vCPUs and a preset amount of memory; each type is billed at a set price as described on the Compute Engine pricing page.
If predefined machine types don’t meet your needs, you can create a VM instance with a custom number of vCPUs and custom amount of memory, effectively building a custom machine type. Custom machine types are available only for general-purpose machine families. When you create a custom machine type, you are deploying a custom machine type from the E2, N2, N2D, or N1 machine family on GCP. No other leading cloud vendor offers custom machine types so extensively.
Custom machine types are a good idea for workloads that aren’t a good fit for the predefined machine types and for workloads that require more processing power or memory but don’t need all of the upgrades provided by the next machine type level. This translates into lower operating costs. They are also useful for controlling software licensing costs that are based on the number of underlying compute cores.
Jeremy Lloyd, Infrastructure and Application Modernization Lead at Appsbroker, a Google partner:
“Custom machine types coupled with Google’s StratoZone data center discovery tool provides Appsbroker with the flexibility we need to provide cost efficient virtual machines matched to a virtual machine’s actual utilization. As a result, we are able to keep our customers’ operating costs low while still providing the ability to scale as needed.”
2. Compute Engine Virtual Machines are optimized for scale-out workloads
For scale-out workloads, T2D, the first instance type in the Tau VM family, is based on 3rd Gen AMD EPYC processors and leapfrogs VMs for scale-out workloads of any leading public cloud provider today, both in terms of performance and price-performance. Tau VMs offer 56% higher absolute performance and 42% higher price-performance compared to general-purpose VMs from any leading public cloud vendor (source). The x86 compatibility provided by these AMD EPYC processor-based VMs gives you market-leading performance improvements and cost savings, without having to port your applications to a new processor architecture. Sign up here if you are interested in trying out T2D instances in Preview.
For SAP HANA, Google Cloud has demonstrated with SAP how we can run the world’s largest scale-out HANA system in the public cloud (96TB). With such innovation, you are covered as your business grows exponentially.
3. Largest single node GPU-enabled VM
Google is the only public cloud provider to offer up to 16 NVIDIA A100 GPUs in a single VM, making it possible to train very large AI models. Users can start with one NVIDIA A100 GPU and scale to 16 GPUs without configuring multiple VMs for single-node ML training, without crossing the VM layer.
Additionally, customers can choose smaller GPU configurations—1, 2, 4 and 8 GPUs per VM—providing the flexibility to scale their workload as needed.
The A2 VM family was designed to meet today’s most demanding applications—workloads like CUDA-enabled machine learning (ML) training and inference, for example. This family is built on the A100 GPU which offers up to 20x the compute performance compared to the previous generation GPU and comes with 40 GB of high-performance HBM2 GPU memory. To speed up multi-GPU workloads, the A2 VMs use NVIDIA’s HGX A100 systems to offer high-speed NVLink GPU-to-GPU bandwidth that delivers up to 600 GB/s. A2 VMs come with up to 96 Intel Cascade Lake vCPUs, optional Local SSD for workloads requiring faster data feeds into the GPUs and up to 100 Gbps of networking. A2 VMs provide full vNUMA transparency into the architecture of underlying GPU server platforms, enabling advanced performance tuning. Google Cloud offers these GPUs globally.
4. Non-disruptive maintenance means you worry less about planned downtime
Compute Engine offers live migration (non-disruptive maintenance) to keep your virtual machine instances running even when a host system event, such as a software or hardware update, occurs. Google’s Compute Engine live migrates your running instances to another host in the same zone without requiring your VMs to be rebooted. Live migration enables Google to perform maintenance that is integral to keeping infrastructure protected and reliable without interrupting any of your VMs. When a VM is scheduled to be live-migrated, Google provides a notification to the guest that a migration is imminent.
Live migration keeps your instances running during:
- Regular infrastructure maintenance and upgrades
- Network and power grid maintenance in the data centers
- Failed hardware such as memory, CPU, network interface cards, disks, power, and so on. This is done on a best-effort basis; if a hardware component fails completely or otherwise prevents live migration, the VM crashes and restarts automatically and a hostError is logged.
- Host OS and BIOS upgrades
- Security-related updates
- System configuration changes, including changing the size of the host root partition, for storage of the host image and packages
Live migration does not change any attributes or properties of the VM itself. The live migration process transfers a running VM from one host machine to another host machine within the same zone. All VM properties and attributes remain unchanged, including internal and external IP addresses, instance metadata, block storage data and volumes, OS and application state, network settings, network connections, and so on. This has the benefit of reducing operational and maintenance overhead, helps you build a more robust security posture where infrastructure can be consciously revamped from a known good state and minimizes risks for advanced persistent threats.
Refer to Lessons learned from a year of using live migration in production on Google Cloud from the Google engineering team.
5. Trusted Computing: Shielded VMs guard you against advanced, persistent attacks
Establishing trust in your environment is multifaceted, involving hardware and firmware, as well as host and guest operating systems. Unfortunately, threats like boot malware or firmware rootkits can stay undetected for a long time, and an infected virtual machine can continue to boot in a compromised state even after you’ve installed legitimate software.
Shielded VMs can help you protect your system from attack vectors like:
- Malicious guest OS firmware, including malicious UEFI extensions
- Boot and kernel vulnerabilities in the guest OS
- Malicious insiders within your organization
To guard against these kinds of advanced persistent attacks, Shielded VMs use:
- Unified Extensible Firmware Interface (UEFI) BIOS: Helps ensure that firmware is signed and verified
- Secure and Measured Boot: Helps ensure that a VM boots an expected, healthy kernel
- Virtual Trusted Platform Module (vTPM): Establishes root-of-trust, underpins Measured Boot, and prevents exfiltration of vTPM-sealed secrets
- Integrity Monitoring: Provides tamper-evident logging, integrated with Stackdriver, to help you quickly identify and remediate changes to a known integrity state
The Google approach allows customers to deploy Shielded VMs with only a simple click, thereby easing implementation.
6. Confidential Computing encrypts data while in use
Google Cloud was a founding member of the Confidential Computing Consortium. Along with encryption of data in transit and at rest using customer-managed encryption keys (CMEK) and customer-supplied encryption keys (CSEK), Confidential VM adds a “third pillar” to the end-to-end encryption story by encrypting data while in use. Confidential Computing uses processor-based technology that allows data to be encrypted in use while it is being processed in the public cloud. Confidential VM allows you to to encrypt memory in use on a Google Compute Engine VM by checking a single checkbox.
All Confidential VMs support the previously mentioned Shielded VM features under the covers—you can think of Shielded VM as helping to address VM integrity, while Confidential VM addresses the memory encryption aspect which relies on CPU features. With the confidential execution environments provided by Confidential VM and AMD Secure Encrypted Virtualization (SEV), Google Cloud keeps customers’ sensitive code and other data encrypted in memory during processing. Google does not have access to the encryption keys. In addition, Confidential VM can help alleviate concerns about risk related to either dependency on Google infrastructure or Google insiders’ access to customer data in the clear.
See what Google Cloud partners say about Confidential Computing here.
7. Advanced networking delivers full-stack networking and security services with fast, consistent, and scalable performance
Google Cloud’s network delivers low latency, reduces operational costs and ensures business continuity, enabling organizations to seamlessly scale up or down in any region to meet business needs. Our planet-scale network uses advanced software-defined networking and security with edge caching services to deliver fast, consistent, and scalable performance. With 28 regions, 85 zones, and 146 PoPs connected by 16 subsea fiber cables around the world, Google Cloud’s network offers a full stack of layer 1 to layer 7 services for enterprises to run their workloads anywhere. Enterprises can be assured that they have best-in-class networking and security services connecting their VMs, containers, and bare metal resources in hybrid and multi-cloud environments with simplicity, visibility, and control.
Google Cloud’s network has protected customers from one of the world’s largest DDoS attacks at 2.54 Tbps. With our multi-layer security architecture and products such as Cloud Armor, our customers ran their business with no disruptions. Furthermore, our recent integration of Cloud Armor with reCAPTCHA Enterprise adds best-in-class bot and fraud management to prevent volumetric attacks. Cloud Armor is deployed with our Cloud Load Balancer and Cloud CDN, extending the secure benefits at the network edge for traffic coming into Google Cloud so customers have security, performance, and reliability all built in. Furthermore, we are excited to offer Cloud IDS in preview, which was co-developed with security industry leader, Palo Alto Networks, to run natively in Google Cloud.
Our advanced networking capabilities also extends to GKE and Anthos networking. With the GKE Gateway controller, customers can manage internal and external HTTPS load balancing for a GKE cluster or a fleet of GKE clusters with multi-tenancy while maintaining centralized admin policy and control. Unlike other Kubernetes offerings, we offer eBPF dataplane which brings powerful tooling such as Kubernetes network policy and logging to GKE. eBPF is known to kernel engineers as a “superpower” for its unique architecture to load and unload modules in kernel space, and now this capability is built in with Google Cloud networking.
For observability and monitoring, our customers deploy Network Intelligence Center, Google Cloud’s comprehensive network monitoring, verification and optimization platform. With four key modules in Network Intelligence Center, and several more to come, we are working towards realizing our vision of proactive network operations that can predict and heal network failures, driven by AI/ML recommendations and remediation. Network Intelligence Center provides unmatched visibility into your network in the cloud along with proactive network verification. Centralized monitoring cuts down troubleshooting time and effort, increases network security and improves the overall user experience.
8. Regional Persistent Disk for High Availability
Regional Persistent Disk is a storage option that provides synchronous replication of data between two zones in a region. Regional Persistent Disks can be a great building block if you need to ensure high availability of your critical applications as they offer cost-effective durable storage and replication of data between two zones in the same region.
Regional Persistent Disks are also easy to set up within the Google Cloud Console. If you are designing robust systems or high availability services on Compute Engine, Regional Persistent Disks combined with other best practices such as backing up your data using snapshots enable you to build an infrastructure that is highly available and recoverable in a disaster. Regional Persistent Disks are also designed to work with regional managed instance groups. In the unlikely event of a zonal outage, Regional Persistent Disks allow continued I/O through failover of your workloads to another zone. Regional Persistent Disks can help meet zero RPO and near-zero RTO requirements and other stringent SLAs that your critical applications might require by maximizing application availability and protection of data during events such as host/VM failures and zonal outages.
9. Cloud Storage’s single namespace for dual-region and multi-region means managing regional replication is incredibly simple
Similar to how Persistent Disk makes data more available by replicating data across zones, Cloud Storage provides similar benefits for object storage. Cloud Storage within a region is cross-zone by definition, reducing the risk that a zonal outage would take down your application. Cloud Storage adds to this by also providing a cross-region option that can protect against a regional outage and gets your data closer to distributed users. This comes in the form of Dual-region or Multi-region settings for a bucket. These are the simplest to implement cross-region replication offerings in the industry—just a simple button or API call to enable them. In addition to being simple to implement, they offer an added advantage of using a single bucket name that spans regions.
This is unique in the industry. Competitive offerings currently require setting up and managing two distinct buckets, one in each region and they don’t offer the strong consistency properties Cloud Storage offers across regions. Operations and app development are burdened by this design. Google’s single namespace approach dramatically simplifies application development (the app runs on single region or dual/multi-region without any changes), and provides simpler application restarts and testing for DR.
10. Predictive autoscaling
Customers use predictive autoscaling to improve response times for applications with long initialization times or for applications with workloads that vary predictably with daily or weekly cycles. When you enable predictive autoscaling, Compute Engine forecasts future load based on your Managed Instance Group’s history and scales out the MIG’s in advance of predicted load, so that new instances are ready to serve when the load arrives. Without predictive autoscaling, an autoscaler can only scale a group reactively, based on observed changes in load in real time.
With predictive autoscaling enabled, the autoscaler works with real-time data as well as with historical data to cover both the current and forecasted load. Forecasts are refreshed every few minutes (faster than competing clouds) and consider daily and weekly seasonality, leading to more accurate forecasts of load patterns.
For more information, see How predictive autoscaling works and Checking if predictive autoscaling is suitable for your workload.
These are just a few examples of customer-centric innovation that set Google Cloud infrastructure apart. Bring your applications and let the platform work for you.
Get started by learning about your options for migration, or talk to our sales team to join the thousands of customers who have embarked upon this journey.
Acknowledgement
Special thanks to Dheeraj Konidena (Google) for contributing to this article.
Candidate360: Google Cloud and Deloitte Product Improves Universities’ Enrollment and Admission Processes

4807
Of your peers have already read this article.
2:00 Minutes
The most insightful time you'll spend today!
Given the May 1 deadline for students to enroll, colleges and universities have been carefully watching the numbers of students who put down deposits and commit to a school. Like nearly every other sector in the U.S., colleges and universities have been hit hard by the pandemic and economic downturn, making enrollment numbers more important than ever to maintain financial health and meet student body goals. Technology and AI-based models are providing a way for institutions to manage their admissions data efficiently and cost-effectively.
For example, an admissions officer may want to offset drops in international or out-of-state enrollment by attracting local talent so they can achieve their target class profile. Additionally, institutions have sought to increase the availability and access of higher ed and are intentionally recruiting more low-income and underrepresented populations. New technologies allow admissions officers to have a stronger grasp of the incoming class’ details. With the press of a button, users can switch between overall, in-state, out-of-state, and international enrollment figures. The “How Do Regions Compare to Last Year” tile lets users view the percentage of change and the total number of candidates by region, comparing 2020 and 2021 side-by-side. With access to data, regional recruiters can focus on individual candidates and develop a plan to change the numbers.
An innovative enrollment strategy at MSU
Michigan State University was looking to improve how they managed the recruiting process. They implemented an enrollment strategy that saw their out-of-state enrollment increase by over 20% and generate $5M in additional net tuition revenue in a single year. “We knew we needed better real-time and predictive insights about our enrollment pipeline, and we understood the value of bringing in external data on prospects, but we couldn’t do that by ourselves.
The solution really helped us be innovative with our analytics and improve our enrollment outcomes,” said someone close to the project at Michigan State University.
Data-driven insights support informed enrollment decisions
Student admissions and marketing groups are turning to Google Cloud and Deloitte to help support their enrollment decisions with predictive, actionable insights across recruiting and admissions processes. The partnership resulted in Candidate360, a solution that helps institutions process and analyze large amounts of data and develop meaningful insights to support their enrollment goals and mission. Part of Google’s Student Success Services offerings, Candidate360 uses artificial intelligence and predictive analytics to help higher education institutions improve enrollment and matriculation, as well as optimize financial aid decisions.
With nine AI/ML models, Candidate360’s capabilities help university leaders, enrollment teams and recruiters do things like:
- Identify regions with clusters of candidates or see dips in application numbers
- Deploy marketing resources and admissions staff to the right geographic areas
- Understand applicants’ needs in terms of academics, safety, and social activities
- Make intelligent financial aid decisions to recruit and retain talented students from underrepresented communities
- Respond faster to the students who are most likely to be accepted and then go on to enroll, stay enrolled, and graduate
- Work towards the ideal class composition and increase competitiveness with peer institutions
Enhancing the student experience
Enrollment is the first key touchpoint with incoming students, and tools like Candidate360 can help institutions build a student preferences profile throughout the application process. They can understand each student’s prospective major, areas of interest, dream job, and more, allowing colleges and universities to personalize recommendations and advising for enrolled students.
With integrated toolsets, Candidate360 and Google Cloud’s Student Success Services can help colleges and universities emerge from the pandemic stronger than ever.
To see a demonstration of Candidate360 in action, contact our sales team.

4657
Of your peers have already listened to this podcast
30:30 Minutes
The most insightful time you'll spend today!
Why it’s Easier Than Ever for Developers to Break Into Machine Learning and Data Science
The game of baseball has no shortage of statistics — from batting average to exit velocity, strikeouts to wins above replacement. Among all sports, Major League Baseball (MLB) arguably contains the most analytical and data-driven participants and fan base. Subconsciously or viscerally, players and managers on the field and those following from anywhere are constantly assessing and making decisions based off of game play trends and expectations — whether a batter will come through with a hit in an important situation, when a pitcher should be pulled. Less analyzed, however, is what leads fans to become engaged with certain players or teams, and what factors drive their love of the game. This is the motivation behind the problem being posed by Major League Baseball in their Kaggle competition for Player Digital Engagement Forecasting. Can you use machine learning to deconstruct baseball fandom?
This competition asks you to predict measures of digital engagement for each active player on a daily basis during the MLB season. So, how large was the surge in fan interest after Joe Musgrove threw the first no-hitter in Padres history? Is Shohei Ohtani’s engagement higher when he pitches well, when he hits a monster home run…or when he does both? You’re provided a wealth of game, team and player information – detailed stats, awards, rosters, and transaction information – as well as social and digital engagement data as your inputs. Data scientists will recognize this as an exciting forecasting problem with both traditional regression and time series components, where having this input data just prior to the prediction date is critical to determining which players will receive the most engagement.
With so many variables in the game, there are an endless number of vectors which could possibly influence fan engagement. Eleven-time All-Star Miguel Cabrera delighted fans by hitting the first home run of the season – in the snow! Occasionally a lesser-known player like Musgrove or Carlos Rodón “wins the day” with an unlikely no-hitter. And sometimes just getting traded to an iconic franchise like the Yankees generates a ton of fan interest, like it did for Rougned Odor in early April.
As these examples show, a player’s digital engagement can be pretty dynamic during the season, with many different potential contributors to who is “trending” on a given day. How can you use data to uncover which factors are the most influential of engagement with each player’s digital content?
Ready to play ball? Check out the competition on Kaggle for all the details. $50,000 in prizes is up for grabs in two prize categories. The code competition puts your machine learning skills to the test, to see who can build the most accurate forecasting models to predict daily digital engagement for every active player. You’ll have until July 31st to build your models and then be evaluated on a future time frame, which will determine the winners. For data visualization and exploration experts out there, the explainability prizes give you an opportunity to analyze more broadly which factors, even those outside of what we’re providing directly, most influence digital engagement. You’ll be evaluated on how well you can use what the data is telling you to support your findings.
And if you’re looking to get started, we’ve provided an introductory video and some notebook tutorials, including a starting point for harnessing the power of Vertex AI through tools including Cloud Notebooks, Explainable AI, and Vizier.
With the second half of the season upon us, it’s an exciting time to be an MLB fan. With this Kaggle competition, it’s also a perfect opportunity to use data science to help understand baseball fandom and potentially earn some of your own accolades in the process. Step up to the plate!
Major League Baseball trademarks and copyrights are used with permission of Major League Baseball. Visit MLB.com.
How TeamSnap Improved Return on Ad Spend Significantly

5607
Of your peers have already read this article.
3:30 Minutes
The most insightful time you'll spend today!
Anyone who has ever coached or played on a sports team, or had a child involved in sports, knows how difficult scheduling and logistics can be. From game and practice schedules, to uniforms and who’s bringing the snacks, it can be a lot for coaches, administrators, parents, and players to manage.
It’s no wonder that TeamSnap, a sports team, club, and tournament management app, has exploded in popularity worldwide. By syncing events to everyone’s personal calendars and providing messaging and payment tracking, TeamSnap makes communication and organization easy.
TeamSnap markets its app to coaches, players, and clubs via targeted YouTube ads. It also uses Google AdWords and DoubleClick to advertise on search results and run programmatic campaigns. These methods have been highly effective, helping TeamSnap grow to millions of users worldwide and become one of the most popular apps in the iOS app store.
As its business and data grew, TeamSnap was challenged to track ROI and measure the customer journey across channels and devices over time. The company’s marketing budget grew quickly, making it even more important to spend wisely. With data in Google Analytics 360, DoubleClick Campaign Manager, Google AdWords, and Salesforce, TeamSnap needed a way to link and correlate those data sources in a scalable, timely, and cost-effective way to understand the true impact of its digital marketing across websites and mobile apps.
To avoid the painstaking manual process of pulling data from multiple sources, TeamSnap began using Google Analytics 360, which integrates with Google BigQuery, to provide a fully managed big data analysis service. TeamSnap analyzes the data using Tableau, which connects directly to Google BigQuery for fast analytics and helps the company share and collaborate on that information with self-service ease.
The combination allows TeamSnap to easily track the activity of millions of users with self-service ease, without worrying about the scalability or availability of the big data platform.
“Before Google Analytics 360, Google BigQuery, and Tableau, tracking our return on ad spend was difficult because we had so much data,” says Ken McDonald, Chief Growth Officer at TeamSnap. “We didn’t always have insights to make the best choices. We don’t have that problem anymore because we’ve moved to real-time reporting. We find additional revenue growth opportunities almost daily.”
Making Ad Dollars Work Harder
TeamSnap now automatically imports unsampled Google Analytics 360 logs into the Google BigQuery data warehouse. To import data from other sources such as Google AdWords, DoubleClick, and YouTube, TeamSnap uses Google BigQuery Data Transfer Service. With all relevant data consolidated in Google BigQuery, TeamSnap can use Tableau to perform advanced analytics on its digital marketing, executing ad-hoc analyses in seconds, while eliminating data sampling issues, to improve accuracy. These analyses can also be reused and shared with internal and external stakeholders via Tableau Online, promoting governed reuse and consistency.
“Using Google Analytics 360 and Google BigQuery with Tableau to track our return on ad spend is ideal,” says Ken. “It’s easy to use SQL to query the data or explore it with drag-and-drop ease.”
With Google BigQuery, Ken and his team can bring all the data from the TeamSnap billing systems, internal CRM, and other Google services into one straightforward dataset that everyone uses. With Tableau, users are able to perform self-service analytics on this data and provision analyses via shared dashboards that communicate the same consistent truth across the company. These dashboards provide a single view of the business to discover new patterns and questions worth analyzing.
All of this results in enormous time savings because no one is re-inventing the wheel. “Using these tools, we immediately reallocated $300,000 of ad spend that was performing poorly, generating 200% ROI in the first two days,” says Ken.
Ken now spends his time analyzing data instead of trying to pull it all together, identifying pockets of inefficient spend in real time and reallocating those marketing dollars toward better performing campaigns.
“Before, we could only focus on the largest campaign-level datasets because it was so time consuming to pull the data,” he says. “With Google BigQuery and Tableau, we can examine our advertising ROI much more granularly and reallocate more than $10 million in ad spend annually to grow the company faster and more efficiently.”
More Effective A/B Testing
To make sure it is delivering the best customer experiences, TeamSnap uses Google Optimize to run A/B tests on its website. It uses Google BigQuery and Tableau to verify and supplement these findings by measuring longer-term customer behavior across devices, spanning both web and mobile apps.
By pulling in data from Google Optimize, Google Analytics 360, Salesforce, and in-house billing and CRM systems, and understanding it with Tableau, TeamSnap has increased the accuracy and effectiveness of its A/B testing, gaining a more complete picture of customer onboarding and activity. In some cases, it found that short-term indicators it previously trusted were actually poor predictors of long-term behavior.
“Integration between Google Analytics 360 and Google BigQuery is seamless, giving us much more confidence in our A/B testing,” says Ken. “We’re constantly finding new and interesting ways to use our digital marketing data. Often, making a simple change can increase revenue by hundreds of thousands of dollars a year.”
Improving Product Quality
TeamSnap also uses Google BigQuery and Tableau to improve its own product, tracking customer activity at such a granular level that usability and functionality issues can be exposed and addressed faster. It’s also increasing customer engagement by verifying that potential customers are coming in through the right onboarding path—for example, a coach versus a player, or a consumer versus a club or other sports business. Using A/B testing to make sure customers are routed to the appropriate flow, TeamSnap drove $4 million in additional customer value each year.
“We initially chose Google BigQuery and Tableau to help with marketing, but we realized quickly that they could help us on the product side as well,” says Ken. “Most of the testing we do is about making things better and easier for our customers, and we’re accelerating that process with Google BigQuery and Tableau.”
More Relevant Stories for Your Company

Time-series Model on Google Cloud Allows Better Transparency on Fishing and Marine Activities
Who would have known that today technology would enable us with the ability to use machine learning to track vessel activity, and make pattern inferences to help address IUU (illegal, unreported, and unregulated) fishing activities. What’s even more noteworthy is that we now have the computing power to share this

A Pre-ML Checklist That Will Save You Hours of Work
One of the toughest challenges for data scientists, and big data engineers is gathering, preparing, and transforming data, and creating data pipelines. Gathering data for a machine learning or big data initiative can be hard work. The mere act of getting it all together can leave data teams so excited

redBus: Mastering Big Data with Google BigQuery
In 2006, online travel agency redBus introduced internet bus ticketing in India, unifying tens of thousands of bus schedules into a single booking operation. (Think of it as Expedia for bus booking.) Using BigQuery, redBus crunches terabytes of booking and inventory data in mere seconds and at a fraction of

Making Streaming Analytics Simpler and More Cost-Effective With Cloud Dataflow
Streaming analytics helps businesses to understand their customers in real time and adjust their offerings and actions to better serve customer needs. It’s an important part of modern data analytics, and can open up possibilities for faster decisions. For streaming analytics projects to be successful, the tools have to be
