





Held Back by Database Scalability, This Financial Services Company Switches to Google Cloud and Cloud Spanner

11590
Of your peers have already read this article.
4:30 Minutes
The most insightful time you'll spend today!
Azimut Group operates an international network of companies handling investment and asset management, mutual funds, hedge funds, and insurance. Founded in Milan, Italy in 1988, Azimut Group today has branches in fifteen countries, including Brazil, China, and the USA.
“We have subsidiaries and manage funds all over the world,” explains Simone Bertolotti, IT Manager at Azimut Holding S.p.a. “That means that any technology that we put in place has to cover needs from many different countries.”
“When complicated analysis has to be executed, we have to increase our table space in a couple of minutes so that the AI can drill down into the data and deliver the information we need.”
—Simone Bertolotti, IT Manager, Azimut Holding S.p.a.
Azimut manages its funds with investment advisors who use information sourced from Bloomberg, Reuters and others. “They use a huge amount of data,” says Simone. “They work with spreadsheets, algorithms, formulae and they analyse data in minutes.” In finance, every second is crucial, which is why Azimut decided to develop a risk management dashboard that can process information even more quickly, then distribute it worldwide.
“When an advisor manages data, that data is used to make immediate decisions on funds, capital movements or whether to sell stock,” says Simone. “They have to be ready to make recommendations for any amount of data that comes to them. For our dashboard, that means that when additional information arrives or complicated analysis has to be executed, we have to increase our table space in a couple of minutes so that the AI can drill down into the data and deliver the information we need.”
Generating insights at speed
Investors and investment managers make decisions based on the most accurate, up-to-date information possible. For Azimut Group, information sourced through financial data vendors such as Bloomberg and Reuters provided only part of the data that the group required.
“We looked to collect information from a range of different providers,” explains Simone, “then analyse it to develop a predictive algorithm that could work faster than an advisor stationed at the terminal. We set ourselves the challenge to try to manipulate that data to add new insights into our matrix, so that every one of our branches across the world can see risk information about the funds in real-time.”
“We compared Google Cloud Platform’s performance with our previous cloud provider, and saw huge benefits of switching to Google. For me, the key performance issue is scaling. With Google Cloud Platform I know that I can increase and decrease my infrastructure quickly, when I need it.
—Simone Bertolotti, IT Manager, Azimut Holding S.p.a.
The first cloud provider Azimut used to build its system struggled to scale quickly to meet different kinds of data challenges. “If we wanted to add more cores, that was fine,” says Simone. “But the previous cloud provider made it complicated to raise the amount of space in a database infrastructure and scale up to demand. Scaling up for more in-depth analysis would take a day, and our need was immediate.”
That’s why Azimut switched one year ago to Google Cloud Platform to run the 150 VMs on its risk analysis platform. “We compared Google Cloud Platform’s performance with our previous cloud provider, and saw huge benefits of switching to Google. For me, the key performance issue is scaling,” says Simone. “With Google Cloud Platform I know that I can increase and decrease my infrastructure quickly, when I need it. Instead of waiting a day to scale up infrastructure, we can request and add space to our database in a couple of minutes.”
The infrastructure of Azimut’s solution handles around 800TB of data per month, and Google’s global network of servers and high-speed connections ensure that it gets to where it’s most needed by the most direct route. Impressed by the speed, security and availability of Google Cloud Platform, Azimut has moved its intranet on to Google Cloud Platform, too, eliminating the need for staff to login with VPNs.
“Instead of waiting a day to scale up infrastructure, we can request and add space to our database in a couple of minutes.”
—Simone Bertolotti, IT Manager, Azimut Holding S.p.a.
Driving ahead with Noovle
For Azimut, migrating the risk management dashboard is the latest of many Google product collaborations with cloud consultancy Noovle. “Everything started five years ago,” says Simone, “when Noovle assisted us in migrating to Gmail from our on-premise email solution. From G Suite to Google Cloud Platform, we’ve had a great relationship. Noovle provides consultancy services, support for mobility, and external advisors who work on our premises, such as when they trained us how to broadcast our meetings on Google Hangouts. As an independent company, we know we can trust them for transparent advice. All they care about is the best way to get a job done and to help us reach our goals.”
New app, new customers
In a business case comparison, Google Cloud Platform cost Azimut 35% less to run than the previous cloud provider. Now the group is building a major new mobile application on Google App Engine to be released in 2018.
“The new mobile application will allow customers to trade directly, without human advisors, by proposing different investment solutions depending on targets the customers set,” says Simone. “So if a customer aims to make money with investments, they enter their relevant personal information and we carry out the necessary regulatory checks and suggest what they could buy. The entire project will be based on Google Cloud Platform, so customers can control their investments through the app while we manage the fund, using Google Cloud Spanner on the backend.”
Optimizing Bigtable Performance: Unveiling 20-50% Increase in Single-Row Read Throughput

1274
Of your peers have already read this article.
3:30 Minutes
The most insightful time you'll spend today!
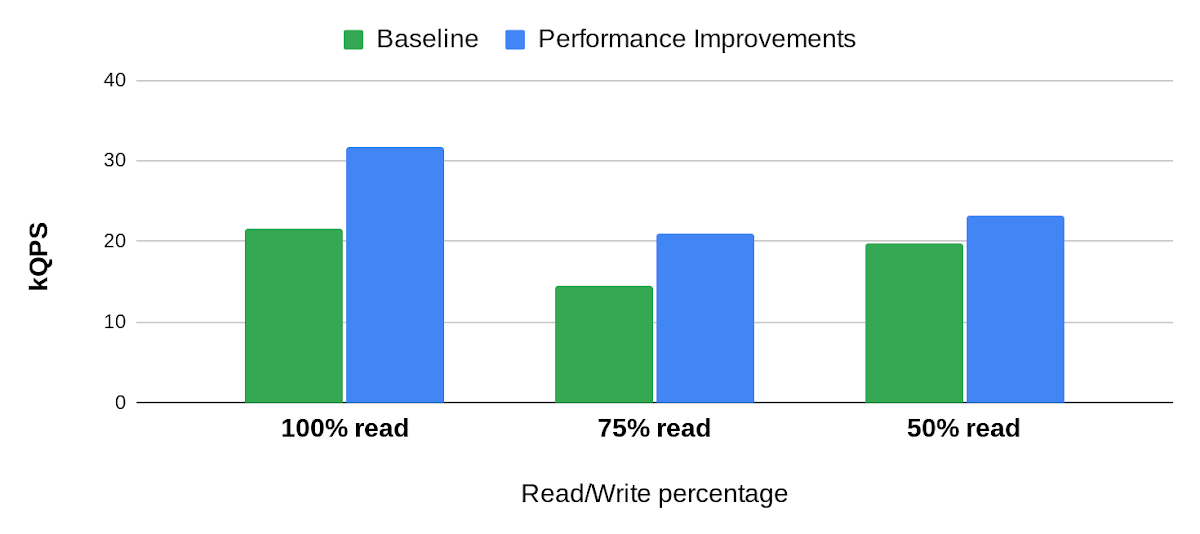
Bigtable is a scalable, distributed, high-performance NoSQL database that processes more than 6 billion requests per second at peak and has more than 10 Exabytes of data under management. Operating at this scale, Bigtable is highly optimized for high-throughput and low-latency reads and writes. Even so, our performance engineering team continually explores new areas to optimize. In this article, we share details of recent projects that helped us push Bigtable’s performance envelope forward, improving single-row read throughput by 20-50% while maintaining the same low latency.
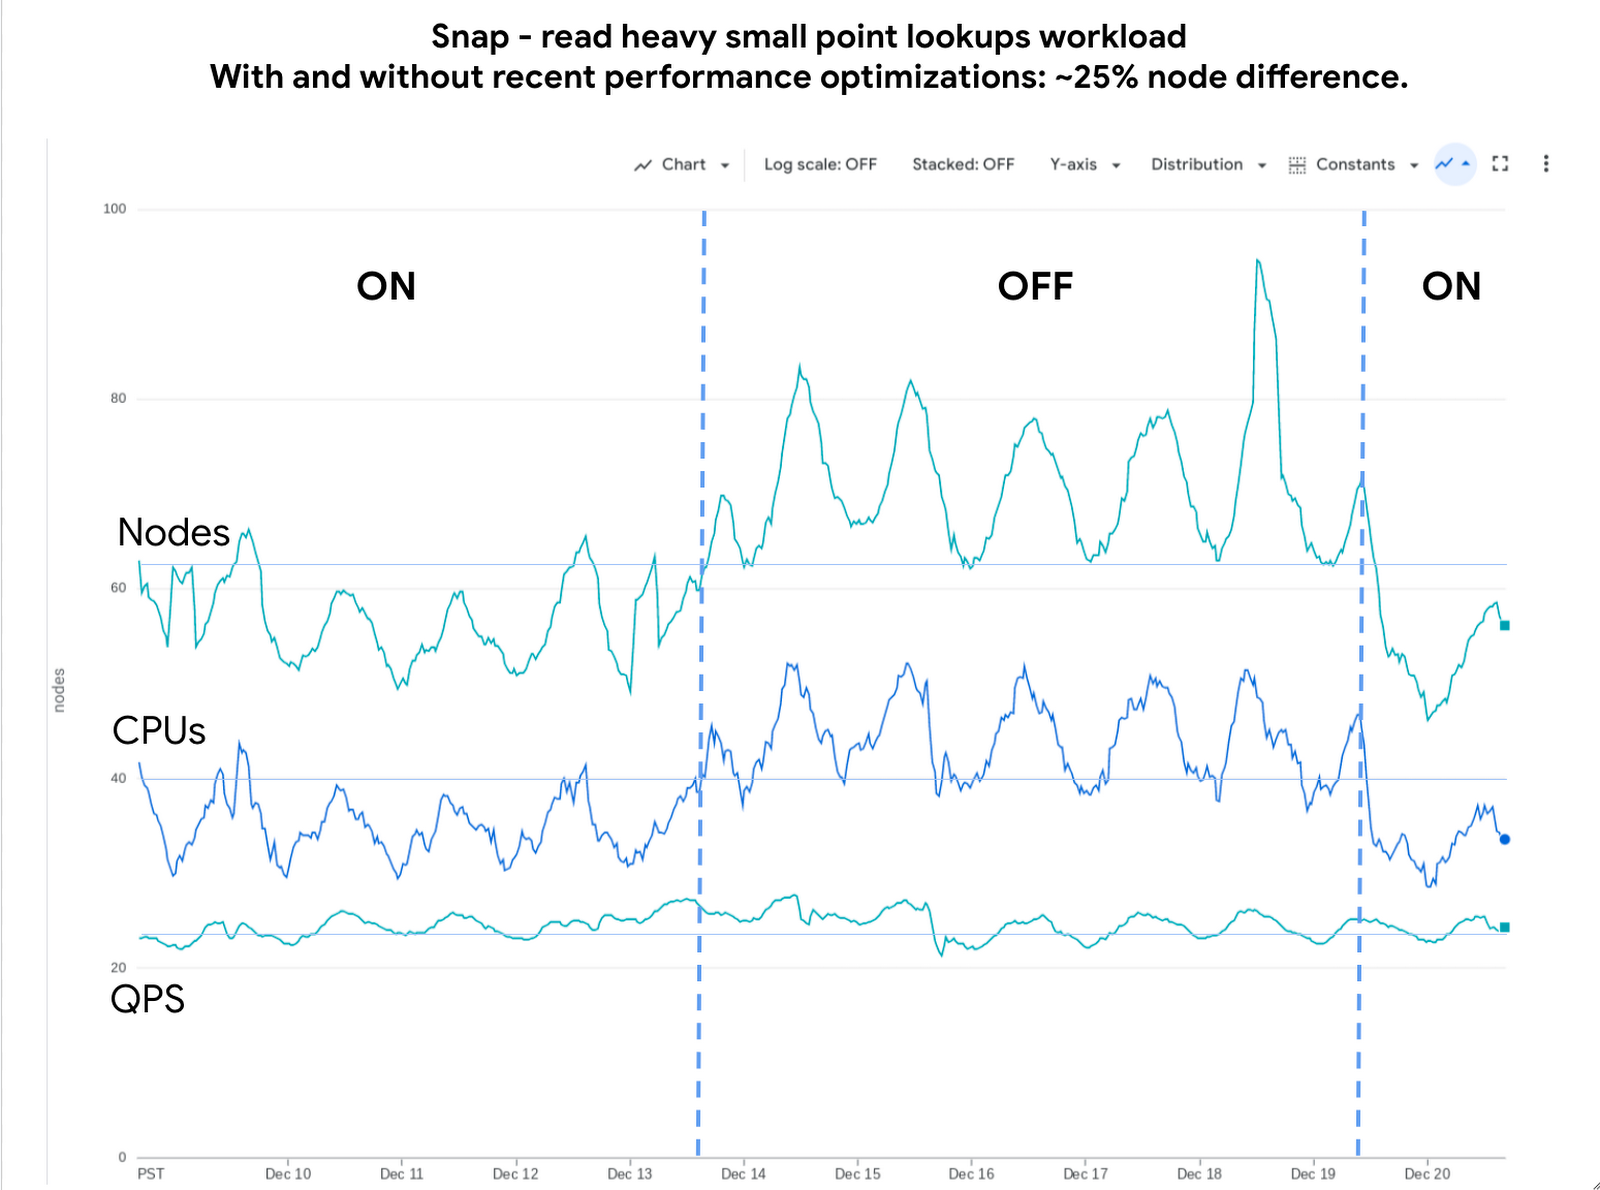
Below is an example of the impact we delivered to one of our customers, Snap. The compute cost for this small-point read-heavy workload reduced by 25% while maintaining the previous level of performance.
Performance research
We use a suite of benchmarks to continuously evaluate Bigtable’s performance. These represent a broad spectrum of workloads, access patterns and data volumes that we see across the fleet. Benchmark results give us a high-level view of performance opportunities, which we then enhance using sampling profilers and pprof for analysis. This analysis plus several iterations of prototyping confirmed feasibility of improvements in the following areas: Bloom filters, prefetching, and a new post-link-time optimization framework, Propeller.
Bloom filters
Bigtable stores its data in a log-structured merge tree. Data is organized into row ranges and each row range is represented by a set of SSTables. Each SSTable is a file that contains sorted key-value pairs. During a point-read operation, Bigtable searches across the set of SSTables to find data blocks that contain values relevant to the row-key. This is where the Bloom filter comes into play. A Bloom filter is a space-efficient probabilistic data structure that can tell whether an item is in a set, it has a small number of false positives (item may be in the set), but no false negatives (item is definitely not in the set). In Bigtable’s case, Bloom filters reduce the search area to a subset of SSTables that may contain data for a given row-key, reducing costly disk access.
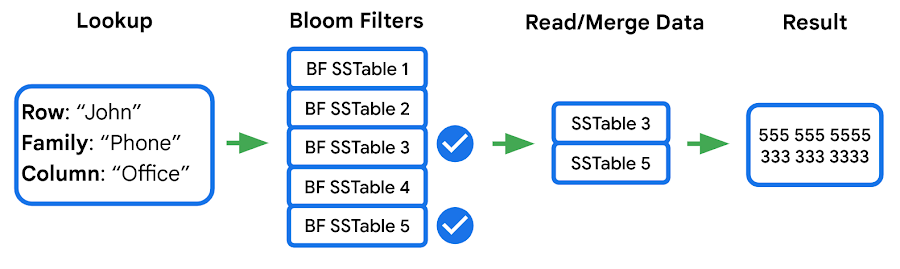
We identified two major opportunities with the existing implementation: improving utilization and reducing CPU overhead.
First, our statistics indicated that we were using Bloom filters in a lower than expected percentage of requests. This was due to our Bloom filter implementation expecting both the “column family” and the “column” in the read filter, while a high percentage of customers filter by “column family” only — which means the Bloom filter can’t be used. We increased utilization by implementing a hybrid Bloom filter that was applicable in both cases, resulting in a 4x increase in utilization. While this change made the Bloom filters larger, the overall disk footprint increased by only a fraction of a percent, as Bloom filters are typically two orders of magnitude smaller than the data they represent.
Second, the CPU cost of accessing the Bloom filters was high, so we made enhancements to Bloom filters that optimize runtime performance:
- Local cache for individual reads: When queries select multiple column families and columns in a single row, it is common that the query will use the same Bloom filter. We take advantage of this by storing a local cache of the Bloom filters used for the query being executed.
- Bloom filter index cache: Since Bloom filters are stored as data, accessing them for the first time involves fetching three blocks — two index blocks and a data block — then performing a binary search on all three. To avoid this overhead we built a custom in-memory index for just the Bloom filters. This cache tracks which Bloom filters we have in our block cache and provides direct access to them.
Overall these changes decreased the CPU cost of accessing Bloom filters by 60-70%.
Prefetching
In the previous section we noted that data for a single row may be stored in multiple SSTables. Row data from these SSTables is merged into a final result set, and because blocks can either be in memory or on disk, there’s a risk of introducing additional latency from filesystem access. Bigtable’s prefetcher was designed to read ahead of the merge logic and pull in data from disk for all SSTables in parallel.
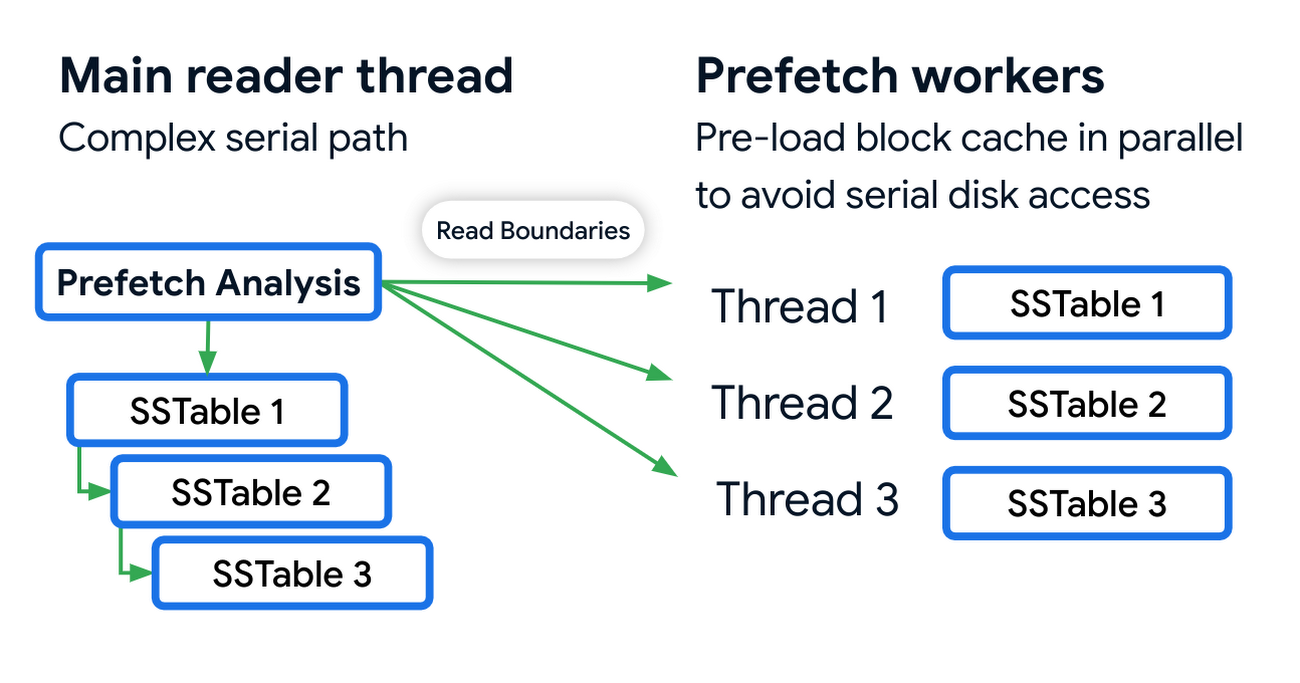
Prefetching has an associated CPU cost due to the additional threading and synchronization overhead. We reduced these costs by optimizing the prefetch threads through improved coordination with the block cache. Overall this reduced the prefetching CPU costs by almost 50%.
Post-link-time optimization
Bigtable uses profile guided optimizations (PGO) and link-time optimizations (ThinLTO). Propeller is a new post-link optimization framework released by Google that improves CPU utilization by 2-6% on top of existing optimizations.
Propeller requires additional build stages to optimize the binary. We start by building a fully optimized and annotated binary that holds additional profile mapping metadata. Then, using this annotated binary, we collected hardware profiles by running a set of training workloads that exercise critical code paths. Finally, using these profiles as input, Propeller builds a new binary with an optimized and improved code layout. Here is an example of the improved code locality.
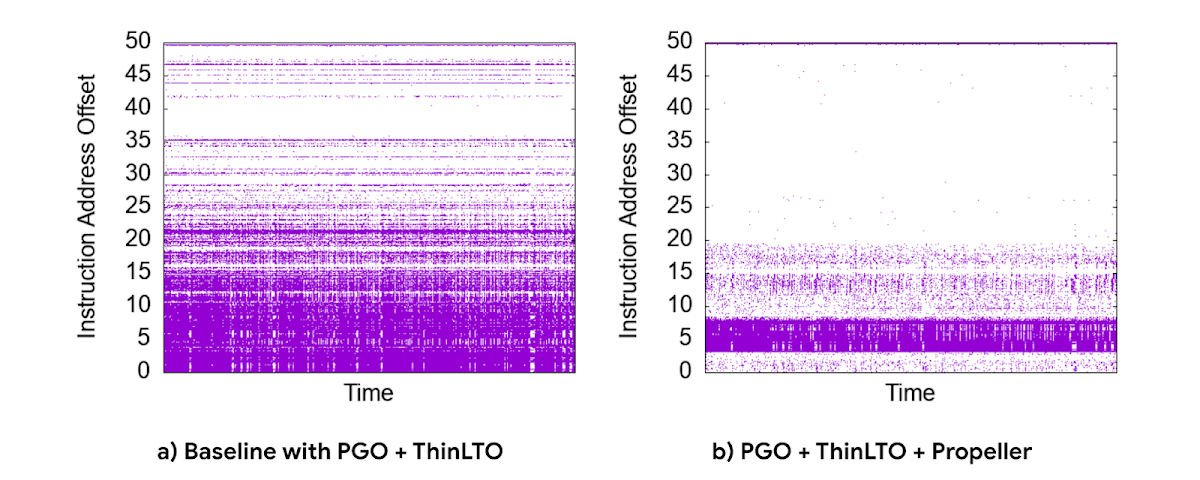
The new build process used our existing performance benchmark suite as a training workload for profile collection. The Propeller optimized binary showed promising results in our tests, showing up to 10% improvement in QPS over baseline.
However, when we released this binary to our pilot production clusters, the results were mixed. It turned out that there was overfitting for the benchmarks. We investigated sources of regression by quantifying profile overlap, inspecting hardware performance counter metrics and applied statistical analysis for noisy scenarios. To reduce overfitting, we extended our training workloads to cover a larger and more representative set of use cases.
The result was a significant improvement in CPU efficiency — reducing fleetwide utilization by 3% with an even more pronounced reduction in read-heavy workloads, where we saw up to a 10% reduction in CPU usage.
Conclusion
Overall, single-row read throughput increased by 20-50% whilst maintaining the same latency profile. We are excited about these performance gains, and continue to work on improving the performance of Bigtable. Click here to learn more about Bigtable performance and tips for testing and troubleshooting any performance issues you may encounter.
Home Depot’s Interconnected Retail Experience by Virtue of Google Cloud Migration for SAP Applications

8280
Of your peers have already read this article.
1:30 Minutes
The most insightful time you'll spend today!
With nearly 2,300 stores, The Home Depot is the world’s largest home-improvement chain — a brand that professional contractors and DIYers alike have come to depend on. The home improvement industry continues to experience unprecedented demand and dramatic increases in online ordering accompanied by expanding consumer expectations for things like curbside pickup and same day delivery. The Home Depot’s decision to migrate to cloud-based infrastructure, including the migration of the company’s SAP applications on Google Cloud which began in 2017, has set it up for success in an increasingly digital world, and helped the company adapt to changing market conditions quickly.
Interconnected retail at scale
Building on a strong customer-first philosophy, The Home Depot aims to create what it calls interconnected retail—allowing customers to shop however, whenever, and wherever they want. “So many companies are focused on omni-channel retail,” explains Sam Moses, Vice President of Corporate Systems. “At The Home Depot, we wanted to take it to the next level. Interconnected retail puts the customer at the center of everything and enables them to shop in store, online, or both. Customers can begin a transaction online and continue in-store, or vice-versa.”
To support this strategy, the company’s SAP environment needed to be more agile. Running everything on-premises, from central finance to POS systems, meant that The Home Depot’s IT teams experienced redundancy and repetitive, manual processes. Their data warehouse needed an upgrade to process and analyze growing and increasingly diverse data sets. The Home Depot chose to migrate its SAP environment to Google Cloud to support both the velocity and scale needed for the business as well as critical analytics capabilities needed for its bold digital initiatives. “We chose Google Cloud to support our SAP implementation. Our decision had a lot to do with the relationship between Google Cloud and SAP and also for the applications and services that are offered by Google Cloud, like BigQuery, which are helping to enable data and analytics within our organization,” Moses explains.
After migrating its SAP applications—including S/4HANA, its customer activity repository (CAR), general ledger, e-commerce system, enterprise data warehouse and more to Google Cloud, the company now has the speed, scale and flexibility to tackle enormous spikes in the business, all while staying fully available for their customers. Additionally, The Home Depot was able to transform its financial systems and make them more agile to deliver critical information across multiple business functions in real time.
Maximizing data insights to support customer experiences
By migrating to Google Cloud, The Home Depot is leveraging Google Cloud analytics to build the industry’s most efficient supply chain including more robust demand forecasting, supplier lead times, estimated delivery times and more, all while maintaining better security than before. “We experienced unprecedented change in our customers’ behavior and their buying patterns, which puts a lot of pressure on our supply chain,” explains Moses. “So having the ability to leverage data and analytics gives us insights to know exactly what it is that our customers need.”
The company’s analysts now use BigQuery ML for machine learning directly against the company’s BigQuery data and use AutoML to determine the best model for predictions. The Home Depot’s engineers have also adapted BigQuery to monitor, analyze, and act on application performance data across all its stores and warehouses in real time—capabilities that were not as seamless in the on-premises environment.
With hundreds of projects on Google Cloud, The Home Depot’s cloud journey is well on track, but the company is always looking to the future. “As our customers’ needs have continued to evolve, and as technology has continued to evolve, our relationship with Google will continue to advance — to be able to innovate together, to be able to find new solutions together, to better serve our customers.”
Learn more about how The Home Depot is renovating its retail operation with SAP on Google Cloud.
Make Meaningful Analysis with Geo Boundary Public Datasets on BigQuery

6349
Of your peers have already read this article.
4:00 Minutes
The most insightful time you'll spend today!
Geospatial data is a critical component for a comprehensive analytics strategy. Whether you are trying to visualize data using geospatial parameters or do deeper analysis or modeling on customer distribution or proximity, most organizations have some type of geospatial data they would like to use – whether it be customer zipcodes, store locations, or shipping addresses. However, converting geographic data into the correct format for analysis and aggregation at different levels can be difficult. In this post, we’ll walk through some examples of how you can leverage the Google Cloud platform alongside Google Cloud Public Datasets to perform robust analytics on geographic data. The full queries can be accessed from this notebook here.
Public US Geo Boundaries dataset
BigQuery hosts a slew of public datasets for you to access and integrate into your analytics. Google pays for the storage of these datasets and provides public access to the data via the bigquery-public-data project. You only pay for queries against the data. Plus, the first 1 TB per month is free! These public datasets are valuable on their own, but when joined against your own data they can unlock new analytics use cases and save the team a lot of time.
Within the Google Cloud Public Datasets Program there are several geographic datasets. Here, we’ll work with the geo_us_boundaries dataset, which contains a set of tables that have the boundaries of different geospatial areas as polygons and coordinates based on the center point (GEOGRAPHY column type in BigQuery), published by the US Census Bureau.

Mapping geospatial points to hierarchical areas
Many times you will find yourself in situations where you have a string representing an address. However, most tools require lat/long coordinates to actually plot points. Using the Google Maps Geocoding API we can convert an address into a lat/long and then store the results in the BigQuery table.
With a lat/long representation of our point, we can join our initial dataset back onto any of the tables here using the ST_WITHIN function. This allows us to check and see if a point is within the specified polygon.
ST_WITHIN(geography_1, geography_2)
This can be helpful for ensuring standard nomenclature; for example, metropolitan areas that might be named differently. The query below maps each customers’ address to a given metropolitan area name.
SELECTcust.id as customer_id,metro.name as metro_nameFROM `looker-private-demo.retail.customers` as cust,`bigquery-public-data.geo_us_boundaries.metropolitan_divisions` as metroWHERE ST_WITHIN(ST_GEOGPOINT(cust.longitude, cust.latitude),metro.metdiv_geom)
It can also be useful for converting to designated market area (DMA), which is often used in creating targeted digital marketing campaigns.
SELECTcust.id as customer_id,dma.dma_nameFROM `looker-private-demo.retail.customers` as cust,`bigquery-public-data.geo_us_boundaries.designated_market_area` as dmaWHERE ST_WITHIN(ST_GEOGPOINT(cust.longitude, cust.latitude),dma.dma_geom)
Or for filling in missing information; for example, some addresses may be missing zip code which results in incorrect calculations when aggregating up to the zipcode level. By joining onto the zip_codes table we can ensure all coordinates are mapped appropriately and aggregate up from there.
SELECTzip.zip_code,count(distinct cust.id) as unique_customersFROM `looker-private-demo.retail.customers` as cust,`bigquery-public-data.geo_us_boundaries.zip_codes` as zipWHERE ST_WITHIN(ST_GEOGPOINT(cust.longitude, cust.latitude),zip.zip_code_geom)GROUP BY 1
Note that the zip code table isn’t a comprehensive list of all US zip codes, they are zip code tabulation areas (ZCTAs). Details about the differences can be found here. Additionally, the zip code table gives us hierarchical information, which allows us to perform more meaningful analytics. One example is leveraging hierarchical drilling in Looker. I can aggregate my total sales up to the country level, and then drill down to state, city and zipcode to identify where sales are highest. You can also use the BigQuery GeoViz tool to visualize geospatial data!

Aside from simply checking if a point is within an area, we can also use ST_DISTANCE to do something like find the closest city using the centerpoint for the metropolitan area table.
SELECTcust.id as customer_id,ARRAY_AGG(metro.name order by ST_DISTANCE(ST_GEOGPOINT(cust.longitude, cust.latitude),metro.internal_point_geom) asc limit 1)[offset(0)] as metro_nameFROM`looker-private-demo.retail.customers` as cust,`bigquery-public-data.geo_us_boundaries.metropolitan_divisions` as metroGROUP BY cust.id
This concept doesn’t just hold true for points, we can also leverage other GIS functions to see if a geospatial area is contained within areas that are listed in the boundaries datasets. If your data comes into BigQuery as a GeoJSON string, we can convert it to a GEOGRAPHY type using the ST_GEOGFROMGEOJSON function. Once our data is in a GEOGRAPHY type we can do things like check to see what urban area the geo is within – using either ST_WITHIN or ST_INTERSECTS to account for partial coverage. Here, I am using the customer’s zip code to find all metropolitan divisions where the zip code polygon and the metropolitan polygon intersect. I am then selecting the metropolitan area that has the most overlap (or the intersection has the largest area) to be the customer’s metro that we use for reporting.
SELECTcust.id as customer_id,ARRAY_AGG(metro.name order by ST_AREA(ST_INTERSECTION(zip.zip_code_geom,metro.metdiv_geom)) desc limit 1)[offset(0)] as metro_nameFROM`looker-private-demo.retail.customers` as custJOIN `bigquery-public-data.geo_us_boundaries.zip_codes` as zip on cust.zip=zip.zip_code,`bigquery-public-data.geo_us_boundaries.metropolitan_divisions` as metroWHERE ST_INTERSECTS(zip.zip_code_geom,metro.metdiv_geom)GROUP BY cust.id
The same ideas can be applied to the other tables in the dataset including the county, urban areas and National Weather Service forecast regions (which can also be useful if you want to join your datasets onto weather data).
Correcting for data discrepancy
One problem that we may run into when working with geospatial data is that different data sources may have different representations of the same information. For example, you might have one system that records state as a two letter abbreviation and another using the full name. Here, we can use the state table to join the different datasets.
SELECTst.state_name,sum(ab.sales+fn.sales) as total_salesFROM `bigquery-public-data.geo_us_boundaries.states` as stLEFT JOIN abbreviated_table as ab on ab.state = st.stateLEFT JOIN fullname_table as fn on fn.state = st.state_nameWHERE COALESCE(ab.state, fn.state) IS NOT NULLGROUP BY 1
Another example might be using the tables as a source of truth for fuzzy matching. If the address is a manually entered field somewhere in your application, there is a good chance that things will be misspelled. Different representations of the same name may prevent tables from joining with each other or lead to duplicate entries when performing aggregations. Here, I use a simple Soundex algorithm to generate a code for each county name, using helper functions from this blog post. We can see that even though some are misspelled they have the same Soundex code.

Next, we can join back onto our counties table so we make sure to use the correct spelling of the county name. Then, we can simply aggregate our data for more accurate reporting.
SELECTc.county_name,sum(sales) as total_salesFROMtableJOIN `bigquery-public-data.geo_us_boundaries.counties` as con testing.dq_fm_Soundex(table.county) = testing.dq_fm_Soundex(c.county_name)WHERE c.state_fips_code = cast(36 as string)GROUP BY 1
Note that fuzzy matching definitely isn’t perfect and you might need to try different methods or apply certain filters for it to work best depending on the specifics of your data.
The US Geo Boundary datasets allow you to perform meaningful geographic analysis without needing to worry about extracting, transforming or loading additional datasets into BigQuery. These datasets, along with all the other Google Cloud Public Datasets, will be available in the Analytics Hub. Please sign up for the Analytics Hub preview, which is scheduled to be available in the third quarter of 2021, by going to g.co/cloud/analytics-hub.
Why and How to Migrate to Google BigQuery

5376
Of your peers have already read this article.
6:30 Minutes
The most insightful time you'll spend today!
Over the past few decades, organizations have mastered the science of data warehousing. They have increasingly applied descriptive analytics to large quantities of stored data, gaining insight into their core business operations. Conventional Business Intelligence (BI), which focuses on querying, reporting, and Online Analytical Processing, might have been a differentiating factor in the past, either making or breaking a company, but it’s no longer sufficient.
Today, not only do organizations need to understand past events using descriptive analytics, they need predictive analytics, which often uses machine learning (ML) to extract data patterns and make probabilistic claims about the future. The ultimate goal is to develop prescriptive analytics that combine lessons from the past with predictions about the future to automatically guide real-time actions.
Traditional data warehouse practices capture raw data from various sources, which are often Online Transactional Processing (OLTP) systems. Then, a subset of data is extracted in batches, transformed based on a defined schema, and loaded into the data warehouse. Because traditional data warehouses capture a subset of data in batches and store data based on rigid schemas, they are unsuitable for handling real-time analysis or responding to spontaneous queries. Google designed BigQuery in part in response to these inherent limitations.
Innovative ideas are often slowed by the size and complexity of the IT organization that implements and maintains these traditional data warehouses. It can take years and substantial investment to build a scalable, highly available, and secure data warehouse architecture. BigQuery offers sophisticated software as a service (SaaS) technology that can be used for serverless data warehouse operations. This lets you focus on advancing your core business while delegating infrastructure maintenance and platform development to Google Cloud.
BigQuery offers access to structured data storage, processing, and analytics that’s scalable, flexible, and cost effective. These characteristics are essential when your data volumes are growing exponentially—to make storage and processing resources available as needed, as well as to get value from that data. Furthermore, for organizations that are just starting with big data analytics and machine learning, and that want to avoid the potential complexities of on-premises big data systems, BigQuery offers a pay-as-you-go way to experiment with managed services.
With BigQuery, you can find answers to previously intractable problems, apply machine learning to discover emerging data patterns, and test new hypotheses. As a result, you have timely insight into how your business is performing, which enables you to modify processes for better results. In addition, the end user’s experience is often enriched with relevant insights gleaned from big data analysis, as we explain later in this series.
The migration framework
Undertaking a migration can be a complex and lengthy endeavor. Therefore, we recommend adhering to a framework to organize and structure the migration work in phases:
- Prepare and discover: Prepare for your migration with workload and use case discovery.
- Assess and plan: Assess and prioritize use cases, define measures of success, and plan your migration.
- Execute: Iterate the following steps for each use case:
- Migrate (offload): Migrate only your data, schema, and downstream business applications.
- Migrate (full): Alternatively, migrate the use case fully end-to-end. The same as Migrate (offload), with the addition of the upstream data pipelines.
- Verify and validate: Test and validate the migration to assess return on investment.
The following diagram illustrates the recommended framework and shows how the different phases are connected:

For a deeper understanding, read Migrating data warehouses to BigQuery: Introduction and overview
6720
Of your peers have already downloaded this article
4:30 Minutes
The most insightful time you'll spend today!
Unlocking the Power of Data and Creativity with
the Cloud: The WPP Story
More Relevant Stories for Your Company

Google Cloud Data Heroes Series: Honoring Data Practitioner’s Journey and Learning with GCP
Google Cloud Data Heroes is a series where we share stories of the everyday heroes who use our data analytics tools to do amazing things. Like any good superhero tale, we explore our Google Cloud Data Heroes’ origin stories, how they moved from data chaos to a data-driven environment, what

Making Mothers’ Day Special: How Google Cloud Migration for 1-800-FLOWERS.COM, Inc Impacts CX
Editor’s note: In honor of Mother’s Day, we look at how 1-800-FLOWERS.COM, Inc. migrated to Google Cloud as part of its digital transformation to quickly deploy seamless and convenient customer experiences across multiple brands on Mother’s Day and every day. As a leading provider of gifts designed to help customers

Scaling Ad Personalization with Bigtable
Cloud Bigtable is a popular and widely used key-value database available on Google Cloud. The service provides scale elasticity, cost efficiency, excellent performance characteristics, and 99.999% availability SLA. This has led to massive adoption with thousands of customers trusting Bigtable to run a variety of their mission-critical workloads. Bigtable has

What Drives Your Organization to be Data-driven?
Every organization has its own unique data culture and capabilities. Yet each is expected to use technology trends and solutions in the same way as everyone else. Your organization may be built on years of legacy applications, you may have developed a considerable amount of expertise and knowledge, yet you
