





Google is a Leader in the 2019 Gartner Magic Quadrant for Data Management Solutions for Analytics

5992
Of your peers have already read this article.
2:10 Minutes
The most insightful time you'll spend today!
As organizations continue to produce vast quantities of data, they increasingly need platforms that allow them to analyze, store, and extract meaningful insights from that data. And research from analyst firms like Gartner offer an important way for organizations to evaluate and compare cloud data warehouse providers.
Earlier this year, Gartner named Google a Leader in the 2019 Gartner Magic Quadrant for Data Management Solutions for Analytics (DMSA) (report available here). This evaluation covers Google Cloud’s core data analytics offerings, including BigQuery, a serverless, managed data warehouse, Cloud Dataproc, a managed Spark and Hadoop service, and Cloud Dataflow, which enables you to stream and batch-process your data. Here are a few takeaways:
Simplicity and speed
BigQuery’s performance permits complex queries on large-scale data sets to return in seconds, and a substantial number of BigQuery customers maintain data warehouses that store more than 50 terabytes (and a few customers now use more than 100 petabytes). More than half of these customers are loading data either continuously or many times per day. These customers value the ability to extract, transform, load, and analyze their data on a serverless platform, all without maintaining any underlying infrastructure.
A versatile serverless data warehouse
One of BigQuery’s major advantages is its ability to allow customers to address a wide variety of use cases—from a traditional data warehouse to data science. Over the past year, we’ve worked hard to introduce new features in BigQuery like data types for financial and monetary uses, BigQuery GIS for geospatial data, and machine learning capabilities through BigQuery ML. BigQuery’s continuous ingest capabilities make it suitable for an operational—or a real-time—serverless data warehouse.
An expanding ecosystem
With overall increased market adoption, our analytics offerings continue to benefit from a fast-growing partner ecosystem of service providers, and business intelligence (BI) and data integration vendors. In particular, in 2018 we expanded our partnerships with established industry providers, including Confluent, Dell Boomi, Informatica, Looker, Reltio, Tableau, and ThoughtSpot.
More and more organizations are finding value in Google Cloud’s serverless data warehouse and analytics offerings. If you’d like to learn more, you can download a complimentary copy of the Gartner Magic Quadrant for Data Management Solutions for Analytics on the Google site (requires an email address).
Gartner does not endorse any vendor, product or service depicted in its research publications, and does not advise technology users to select only those vendors with the highest ratings or other designation. Gartner research publications consist of the opinions of Gartner’s research organization and should not be construed as statements of fact. Gartner disclaims all warranties, expressed or implied, with respect to this research, including any warranties of merchantability or fitness for a particular purpose.
Home Depot Leverages Google Cloud’s BigQuery and DataFlow to Break Data Silos and Craft Personalized CX

5015
Of your peers have already read this article.
4:00 Minutes
The most insightful time you'll spend today!
The Home Depot, Inc., is the world’s largest home improvement retailer with annual revenue of over $151B. Delighting our customers—whether do-it-yourselfers or professionals—by providing the home improvement products, services, and equipment rentals they need, when they need them, is key to our success.
We operate more than 2,300 stores throughout the United States, Canada, and Mexico. We also have a substantial online presence through HomeDepot.com, which is one of the largest e-commerce platforms in the world in terms of revenue. The site has experienced significant growth both in traffic and revenue since the onset of Covid-19.
Because many of our customers shop at both our brick-and-mortar stores and online, we’ve embarked on a multi-year strategy to offer a shopping experience that seamlessly bridges the physical and digital worlds. To maximize value for the increasing number of online shoppers, we’ve shifted our focus from event marketing to personalized marketing, as we found it to be far more effective in improving the customer experience throughout the sales journey. This led to changing our approach to marketing content, email communications, product recommendations, and the overall website experience.
Challenge: launching a modern marketing strategy using legacy IT
For personalized marketing to be successful, we had to improve our ability to recognize a customer at the point of transaction so we could—among other things—suspend irrelevant and unnecessary advertising. Most of us have experienced the annoyance of receiving ads for something we’ve already purchased, which can degrade our perception of the brand itself. While many online retailers can identify 100% of their customer transactions due to the rich information captured during checkout, most of our transactions flow through physical stores, making this a more difficult problem to solve.
Our old legacy IT system, which ran in an on-premises data center and leveraged Hadoop, also challenged us since maintaining both the hardware and software stack required significant resources. When that system was built, personalized marketing was not a priority, so it took several days to process customer transaction data and several weeks to roll out any system changes. Further, managing and maintaining the large Hadoop cluster base presented its own set of issues in terms of quality control and reliability, as did keeping up with open-source community updates for each data processing layer.
Adopting a hybrid approach
As we worked through the challenges of our legacy system, we started thinking about what we wanted our future system to look like. Like many companies, we began with a “build vs. buy” analysis. We looked at several products on the market and determined that while each of them had their strengths, none was able to offer the complete set of features we needed.
Our project team didn’t think it made sense to build a solution from scratch, nor did we have access to the third-party data we needed. After much consideration, we decided to adopt a solution that combined a complete rewrite of the legacy system with the support of a partner to help with the customer transaction matching process.
Building the foundation on Google Cloud
We chose Google Cloud’s data platform, specifically BigQuery, Dataflow, DataProc, Cloud Storage, and Cloud Composer. Google Cloud platform empowered us to break down data silos and unify each stage of the data lifecycle from ingestion, storage, and processing to analysis and insights. Google Cloud offered best-in-class integration with open-source standards and provided the portability and extensibility we needed to make our hybrid solution work well. The open standards of BigQuery’s BQ Storage API allowed us to leverage fast BQ storage layers to be utilized with other compute platforms, e.g., DataProc.
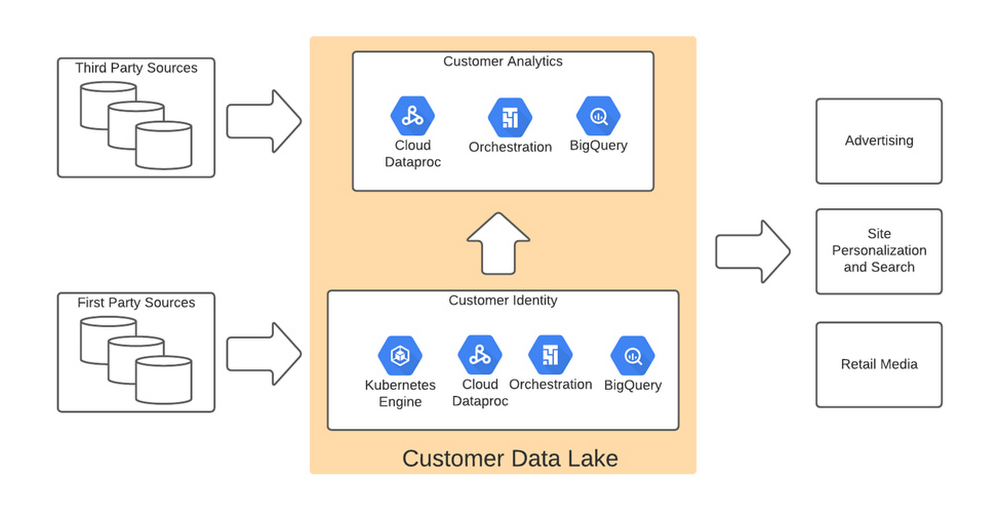
We used BigQuery combined with Dataflow to integrate our first- and third-party data into an enterprise data and analytics data lake architecture. The system then combined previously siloed data and used BigQuery ML to create complete customer profiles spanning the entire shopping experience, both in-store and online.
Understanding the customer journey with the help of Dataflow and BigQuery
The process of developing customer profiles involves aggregating a number of first- and third-party data sources to create a 360-degree view of the customer based on both their history and intent. It starts with creating a single historical customer profile through data aggregation, deduplication, and enrichment. We used several vendors to help with customer resolution and NCOA (Change of Address) updates, which allows the profile to be house-holded and transactions to be properly reconciled to both the individual and the household. This output is then matched to different customer signals to help create an understanding of where the customer is in their journey—and how we can help.
The initial implementation used Google Dataflow, Google’s streaming analytics solution, to load data from Google Cloud Storage into BigQuery and perform all necessary transformations. The Dataflow process was converted into BQML (BigQuery Machine Learning) since this significantly reduced costs and increased visibility into data jobs. We used Google Cloud Composer, a fully managed workflow orchestration service, to help orchestrate all data operations and DataProc and Google Kubernetes Engine to enable special case data integration so we could quickly pivot and test new campaigns. The architecture diagram below shows the overall structure of our solution.
Taking full advantage of cloud-native technology
In our initial migration to Google Cloud, we moved most of our legacy processes in their original form. However, we quickly learned that this approach didn’t take full advantage of the cloud-native and more improved features Google Cloud offered such as auto scaling of resources, flexibility to decouple storage from the compute layer, and a wide variety of options to choose the best tool for the job. We refactored our Hadoop-based data pipelines written in Java-based Map Reduce and our Pig Latin jobs to Dataflow and BigQuery jobs. This dramatically reduced processing time and made our data pipeline code concise and efficient.
Previously, our legacy system processes ran longer than intended, and data was not used efficiently. Optimizing our code to be cloud-native and leveraging all the capabilities of Google Cloud services resulted in reduced run times. We decreased our data processing window from 3 days to 24 hours, improved resource usage by dramatically reducing the amount of compute we used to possess this data, and built a more streamlined system. This in turn reduced cloud costs and provided better insight. For example, DataFlow offers powerful native features to monitor data pipelines, enabling us to be more agile.
Leveraging the flexibility and speed of the cloud to improve outcomes
Today, using a continuous integration/continuous delivery (CI/CD) approach, we can deploy multiple system changes each week to further improve our ability to recognize in-store transactions. Leveraging the combined capabilities of various Google Cloud systems—BigQuery, DataFlow, Cloud Composer, Dataproc, and Cloud Storage–we drastically increased our ability to recognize transactions and can now connect over 75% of all transactions to an existing household. Further, the flexible Google Cloud environment coupled with our cloud-native application makes our team more nimble and better able to respond to emerging problems or new opportunities.
Increased speed has led to better outcomes in our ability to match transactions across all sales channels to a customer and thereby improve their experience. Before moving to Google Cloud, it took 48 to 72 hours to match customers to their transactions, but now we can do it in less than 24 hours.
Making marketing more personal—and more efficient
The ability to quickly match customers to transactions has huge implications for our downstream marketing efforts in terms of both cost and effectiveness. By knowing what a customer has purchased, we can turn off ads for products they’ve already bought or offer ads for things that support what they’ve bought recently. This helps us use our marketing dollars much more efficiently and offer an improved customer experience.
Additionally, we can now apply the analytical models developed using BQML and Vertex AI to sort customers into audiences. This allows us to more quickly identify a customer’s current project, such as remodeling a kitchen or finishing a basement, and then personalize their journey by offering them information on products and services that matter most at a given point through our various marketing channels. This provides customers with a more relevant and customized shopping journey that mirrors their individual needs.
Protecting a customer’s privacy
With this ability to better understand our customers, we also have the responsibility to ensure we have good oversight and maintain their data privacy. Google’s cloud solutions provide us the security needed to help protect our customers’ data, while also being flexible enough to allow us to support state and federal regulations, like the California Customer Privacy Act. This way we can provide a customer the personalized experience they desire without having to fear how their data is being used.
With flexible Google Cloud technology in place, The Home Depot is well positioned to compete in an industry where customers have many choices. By putting our customers’ needs first, we can stay top of mind whenever the next project comes up.

ESG Report: Economic Advantages of Google BigQuery OnDemand Serverless Analytics
DOWNLOAD WHITEPAPER5909
Of your peers have already downloaded this article
10:30 Minutes
The most insightful time you'll spend today!
Traditional big data solutions require a significant upfront investment, ongoing maintenance of hardware and software, and manual provisioning to match compute and storage resources with demand. Google’s serverless analytics warehouse does away with all that extra work, helping businesses focus on what matters most: getting value from their data.
Enterprise Strategy Group (ESG), which examined the economic value propositions of Google BigQuery and alternative big data solutions, reports that BigQuery enables organizations to:
- Save up to 88 percent on data warehousing over a three-year period
- Achieve a faster time to value by getting up and running quickly
- Empower more employees to become citizen data scientists
Eliminate maintenance tasks so teams can spend more time gaining insights
Download the complete report to learn more.
Google Cloud’s Data Analytics May Recap

6923
Of your peers have already read this article.
5:00 Minutes
The most insightful time you'll spend today!
May was a very busy month for data analytics product innovation. If you didn’t have the chance to attend our inaugural Data Cloud Summit, video replays of all our sessions are now available so feel free to watch them at your own pace.
In this blog, I’d like to share some background behind the innovations we released in May, why we built them the way we did, and the type of value they can bring your company and your team.
But first, a huge thank you!
This week, we had the honor to announce that Google has been named a Leader in The Forrester Wave™: Streaming Analytics, Q2 2021 report. Forrester gave Dataflow a score of 5 out of 5 across 12 different criteria, stating: “Google Cloud Dataflow has strengths in data sequencing, advanced analytics, performance, and high-availability”.
Google has more than a decade of experience in building real-time and internet-scale systems for its own needs, and we are excited to see that our ability to provide customers with a reliable, scalable, and performant platform is bearing fruit.
This announcement comes on the back of the release of The Forrester Wave™: Cloud Data Warehouse, Q1 2021 report, which also named Google Cloud as a Leader.
We couldn’t be more excited about the recognition and appreciate all your feedback and trust in the work that we do to support your goal in accelerating data-powered innovation.
Innovation galore
Your feedback and your passion is the fuel that drives our ambition to deliver more and better services to you. That’s why, this year, we didn’t want to wait until Google Cloud Next to share some great products we have been working on. On May 26, our team announced a slew of new products, services and programs. Watch a quick summary below:
https://youtube.com/watch?v=DG1mOPMXJvw%3Fenablejsapi%3D1%26
Meeting you where you are
An important design principle behind all of our services is “meeting you where you are”. This means we aim to provide you with the tools and software you need to innovate on your own terms. Here are three new services that will help you do just that:
Datastream
Datastream, our new serverless change data capture (CDC) and replication service, allows your company to synchronize data across heterogeneous databases, storage systems, and applications reliably and with minimal latency to support real-time analytics, database replication, and event-driven architectures. Datastream delivers change streams from Oracle and MySQL databases into Google Cloud services such as BigQuery, Cloud SQL, Cloud Storage, and Cloud Spanner, saving time and resources while ensuring your data is accurate and up-to-date.
- Under the hood, Datastream reads CDC events (inserts, updates, and deletes) from source databases, and writes those events with minimal latency to a data destination. It leverages the fact that each database source has its own CDC log—binlog for MySQL and LogMiner for Oracle—which it uses for its own internal replication and consistency purposes.
- Datastream integrates with purpose-built and extensible Dataflow templates to pull the change streams written to Cloud Storage, and create up-to-date replicated tables in BigQuery for analytics. It also leverages Dataflow templates to replicate and synchronize databases into Cloud SQL or Cloud Spanner for database migrations and hybrid cloud configurations.
- Datastream also powers a Google-native Oracle connector in Cloud Data Fusion’s new replication feature for easy ETL/ELT pipelining. By delivering change streams directly into Cloud Storage, customers can leverage Datastream to implement modern, event-driven architectures.
Looker and BigQuery Omni on Microsoft Azure
Research on multi cloud adoption is unequivocal — 92% of businesses in 2021 report having a multi cloud strategy. We want to continue supporting your choice by providing the flexibility you need to see your strategy through.
- This past month, we introduced Looker, hosted on Microsoft Azure. For the first time, you can now choose Azure, Google Cloud, or AWS for your Looker instance. You can also self-host your Looker instance on-premises.
- We also introduced BigQuery Omni for Azure, which along with last year’s introduction of BigQuery Omni for AWS, will help you access and securely analyze data across Google Cloud, AWS, and Azure.
The cost of moving data between cloud providers isn’t sustainable for many, and it’s still difficult to seamlessly work across clouds. BigQuery Omni represents a new way of analyzing data stored in multiple public clouds, which is made possible by BigQuery’s separation of compute and storage. By decoupling these two, BigQuery provides scalable storage that can reside in Google Cloud or other public clouds, and stateless resilient compute that executes standard SQL queries.
- Unlike competitors, BigQuery Omni doesn’t require you to move or copy your data from one public cloud to another, where you might incur egress costs. You also benefit from the same BigQuery interface on Google Cloud, enabling you to query data stored in Google Cloud, AWS, and Azure without any cross-cloud movement or copies of data.
- BigQuery Omni’s query engine runs the necessary compute on clusters in the same region where your data resides. For example, you can query Google Analytics 360 Ads data stored in Google Cloud and query logs data from your ecommerce platform and applications that are stored in AWS S3 and/or Microsoft Azure.
Then, using Looker, you can build a dashboard that allows you to visualize your audience behavior and purchases alongside your advertising spend.
Dataplex
We understand that most organizations still struggle to make high-quality data easily discoverable and accessible for analytics, across multiple silos, to a growing number of people and tools within their organization.
They are often forced to make tradeoffs. For instance, moving and duplicating data across silos to enable diverse analytics use cases or leaving their data distributed but limiting the agility of decisions.
- Dataplex provides an intelligent data fabric that enables you to centrally manage, monitor, and govern your data across data lakes, data warehouses, and data marts, while also ensuring data is securely accessible to a variety of analytics and data science tools.
- One of the core tenets of Dataplex is letting you organize and manage your data in a way that makes sense for your business, without data movement or duplication. For that, we provide logical constructs like lakes, data zones, and assets. These constructs enable you to abstract away the underlying storage systems and become the foundation for setting policies around data access, security, lifecycle management, and so on.
- For example, you can create a lake per department within your organization (e.g. Retail, Sales, Finance, etc.) and create data zones that map to data readiness and usage (e.g. landing, raw, curated_data_analytics, curated_data_science, etc.).
Once you have your lakes and zones setup, you can attach data to these zones as assets. You can add data from different types of storage (e.g. GCS Bucket and BigQuery dataset) under the same zone. You can also attach data across multiple projects under the same zone. You can ingest data into your lakes and zones using the tools of your choice, including services such as Dataflow, Data Fusion, Dataproc, Pub/Sub, or choose from one of our partner products. Dataplex comes with built-in 1-click templates for common data management tasks.
To find out more about Dataplex, head to cloud.google.com/dataplex or watch the video below:
https://youtube.com/watch?v=bbFeAt7cw1g%3Fenablejsapi%3D1%26
Helping you innovate everyday
Sharing data is hard. Traditional data sharing techniques use batch data pipelines that are expensive to run, create late arriving data, and can break with any changes to the source data. These techniques also create multiple copies of data, which brings unnecessary costs and can bypass data governance processes. They also fail to offer features for data monetization, such as managing subscriptions and entitlements. Altogether, these challenges mean that organizations are unable to realize the full potential of transforming their business with shared data.
Analytics Hub
To address these limitations, we are introducing Analytics Hub, a new fully managed service that helps organizations unlock the value of data sharing, leading to new insights and increased business value.
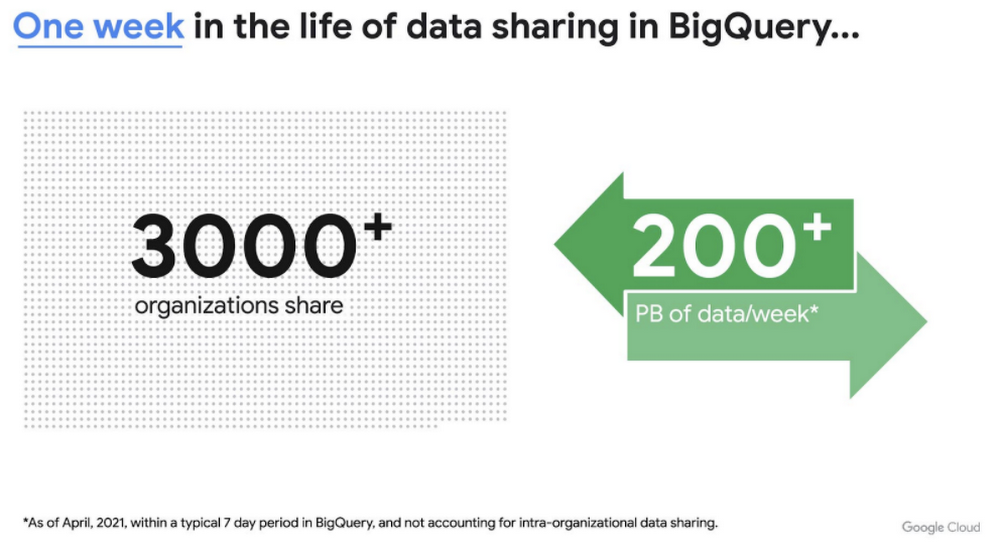
This new service is built on the tremendous experience and feedback we have received over the years. For example, BigQuery has had cross-organizational, in-place data sharing capabilities since its inception in 2010—and the functionality is very popular. Over a 7-day period in April, we had over 3,000 different organizations sharing over 200 petabytes of data. These numbers don’t include data sharing between departments within the same organization.
Analytics Hub takes sharing to the next level, making it easy for you to publish, discover, and subscribe to valuable datasets that you can combine with your own data to derive unique insights.
This includes:
- Shared datasets: As a data publisher, you create shared datasets that contain the views of data that you want to deliver to your subscribers. Data subscribers can search through the datasets that are available across all exchanges for which they have access and subscribe to relevant datasets. In addition, the publisher can track subscribers, disable subscriptions, and see aggregated usage information for the shared data.
- Curated, self-service data exchanges: Exchanges are collections used to organize and secure shared datasets. By default, exchanges are completely private, but granular roles and permissions make it easy to deliver data to the right audience—whether internal or public.
This is just the beginning for Analytics Hub. Please sign up for the preview, which is scheduled to be available in the third quarter of 2021.
Dataflow Prime
At Google Cloud, we have the great privilege of working with some of the most innovative organizations in the world. And this work provides us with a unique perspective into the future of big data processing. Dataflow Prime is a new platform based on a serverless, no-ops, and auto-tuning architecture that brings unparalleled resource utilization and radical operational simplicity to big data processing. This new service introduces a large number of exciting capabilities but I’d like to highlight three key aspects of the product:
- Vertical Autoscaling: Dataflow Prime dynamically adjusts the compute capacity allocated to each worker based on utilization, detecting when jobs are limited by worker resources and automatically adding more resources. Vertical Autoscaling works hand in hand with Horizontal Autoscaling to seamlessly scale workers to best fit the needs of the pipeline. As a result, it no longer takes hours or days to determine the perfect worker configuration to maximize utilization.
- Right Fitting: Each stage of a pipeline typically has a different resource requirement than the others. Until now, either all workers in the pipeline would have had the higher memory and GPU, or none of them would. Pipelines either had to waste resources or suffer slower workloads. Right Fitting solves this problem by creating stage-specific pools of resources, optimized for each stage.
- Smart Recommendations: Smart Recommendations automatically detects problems in your pipeline and shows potential fixes. For example, if your pipeline is running into permissions issues, a Smart Recommendation will detect which IAM permissions you need to enable to unblock your job. If you are using an inefficient coder in your job, Smart Recommendations will surface more performant coder implementations that can help you save on costs.
What’s next
We’re excited to hear your thoughts and feedback about all these exciting new services. I would also highly recommend that you connect with members of the community to learn more about their story and journey. A good example to start with is the Data To Value customer panel we produced at our inaugural Data Cloud Summit with the Chief Data Officers of Keybank and Rackspace. You can watch it for free below:
https://youtube.com/watch?v=ITI2Q3MkxuA%3Fenablejsapi%3D1%26
Make Meaningful Analysis with Geo Boundary Public Datasets on BigQuery

6358
Of your peers have already read this article.
4:00 Minutes
The most insightful time you'll spend today!
Geospatial data is a critical component for a comprehensive analytics strategy. Whether you are trying to visualize data using geospatial parameters or do deeper analysis or modeling on customer distribution or proximity, most organizations have some type of geospatial data they would like to use – whether it be customer zipcodes, store locations, or shipping addresses. However, converting geographic data into the correct format for analysis and aggregation at different levels can be difficult. In this post, we’ll walk through some examples of how you can leverage the Google Cloud platform alongside Google Cloud Public Datasets to perform robust analytics on geographic data. The full queries can be accessed from this notebook here.
Public US Geo Boundaries dataset
BigQuery hosts a slew of public datasets for you to access and integrate into your analytics. Google pays for the storage of these datasets and provides public access to the data via the bigquery-public-data project. You only pay for queries against the data. Plus, the first 1 TB per month is free! These public datasets are valuable on their own, but when joined against your own data they can unlock new analytics use cases and save the team a lot of time.
Within the Google Cloud Public Datasets Program there are several geographic datasets. Here, we’ll work with the geo_us_boundaries dataset, which contains a set of tables that have the boundaries of different geospatial areas as polygons and coordinates based on the center point (GEOGRAPHY column type in BigQuery), published by the US Census Bureau.

Mapping geospatial points to hierarchical areas
Many times you will find yourself in situations where you have a string representing an address. However, most tools require lat/long coordinates to actually plot points. Using the Google Maps Geocoding API we can convert an address into a lat/long and then store the results in the BigQuery table.
With a lat/long representation of our point, we can join our initial dataset back onto any of the tables here using the ST_WITHIN function. This allows us to check and see if a point is within the specified polygon.
ST_WITHIN(geography_1, geography_2)
This can be helpful for ensuring standard nomenclature; for example, metropolitan areas that might be named differently. The query below maps each customers’ address to a given metropolitan area name.
SELECTcust.id as customer_id,metro.name as metro_nameFROM `looker-private-demo.retail.customers` as cust,`bigquery-public-data.geo_us_boundaries.metropolitan_divisions` as metroWHERE ST_WITHIN(ST_GEOGPOINT(cust.longitude, cust.latitude),metro.metdiv_geom)
It can also be useful for converting to designated market area (DMA), which is often used in creating targeted digital marketing campaigns.
SELECTcust.id as customer_id,dma.dma_nameFROM `looker-private-demo.retail.customers` as cust,`bigquery-public-data.geo_us_boundaries.designated_market_area` as dmaWHERE ST_WITHIN(ST_GEOGPOINT(cust.longitude, cust.latitude),dma.dma_geom)
Or for filling in missing information; for example, some addresses may be missing zip code which results in incorrect calculations when aggregating up to the zipcode level. By joining onto the zip_codes table we can ensure all coordinates are mapped appropriately and aggregate up from there.
SELECTzip.zip_code,count(distinct cust.id) as unique_customersFROM `looker-private-demo.retail.customers` as cust,`bigquery-public-data.geo_us_boundaries.zip_codes` as zipWHERE ST_WITHIN(ST_GEOGPOINT(cust.longitude, cust.latitude),zip.zip_code_geom)GROUP BY 1
Note that the zip code table isn’t a comprehensive list of all US zip codes, they are zip code tabulation areas (ZCTAs). Details about the differences can be found here. Additionally, the zip code table gives us hierarchical information, which allows us to perform more meaningful analytics. One example is leveraging hierarchical drilling in Looker. I can aggregate my total sales up to the country level, and then drill down to state, city and zipcode to identify where sales are highest. You can also use the BigQuery GeoViz tool to visualize geospatial data!

Aside from simply checking if a point is within an area, we can also use ST_DISTANCE to do something like find the closest city using the centerpoint for the metropolitan area table.
SELECTcust.id as customer_id,ARRAY_AGG(metro.name order by ST_DISTANCE(ST_GEOGPOINT(cust.longitude, cust.latitude),metro.internal_point_geom) asc limit 1)[offset(0)] as metro_nameFROM`looker-private-demo.retail.customers` as cust,`bigquery-public-data.geo_us_boundaries.metropolitan_divisions` as metroGROUP BY cust.id
This concept doesn’t just hold true for points, we can also leverage other GIS functions to see if a geospatial area is contained within areas that are listed in the boundaries datasets. If your data comes into BigQuery as a GeoJSON string, we can convert it to a GEOGRAPHY type using the ST_GEOGFROMGEOJSON function. Once our data is in a GEOGRAPHY type we can do things like check to see what urban area the geo is within – using either ST_WITHIN or ST_INTERSECTS to account for partial coverage. Here, I am using the customer’s zip code to find all metropolitan divisions where the zip code polygon and the metropolitan polygon intersect. I am then selecting the metropolitan area that has the most overlap (or the intersection has the largest area) to be the customer’s metro that we use for reporting.
SELECTcust.id as customer_id,ARRAY_AGG(metro.name order by ST_AREA(ST_INTERSECTION(zip.zip_code_geom,metro.metdiv_geom)) desc limit 1)[offset(0)] as metro_nameFROM`looker-private-demo.retail.customers` as custJOIN `bigquery-public-data.geo_us_boundaries.zip_codes` as zip on cust.zip=zip.zip_code,`bigquery-public-data.geo_us_boundaries.metropolitan_divisions` as metroWHERE ST_INTERSECTS(zip.zip_code_geom,metro.metdiv_geom)GROUP BY cust.id
The same ideas can be applied to the other tables in the dataset including the county, urban areas and National Weather Service forecast regions (which can also be useful if you want to join your datasets onto weather data).
Correcting for data discrepancy
One problem that we may run into when working with geospatial data is that different data sources may have different representations of the same information. For example, you might have one system that records state as a two letter abbreviation and another using the full name. Here, we can use the state table to join the different datasets.
SELECTst.state_name,sum(ab.sales+fn.sales) as total_salesFROM `bigquery-public-data.geo_us_boundaries.states` as stLEFT JOIN abbreviated_table as ab on ab.state = st.stateLEFT JOIN fullname_table as fn on fn.state = st.state_nameWHERE COALESCE(ab.state, fn.state) IS NOT NULLGROUP BY 1
Another example might be using the tables as a source of truth for fuzzy matching. If the address is a manually entered field somewhere in your application, there is a good chance that things will be misspelled. Different representations of the same name may prevent tables from joining with each other or lead to duplicate entries when performing aggregations. Here, I use a simple Soundex algorithm to generate a code for each county name, using helper functions from this blog post. We can see that even though some are misspelled they have the same Soundex code.

Next, we can join back onto our counties table so we make sure to use the correct spelling of the county name. Then, we can simply aggregate our data for more accurate reporting.
SELECTc.county_name,sum(sales) as total_salesFROMtableJOIN `bigquery-public-data.geo_us_boundaries.counties` as con testing.dq_fm_Soundex(table.county) = testing.dq_fm_Soundex(c.county_name)WHERE c.state_fips_code = cast(36 as string)GROUP BY 1
Note that fuzzy matching definitely isn’t perfect and you might need to try different methods or apply certain filters for it to work best depending on the specifics of your data.
The US Geo Boundary datasets allow you to perform meaningful geographic analysis without needing to worry about extracting, transforming or loading additional datasets into BigQuery. These datasets, along with all the other Google Cloud Public Datasets, will be available in the Analytics Hub. Please sign up for the Analytics Hub preview, which is scheduled to be available in the third quarter of 2021, by going to g.co/cloud/analytics-hub.
Google Cloud and Univision Partnership to Up the Ante in UX for Spanish-speaking Audience

6889
Of your peers have already read this article.
1:00 Minutes
The most insightful time you'll spend today!
The past year has given everyone lots to think about—about our priorities as people and as businesses. As the world retreated behind closed doors, we saw how shared interests and experiences can bring us together. As the world grappled with a common enemy, we witnessed just how differently individuals, communities and indeed entire countries can experience a situation. And as we faced seemingly unending obstacles to making it through the pandemic, we saw how making smart decisions based on data can drive meaningful solutions—fast.
That’s why we here at Google Cloud are so proud to partner Univision, the country’s leading Spanish-language content and media company. By partnering with Google Cloud, Univision will be able to accelerate growth across its portfolio of properties, deliver an enhanced user experience for Spanish-speaking audiences and provide the enterprise solutions needed to create the Spanish-language media company of the future.
According to Instituto Cervantes, there are over 580 million Spanish language speakers worldwide. Those viewers, like people everywhere, are avid consumers of streaming content. In Q4 of 2020 alone, viewing time for that content increased by 44%1, and in 2020, from 50%2 more sources. With that surge in demand, Univision needed a cloud provider whose infrastructure could reach Hispanic viewers around the world. With two-plus decades spent building out its network and data centers, as well as global content-delivery capabilities, Google Cloud has the infrastructure Univision needs to reach viewers across the Spanish-speaking world.
At the same time, with such a diverse audience for their content, Univision needs to target that content to viewers’ specific preferences. By applying Google Cloud’s artificial intelligence (AI) and machine learning (ML) technology across its content, Univision intends to personalize content based on shows users have previously watched, enhancing their engagement and viewing experience.
And as Univision transforms the user experience, it can use Google Cloud’s data and analytics suite to garner deeper insights into its audience and forge stronger relationships with them on an individual basis. With Looker and BigQuery, Univision employees will have access to real-time data to help them make business decisions about programming.
Univision will also migrate video distribution and production operations to Google Cloud, where we’ll help them streamline media workflows and develop innovative new capabilities. Meanwhile, Google Cloud’s tight business and technical integration with other Google services will help ensure Univision reaches viewers on the device of their choice, wherever they are in the world. For example, in the coming years, Univision will expand its global YouTube partnership and will integrate with entertainment features on Google Search that help people better discover TV shows and movies. The company will also use Google Ad Manager for global ad decisioning and Google’s Dynamic Ad Insertion for PrendeTV and future video-on-demand offerings. Finally, Univision will distribute its content and services on Google Play across Android phones and tablets, as well as Google TV and other Android TV OS devices.
We’re thrilled to partner with Univision to help them reach the Spanish-speaking world with their content. With our cloud portfolio, we can help them reach individual viewers around the world, with personalized content that they can consume however they see fit. Best of all, together, we can help them achieve this vision fast, leveraging established cloud, content delivery, and data analytics technologies. You can learn more about the partnership here.
More Relevant Stories for Your Company


How Major League Baseball Migrated from Teradata to BigQuery
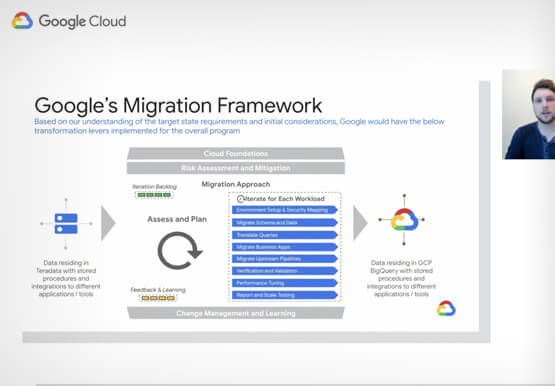
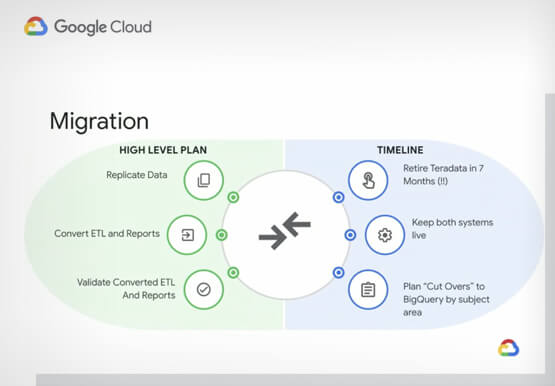
Ever wondered how to jumpstart a migration from your legacy on-premises or cloud data warehouse to BigQuery? In this video Robert Goretsky, VP, Data Engineering, Major League Baseball and Ryan McDowell, Cloud Data Engineer, Google Cloud show you how. They offer a deep-dive into MLB’s Teradata to BigQuery migration journey.

Partnering with Google Cloud is the Key Behind Recent Healthcare Innovations
It’s simply amazing to witness how some of our systems integrators employ Google Cloud solutions to drive innovation in ways we at Google may never have considered—especially in healthcare. According to analyst firm MarketsandMarkets, the market for the Cloud in healthcare is projected to grow 43% between 2020 and 2025

Data to Business Outcomes with Google’s Data Analytics Design Pattern
Companies today are inundated with vast amounts of data from various sources. This overwhelming amount of data is meant to benefit the company, but often leaves data teams feeling overwhelmed, which can create data bottlenecks and result in a slow time to value. In fact, only twenty seven percent of

How BigQuery’s Unique Features Support Your Data at Petabyte-scale
Organizations rely on data warehouses to aggregate data from disparate sources, process it, and make it available for data analysis in support of strategic decision-making. BigQuery is the Google Cloud enterprise data warehouse designed to help organizations to run large scale analytics with ease and quickly unlock actionable insights. You
