





Geospatial Data for Business Apps Drive Sustainable and Accurate Decision-making

4356
Of your peers have already read this article.
1:30 Minutes
The most insightful time you'll spend today!
Organizations that collect geospatial data can use that information to understand their operations, help make better business decisions, and power innovation. Traditionally, organizations have required deep GIS expertise and tooling in order to deliver geospatial insights. In this post, we outline some ways that geospatial data can be used in various business applications.
Assessing environmental risk
Governments and businesses involved in insurance underwriting, property management, agriculture technology, and related areas are increasingly concerned with risks posed by environmental conditions. Historical models that predict natural disasters like pollution, flooding, and wildfires are becoming less accurate as real-world conditions change. Therefore, organizations are incorporating real-time and historical data into a geospatial analytics platform and using predictive modeling to more effectively plan for risk and to forecast weather.
Selecting sites and planning expansion
Businesses that have storefronts, such as retailers and restaurants, can find the best locations for their stores by using geospatial data like population density to simulate new locations and to predict financial outcomes. Telecom providers can use geospatial data in a similar way to determine the optimal locations for cell towers. A site selection solution can combine proprietary site metrics with publicly-available data like traffic patterns and geographic mobility to help organizations make better decisions about site selection, site rationalization, and expansion strategy.
Planning logistics and transport
For freight companies, courier services, ride-hailing services, and other companies that manage fleets, it’s critical to incorporate geospatial context into business decision-making. Fleet management operations include optimizing last-mile logistics, analyzing telematics data from vehicles for self-driving cars, managing precision railroading, and improving mobility planning. Managing all of these operations relies extensively on geospatial context. Organizations can create a digital twin of their supply chain that includes geospatial data to mitigate supply chain risk, design for sustainability, and minimize their carbon footprint.
Understanding and improving soil health and yield
AgTech companies and other organizations that practice precision agriculture can use a scalable analytics platform to analyze millions of acres of land. These insights help organizations understand soil characteristics and help them analyze the interactions among variables that affect crop production. Companies can load topography data, climate data, soil biomass data, and other contextual data from public data sources. They can then combine this information with data about local conditions to make better planting and land-management decisions. Mapping this information using geospatial analytics not only lets organizations actively monitor crop health and manage crops, but it can help farmers determine the most suitable land for a given crop and to assess risk from weather conditions.
Managing sustainable development
Geospatial data can help organizations map economic, environmental, and social conditions to better understand the geographies in which they conduct business. By taking into account environmental and socio-economic phenomena like poverty, pollution, and vulnerable populations, organizations can determine focus areas for protecting and preserving the environment, such as reducing deforestation and soil erosion. Similarly, geospatial data can help organizations design data-driven health and safety interventions. Geospatial analytics can also help an organization meet its commitments to sustainability standards through sustainable and ethical sourcing. Using geospatial analytics, organizations can track, monitor, and optimize the end-to-end supply chain from the source of raw materials to the destination of the final product.
What’s next
Google Cloud provides a full suite of geospatial analytics and machine learning capabilities that can help you make more accurate and sustainable business decisions without the complexity and expense of managing traditional GIS infrastructure. Get started today by learning how you can use Google Cloud features to get insights from your geospatial data, see Geospatial analytics architecture.
Acknowledgements: We’d like to thank Chad Jennings, Lak Lakshmanan, Kannappan Sirchabesan, Mike Pope, and Michael Hao for their contributions to this blog post and the Geospatial Analytics architecture.
The Real Drivers of Efficiency, Growth, and Customer Experience

5136
Of your peers have already read this article.
4:30 Minutes
The most insightful time you'll spend today!
The increasing adoption of technologies like connected devices, augmented reality, and machine learning has changed the way we shop, and retailers are evolving how they do business to meet the needs of their customers.
Retailers say it’s no longer enough to keep pace with shoppers’ growing expectations—they must get ahead of them. That’s why more and more are turning to the cloud. They’re using it to eliminate data silos and take advantage of cloud-based analytics. They’re tapping into machine learning to improve all aspects of the value chain. And they’re making use of reliable and secure cloud infrastructure to scale their businesses.
Although every retail customer is different, many of them share similar objectives. Here are three major ways retailers take advantage of the cloud.
Storing and Analyzing Data in the Cloud
Data presents both a challenge and an opportunity for retailers. Which is why Ulta Beauty, the largest beauty retailer in the US, is moving to Google Cloud Platform (GCP). Now, with the help of BigQuery, Ulta Beauty will be able to more efficiently predict and analyze outcomes and develop more meaningful data insights that can be leveraged to deliver a more personalized, relevant guest journey.
They are not alone. DSW has also chosen to use GCP to help relaunch their DSW VIP loyalty program for the first time in over 10 years. With more than 90% of transactions running through their loyalty program, DSW needed a flexible and scalable solution to deliver a real-time loyalty program for 26 million active members. They’ve already seen a 9% uptick in new customers and have improved their already strong retention rate.
Improving Customer Experiences with AI and Machine Learning
Once retailers are able to access these insights, they are turning to AI to help personalize the overall shopping experience. At first, retail companies leveraged AI tools such as machine learning for product recommendations.
Now, more retailers use AI to forecast trends, predict inventory needs and prevent
Just look at METRO AG, one of the largest B2B wholesalers globally. They’re using AI and machine learning to better serve their customers. For example, many of their customers are restaurant owners. With Google Cloud AI capabilities, they can create tools that identify when a restaurant is out of a particular ingredient and automatically order more.
Ocado is another great example. The world’s largest online-only grocery retailer drove a 3.5% increase in contact center efficiency by using Google Cloud machine learning technology to respond to customer emails four times faster.
To help businesses further accelerate their AI solutions, Google has developed the Advanced Solutions Lab (ASL), which gives businesses the opportunity to work side-by-side with Google’s AI and ML experts to solve high impact challenges.
Fast Retailing, the Japanese retailer behind Uniqlo, is working with Google Cloud and ASL to help them better analyze customer data to forecast demand and deeply understand what their customers want.
Carrefour, one of the world’s leading retailers, also announced last year that its engineers will be working side-by-side with our AI experts to co-create new consumer experiences. This is in addition to deploying G Suite to their employees to support the company’s digital transformation.
Scaling Infrastructure to Meet Demand
Of course, none of this innovation is possible without a reliable infrastructure that can scale instantly to meet surges in traffic.
And many have found the reliability and security they need with the cloud. That’s why global cosmetics brand Lush chose Google Cloud. They migrated their e-commerce platform to GCP to handle increased traffic without compromising stability.
This move that ultimately reduced infrastructure hosting costs by 40 percent.
L.L.Bean also modernized its IT infrastructure by moving capabilities from its on-premises systems to GCP, improving customer satisfaction and IT efficiency across multiple sales channels.
How Constellation Brands’ Direct-to-Customer Tech Delivers Economic Impact across Business Portfolio

6280
Of your peers have already read this article.
3:00 Minutes
The most insightful time you'll spend today!
Editor’s note: Today we’re hearing from Ryan Mason, Director, Head of DTC Growth & Strategy, at alcoholic beverage firm, Constellation Brands on the company’s shift to Direct-to-Consumer (DTC) sales and how Google Cloud’s powerful technology stack helped with this transformation.
It’s no secret that consumer businesses have been up-ended in a lasting manner after 18 months of the pandemic. Consumers have been forced to shop differently over the past year – and as a result, they’ve evolved to be more comfortable with online spending and have grown to expect a certain level of convenience. While the e-commerce share of consumer sales has grown steadily over the past decade, the pandemic was the catalyst for the famous “10 years of growth in 3 months” which many argue is here to stay.
Facing this reality head-on, we placed a new emphasis on Direct-to-Consumer (DTC) with our acquisition of Empathy Wines, a DTC-native wine brand that sells directly to consumers via e-commerce. To accelerate our innovation in the DTC space, we added headcount and new functions to the existing Empathy team and empowered the newly-minted DTC group to apply their digital commerce operating model across the rest of the wine and spirits portfolio, which includes Robert Mondavi Winery, Meiomi Wines, The Prisoner Wine Company, High West Whiskey, and more.
One pandemic and one year later, DTC sales have surged in the wine and spirits category with Constellation positioned as a leader armed with a unique and powerful cloud technology stack, best-in-class e-commerce user experiences, modernized fulfillment solutions, and data-driven growth marketing.
Benefits of Going DTC
A report from McKinsey estimates that the strategic business shift to DTC has been accelerated by two years because of the pandemic and argues that consumer brands that want to thrive will need to aim for a 20% DTC business or higher, which is already taking shape in the market: Nike’s direct digital channels are on track to make up 21.5% of the total business by the end of 2021, up from 15.5% in the last fiscal year, and Adidas is aiming for 50% DTC by 2025. But outside of the clear revenue upside, the auxiliary benefits of going DTC are robust.
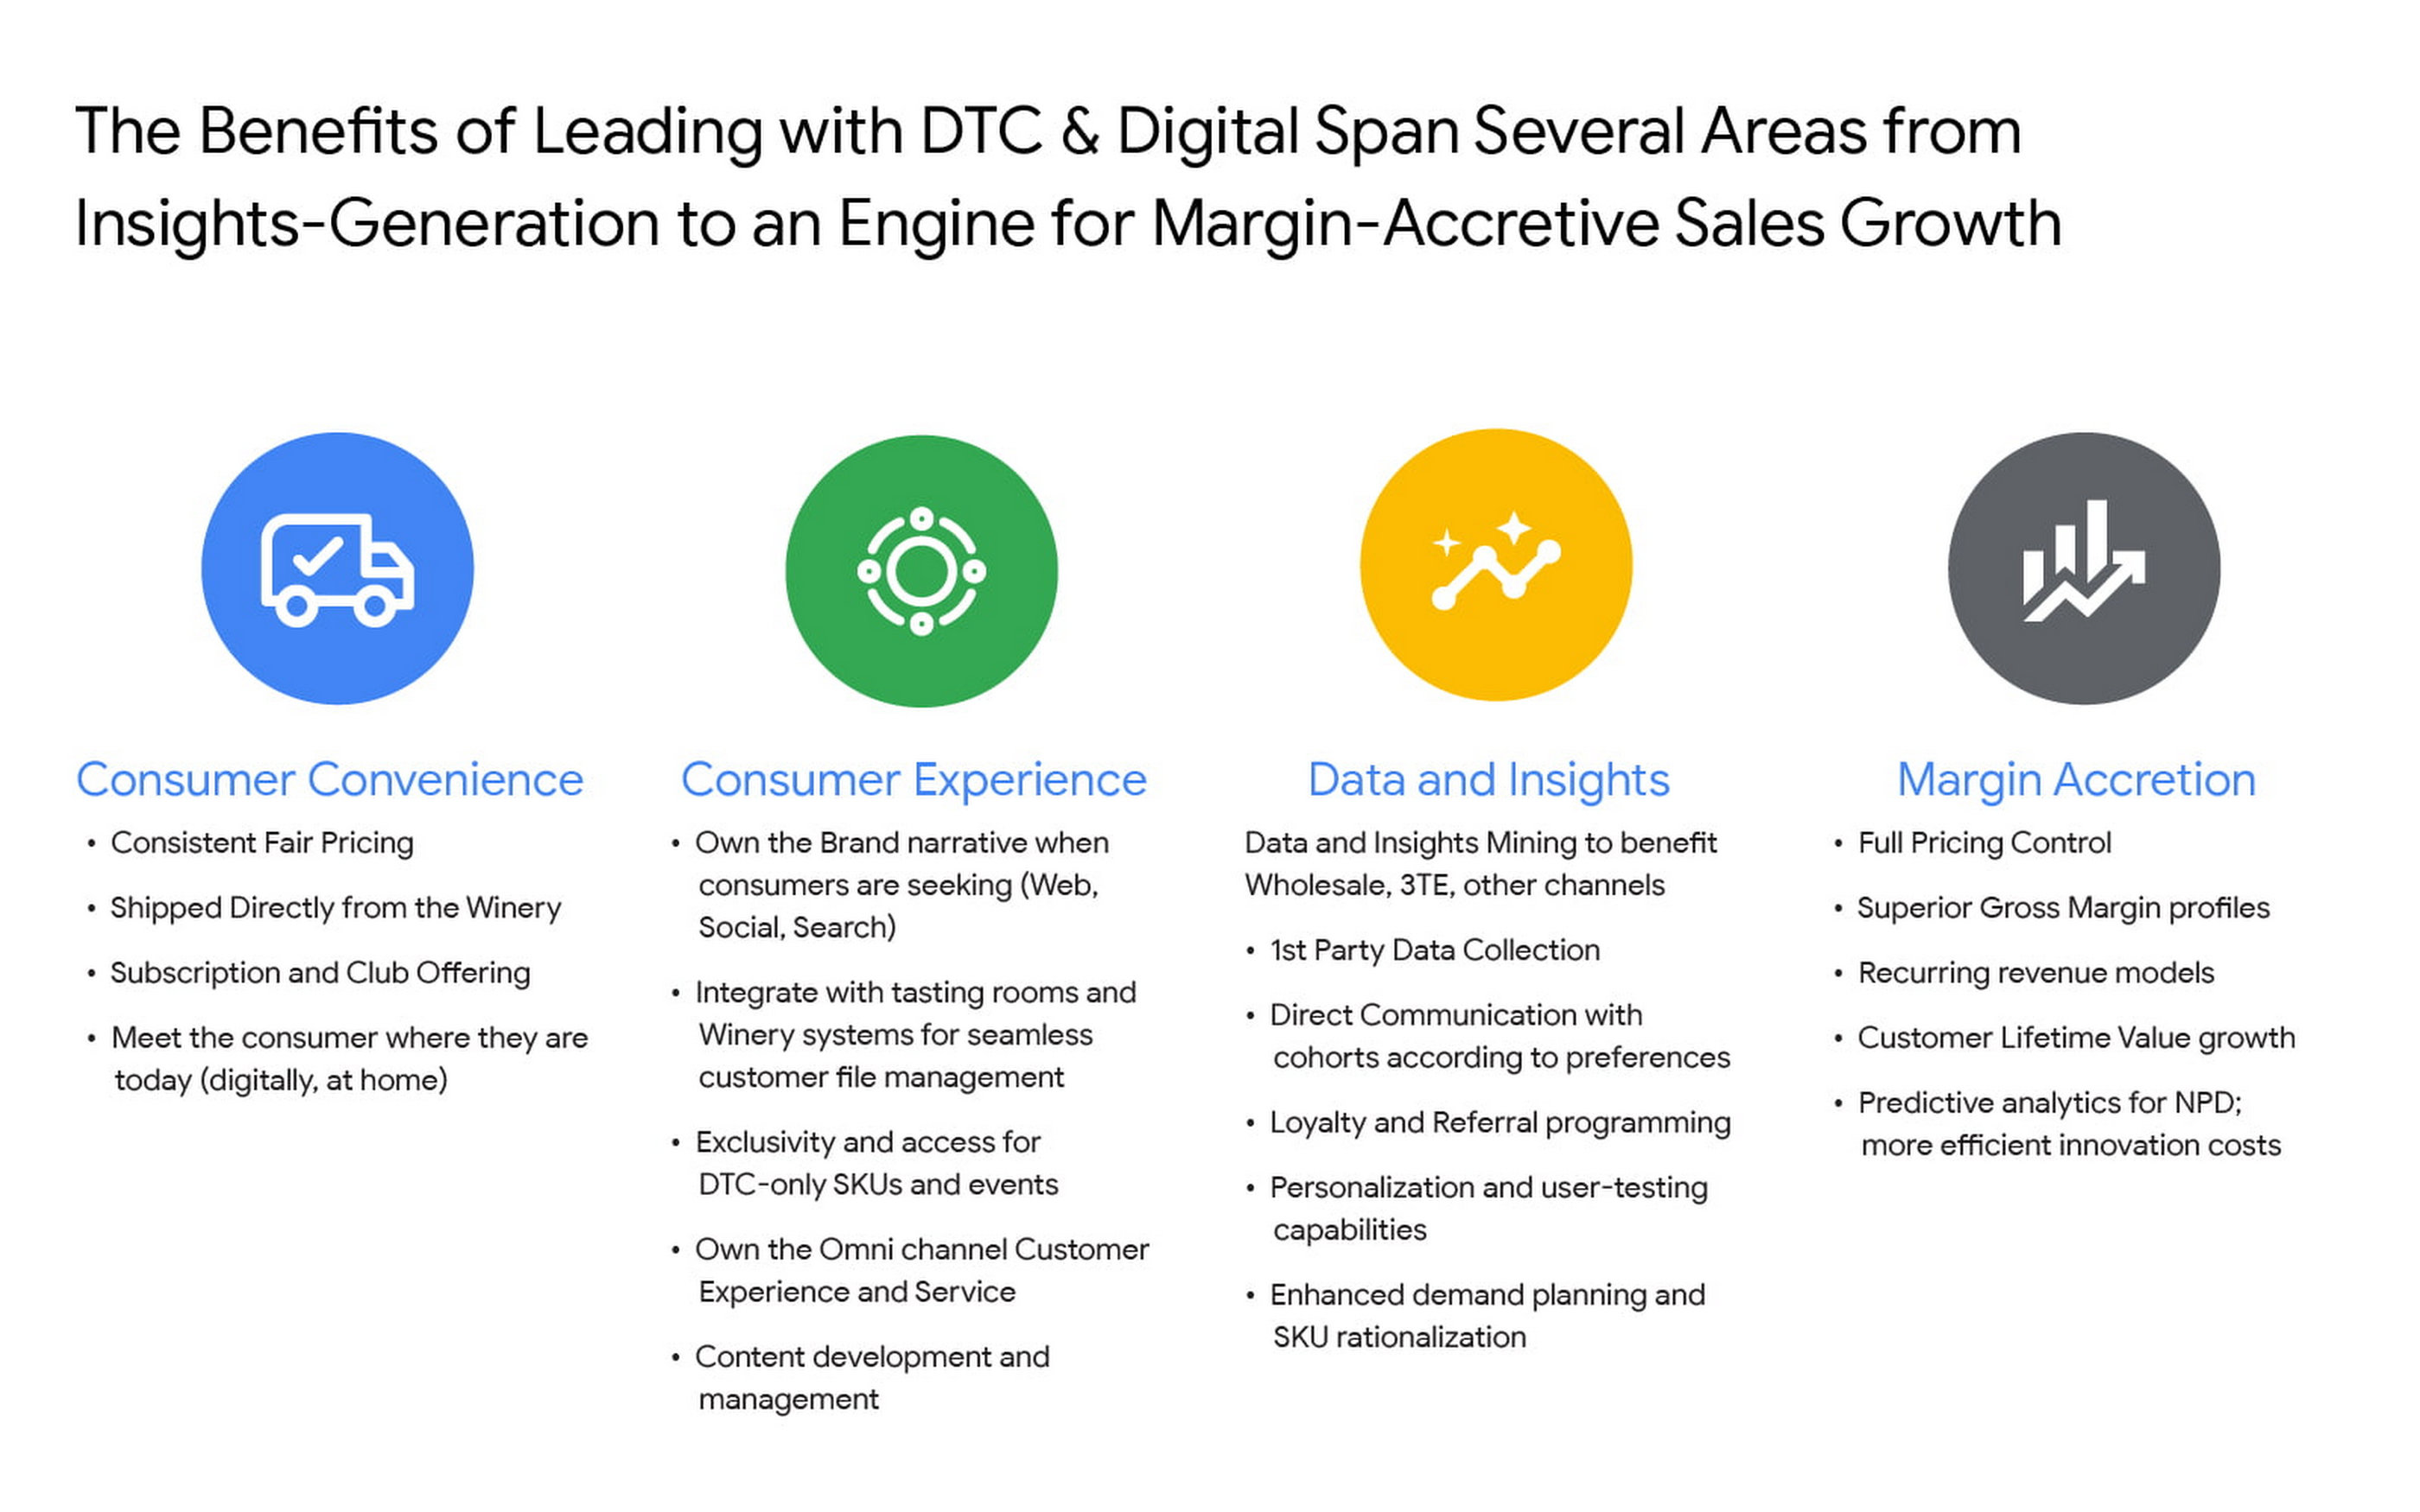
For Constellation Brands, each of these four pillars ring true, and our shift toward DTC is as much about margin accretion and revenue mix management as it is about consumer insights and data. The added complexities of the alcohol space add wrinkles to our DTC approach and manifest in many areas like consumer shopping preference, shipping and logistics hurdles, and more. In order to win share early and continue to lead the category, we recognized the need to harness the immense amount of first-party data to power impactful and actionable insights.
Our DTC technology architecture has fostered a value chain that is completely digitized: website traffic, marketing expenditures, tasting room transactions, e-commerce transactions, logistics and fulfillment events, cost of goods sold (COGS) and margin profiles, etc. are recorded and stored in a data warehouse in real time. For the first time, at any given moment, we can easily and deterministically answer complex business questions like “what is the age and gender distribution of my customers from Los Angeles who have purchased SKU X from Brand.com Y in the last 6 months? What is the cohort net promoter score? Did that increase after we introduced same-day shipping in this zip code? By how much?”
The ability to answer these questions and understand the root causes allows us to stay nimble with product offerings and iterate marketing strategies at the speed of consumer preference. Further, it enables us to optimize our omnichannel presence in the same manner by leaning on DTC consumer insights to develop valuable strategies with key wholesale distribution partners and 3-Tier eCommerce partners like Drizly and Instacart. At its core, Constellation’s DTC practice is designed to be the consumer-centric “tip-of-the-spear” responsible for generating insights from which all sales channels, including wholesale, can benefit.
Constellation’s DTC technology approach prioritizes consumer-centricity and insights generation
We have taken a modern approach to building a digital commerce technology stack, leveraging a hub-and-spoke model built around Shopify Plus and other key emergent technology providers like email provider Klaviyo, loyalty platform Yotpo, Net Promoter Score measurer Delighted, Customer Service module Gorgias, payments processor Stripe, event reservations platform Tock, and many more. For digital marketing and analytics, we use Google Cloud and Google Marketing Platform, which includes products like Analytics 360, Tag Manager 360, and Search Ads 360.
To help gather, organize, and store all of the inbound data from the ecosystem, we partnered with SoundCommerce, a data processing platform for eCommerce businesses. Together with SoundCommerce, we are able to automate data ingestion from all endpoints into a central data warehouse in Google BigQuery. With BigQuery, our data team is able to break data silos and quickly analyze large volumes of data that help unlock actionable insights about our business. BigQuery itself allows for out-of-the-box predictive analytics using SQL via BigQuery ML, and a key differentiator for us is that all Google Marketing Platform data is natively accessible for analysis within BigQuery.
But data possession only addresses half of the opportunity: we needed a powerful and modern business intelligence platform to help make sense of the vast amounts of data flowing into the system. Core to the search was to find a partner that approached BI in a way that fit with our future-looking strategy.
Our DTC team relies on the accurate measurement of variable metrics like Customer Acquisition Cost (CAC), Customer Lifetime Value (CLV), Churn, and Net Promoter Score (NPS) as a bellwether of the health of the business and monitoring these figures on a daily basis is paramount to success. To enable us to keep an accurate pulse on strategic KPIs, we considered several incumbent BI platforms. Ultimately we selected Google Cloud’s Looker for a range of benefits that separated it from the rest of the pack.

From a vision perspective, in this particular case we felt Looker was most aligned with our belief that better decisions are made when everyone has access to accurate, up-to-date information. Looker allows us to realize that vision by surfacing data in a simple web-based interface that empowers everyone to take action with real-time data on critical commercial activities. Furthermore, Looker’s ability to automate and distribute formatted modules to a myriad of stakeholders on a regular cadence increases data literacy and business performance transparency.
From a product perspective, we chose Looker for it’s cloud offering, web-based interface, and centralized, agile modeling layer that creates a trusted environment for all users to confidently interact with data — without any actual data extraction. While other BI tools have centralized semantic layers that require skilled IT resources, we’ve experienced that those can lead to bottlenecks and limited agility. With Looker’s semantic layer, LookML, our BI Team, led by Peter Donald, can easily build upon their SQL knowledge to add both a high degree of control as well as flexibility to our data model. The fully browser-based development environment allows the data team to rapidly develop, test, and deploy code and is backed by robust and seamless Git source code management.
In parallel, LookML empowers business users to collaborate without the need for advanced SQL knowledge. Our data team curates interactive data experiences with Looker to help scale access and adoption. Business users can explore ad hoc analysis, create dashboards, and develop custom data experiences in the web-based environment to get the answers they need without relying on IT resources each time they have a new question, while also maintaining the confidence that the underlying data will always be accurate. This helps us meet our primary goal of providing all businesses users with the data access they need to monitor the pulse of key metrics in near real-time.
Impact and future of DTC BI at Constellation
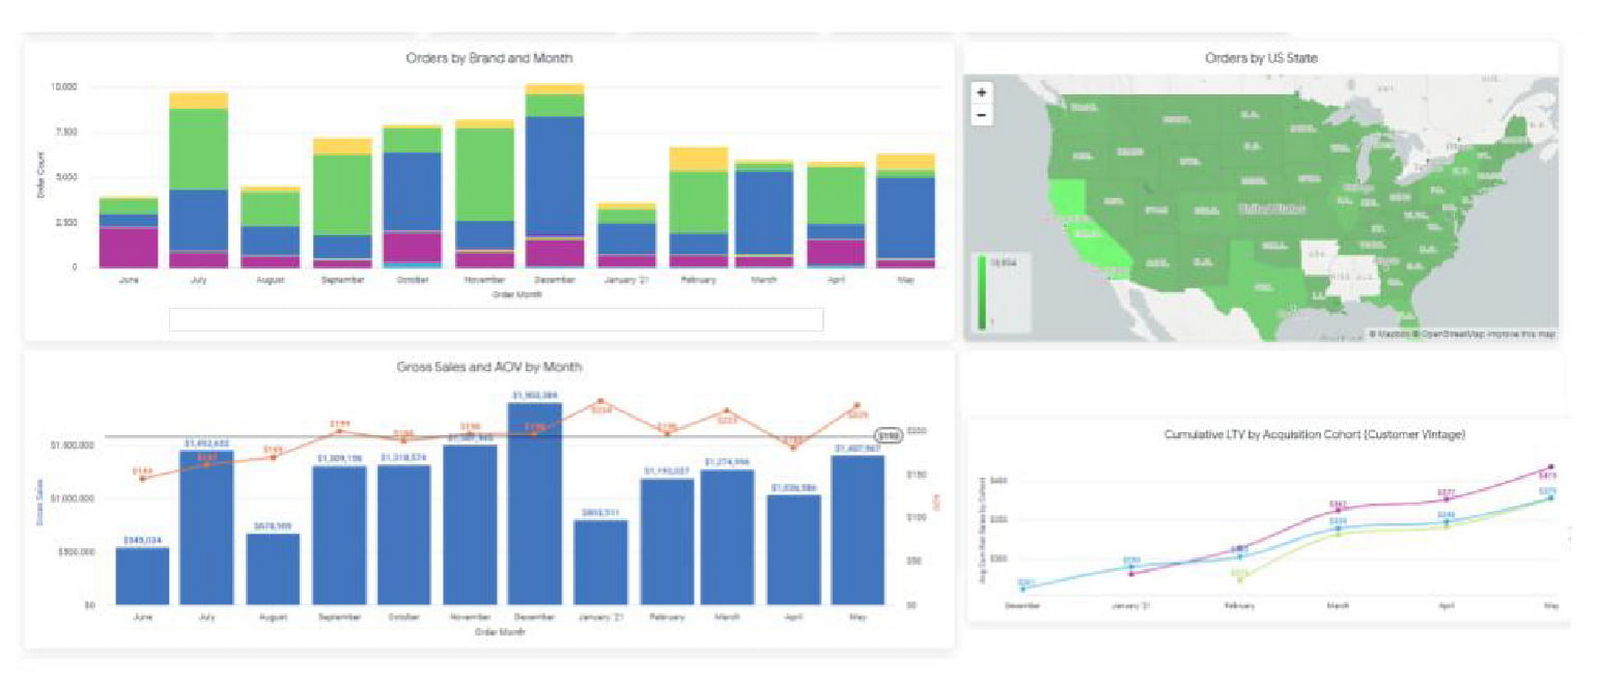
In short order, taking a modern and integrated approach to the DTC technology stack has delivered economic impact across the portfolio, helping our team understand and combat customer churn, increase conversion rates, and optimize the customer acquisition cost (CAC) and customer lifetime value (CLV) ratios. Perhaps most important is the benefit it can provide to the customer base. Mining customer data and consumer behavior generates data into what our customers are seeking, giving us insights to supply more, or less of it. For example, observing sales velocity and conversion rates by SKU or by region can help us better understand changes in customer taste profiles and fluctuations in demand, providing the foundation for a more powerful innovation pipeline and more effective sales and distribution tactics in wholesale. Our team has also been an early pilot tester for Looker’s new integration with Customer Match, which contributes to the virtuous cycle between data insight and data activation. In the future, our plan is to leverage this cycle to amplify the impact of Google Ads across Search, Shopping, and YouTube placements for the wine and spirits portfolio.
The operational impact of Looker is also substantial: our team estimates that the number of hours needed to reach critical business decisions has been reduced by nearly 60%, boosting productivity and accelerating the daily operating rhythm. A thoughtfully curated technology stack together with a modern BI solution allows us to stay at the vanguard of the industry. While the DTC sales channel is not designed to surpass the core business of wholesale for Constellation in terms of size, the approach enables unparalleled insights and measurement abilities that will pay dividends for the entire business for years to come.
Uniting Data and Analytics in One Place: Apache Iceberg and BigLake

1140
Of your peers have already read this article.
2:30 Minutes
The most insightful time you'll spend today!
When your data is siloed data across lakes and warehouses, it can be hard to transform outcomes with your data. Apache Iceberg is an open table format that provides data management capabilities for data hosted on object stores and enables organizations to run analytics and AI use cases over a single copy of data. A growing community of data engineers, customers, and industry partners are contributing, integrating, and deploying Iceberg, making it the standard for organizations building open-format lakehouses.
To help customers on this journey, we announced support for Iceberg through BigLake in October, 2022. Since its preview, many customers have started building lakehouse workloads using Apache Iceberg as their data management layer, and this support is now generally available.
Unify analytics, streaming and AI use cases over a single copy of data
You can use open-source engines to process and ingest data into Iceberg tables, and BigQuery can query those tables. Since the preview, customers have also used Spark, Trino and Flink to process Iceberg tables and make those tables available to their BigQuery users. Then, BigLake Metastore provides shared metadata for Iceberg tables across BigQuery and open-source engines, eliminating the need to maintain multiple table definitions. Further, you can provide BigQuery datasets and table properties when creating new Iceberg tables in Spark, and those tables become automatically available for the BigQuery user to query.
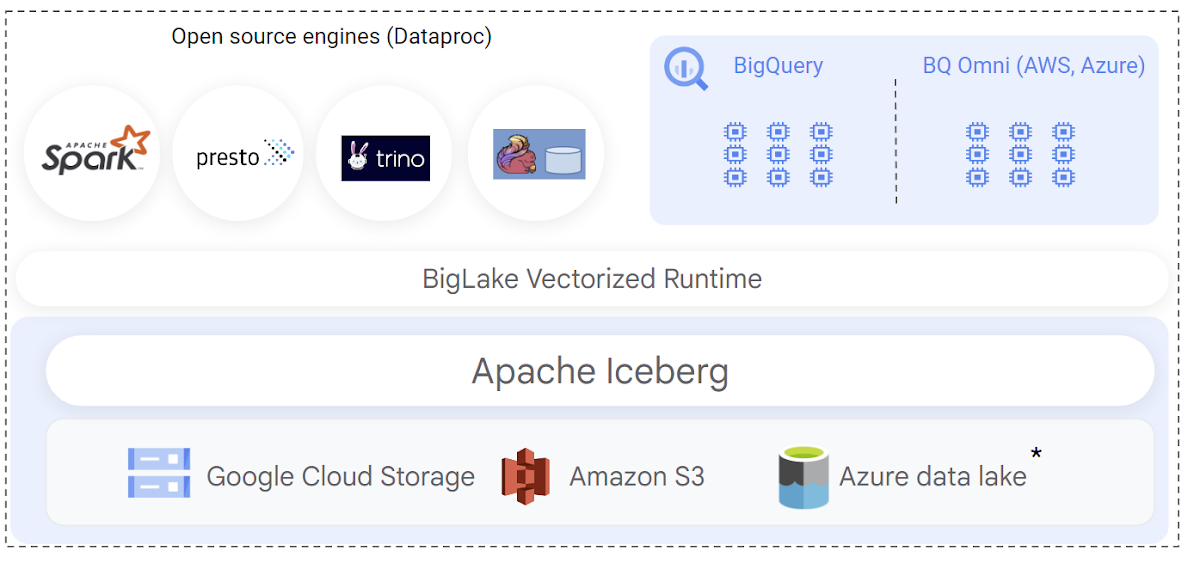
When implementing Iceberg lakehouse workloads, query performance is a top priority for data warehouse users. BigQuery natively integrates with the Iceberg transaction logs and leverages its rich metadata for efficient query planning. Query plans are designed to reduce BigQuery compute consumption by lowering the amount of scanned data, by optimizing joins, and by improving data-plane parallelism. The net result is that you get better query performance and lower slot usage when querying BigLake Iceberg tables.
This GA release also adds support to provide automatic synchronization of table schema in BigQuery when the table is modified through an open-source engine.
Engine-agnostic, industry-leading security and governance built-in
Customers have been telling us that building Iceberg lakehouses in a secure and governed manner is a top priority. BigLake support for Iceberg provides fine-grained access control, including row- and column-level security as well as data masking to simplify this. These features are designed to work independently of the query engine. During the preview, we expanded BigQuery to also support differential privacy for all tables including Iceberg.
You can also define security policies on a BigLake Iceberg table using BigQuery. Security policies are then enforced regardless of the query engine used — BigQuery natively enforces these policies at runtime, and open-source engines can securely access the data using the BigQuery Storage API. The BigQuery Storage API enforces the security policies at the data-plane layer, and is offered via pre-built connectors for Spark, Trino, Presto and TensorFlow. You can also use client libraries to build connectors for custom applications.
New use cases with multi-cloud Iceberg lakehouse
The open nature of Apache Iceberg lets you build multi-cloud lakehouses with uniform management of data. With this launch, you can now create BigLake Iceberg tables on Amazon S3, and query them using BigQuery Omni. BigLake’s performance and fine-grained access control features seamlessly extend to multi-cloud Iceberg tables, so you can securely perform cross-cloud analytics with BigQuery. We’ll extend similar support to Azure data lake Gen 2 in the coming weeks.
Apache Iceberg’s format uniformity across clouds also enables new data sharing use cases to help you share data with your customers, partners and suppliers, regardless of which cloud they are using. BigLake Iceberg tables on Cloud Storage or on Amazon S3 can be shared through Analytics Hub and consumed via BigQuery or OSS engines via BigQuery Storage Read API, providing an open sharing standard and the flexibility to use multiple query engines. A notable example of this is the recently announced Salesforce Data Cloud data sharing use case, which enables bi-directional cross-cloud data sharing between Salesforce and BigQuery and which is powered by Iceberg.
Getting started
To create and query your first Iceberg table, following the documentation. or run a quick proof of concept on our analytics lakehouse with the Iceberg jump start solution.
Cart.com to Transform e-Commerce for Brands Globally

8770
Of your peers have already read this article.
1:30 Minutes
The most insightful time you'll spend today!
The ecommerce playing field has been hard to navigate for most retailers, and Cart.com is on a mission to change that. Traditionally, retailers needing to run their online store, order fulfillment, customer service, marketing, and other essential activities have had to cobble together systems to get the capabilities they need – much less having access to analytics across these functions. The result is costly, siloed ecommerce operations that are difficult to manage and scale.
It’s clearly not a formula for success, yet that’s the reality facing most retailers. Cart.com, in contrast, has set out to democratize ecommerce by giving brands of all sizes the full capabilities they need to take on the world’s largest online retailers. Our end-to-end environment empowers retailers to keep more of their revenue, set up proven strategies for managing all aspects of their business, and act on valuable insights from customer data every step of the way.
Together with our talented team, we’re building a unified ecommerce platform that already provides value to many leading or up and coming brands including Whataburger, GUESS, Dr. Scholl’s, Rowing Blazers, and Howler Bros.
We’re excited about the opportunity ahead as we reimagine traditional approaches to online sales, fulfillment, marketing, accessing growth capital, providing a unified view of all ecommerce and marketing analytics, and other activities. Expectations for Cart.com are high, and we are building a company that can scale to $100B in revenue and beyond. Supported by the Startup Program by Google Cloud and Google Cloud solutions, we’re establishing a technology platform to transform all aspects of ecommerce for brands worldwide.
Partner in disruption
At Cart.com, we’re currently targeting an underserved market. Our ideal customer is beyond demonstrating product-market-fit and is now at an inflection point seeking a growth opportunity. Typically, those companies are generating between $1M and $100M in annual revenue. We’ve seen an enthusiastic response from brands and retailers as well as investors, with backing from investors in just over a year totaling $143 million in three funding rounds.
Our strategy is to build an integrated ecommerce model that combines best-of-breed solutions, many of which we gain through acquisitions and then build upon to provide a streamlined and fully integrated experience for our brands. We’ve made seven acquisitions so far to round out our online store, order fulfillment, marketing services, customer service, and we have launched some integral partnerships including easy access to growth capital through our relationship with Clearco and product protection for customers on every purchase with Extend. Instead of acquiring a data company, we’re building our data platform on Google Cloud, across each operating function for a single-view for brands to harness actionable data. We see Google Cloud as the leader for data management, analytics, machine learning (ML) and artificial intelligence (AI).
Other reasons why we’re building our business on Google Cloud include scalability, excellence, security, reach, and data analytics that are far superior to other environments.
We also feel a cultural and mission alignment with Google Cloud and envision leaning into a long-term partnership of marketing, selling, and disrupting the disruptors together. Equally important to us are the investments Google Cloud is willing to make in early-stage companies like ours. The support through the Google Cloud for Startups program has been outstanding.
Built on Google Cloud
A wide range of Google Cloud solutions provide the foundation for our platform. For instance, Cloud Pub/Sub keeps our services communicating with one another. We rely on fully managed relational databases, like Cloud SQL and Cloud Spanner, to securely handle the huge volume of brand and shopper data generated every day.
Cloud Run allowed us to develop inside of containers before our Kubernetes infrastructure was ready to go. Now, we are taking advantage of all the capabilities in Google Kubernetes Engine. BigQuery integrates with all Google Cloud solutions and offers true data streaming natively out of the box, along with Dataflow for advanced analytics. We also use Container Registry to store and manage our Docker container images. Right now, we’re testing Cloud Composer to evaluate using it for data workflow orchestration instead of Apache Airflow.
The openness of the Google Cloud environment is further enabled by Anthos, which we may deploy soon to perform data integrations quickly as we acquire more companies over the next year. For example, if we acquire a company using Azure, we can easily align it with our Google Cloud ecosystem.
Enabling ecommerce 2.0
Recently, our team has been experimenting with Google Cloud Vertex AI and the fully managed services of AI deployment and ML operations. The capabilities would save us substantial time in the management of the ML lifecycle which allows us to focus more on developing proprietary AI that will transform commerce at scale.
Because Google Cloud is so far ahead in data science, our teams benefit from deep Google Cloud expertise as we look to provide brands with unmatched insights into customers to improve services and revenue. We’re also planning to test Recommendations AI among other tools to deploy customer product recommendations and personalization as turnkey productized offerings. Moving forward, we will likely use Bigtable to aid in serving machine learning to hundreds of thousands of brands due to its low latency and scalability.
Fanatical about brand success
We know that our work with Google Cloud for Startups and use of Google Cloud solutions for best-in-class data management, analytics, ML, and AI will enable us to offer even more transformative services to brands.
We also see the opportunity to use our platform and customer insights to break down barriers between brands, enabling retailers to share information and work better together when it’s in their best interests. What we’re building today on Google Cloud is fundamentally changing what’s possible for retailers of any size everywhere.
As a startup, when recruiting talent or working with prospective customers, it helps to share our success with Google Cloud. We view them as an extension of the Cart.com team. It also validates our business as we continue building a more integrated, holistic approach to commerce that opens new opportunities and drives growth for brands worldwide.
For more details about Cart.com’s vision for unified ecommerce, check out our video.
If you want to learn more about how Google Cloud can help your startup, visit our page here to get more information about our program, and sign up for our communications to get a look at our community activities, digital events, special offers, and more.
BigQuery Explainable AI for Demystifying the Inner Workings of ML Models. Now GA!

6557
Of your peers have already read this article.
2:00 Minutes
The most insightful time you'll spend today!
Explainable AI (XAI) helps you understand and interpret how your machine learning models make decisions. We’re excited to announce that BigQuery Explainable AI is now generally available (GA). BigQuery is the data warehouse that supports explainable AI in a most comprehensive way w.r.t both XAI methodology and model types. It does this at BigQuery scale, enabling millions of explanations within seconds with a single SQL query.
Why is Explainable AI so important? To demystify the inner workings of machine learning models, Explainable AI is quickly becoming an essential and growing need for businesses as they continue to invest in AI and ML. With 76% of enterprises now prioritizing artificial intelligence (AI) and machine learning (ML) over other initiatives in 2021 IT budgets, the majority of CEOs (82%) believe that AI-based decisions must be explainable to be trusted according to a PwC survey.
While the focus of this blogpost is on BigQuery Explainable AI, Google Cloud provides a variety of tools and frameworks to help you interpret models outside of BigQuery, such as with Vertex Explainable AI, which includes AutoML Tables, AutoML Vision, and custom-trained models.
So how does Explainable AI in BigQuery work exactly? And how might you use it in practice?
Two types of Explainable AI: global and local explainability
When it comes to Explainable AI, the first thing to note is that there are two main types of explainability as they relate to the features used to train the ML model: global explainability and local explainability.
Imagine that you have a ML model that predicts housing price (as a dollar amount), based on three features: (1) number of bedrooms, (2) distance to the nearest city center, and (3) construction date.
Global explainability (a.k.a. global feature importance) describes the features’ overall influence on the model and helps you understand if a feature had a greater influence than other features over the model’s predictions. For example, global explainability can reveal that the number of bedrooms and distance to city center typically has a much stronger influence than the construction date on predicting housing prices. Global explainability is especially useful if you have hundreds or thousands of features and you want to determine which features are the most important contributors to your model. You may also consider using global explainability as a way to identify and prune less important features to improve the generalizability of their models.
Local explainability (a.k.a. feature attributions) describes the breakdown of how each feature contributes towards a specific prediction. For example, if the model predicts that house ID#1001 has a predicted price of $230,000, local explainability would describe a baseline amount (e.g. $50,000) and how each of the features contributes on top of the baseline towards the predicted price. For example, the model may say that on top of the baseline of $50,000, having 3 bedrooms contributed an additional $50,000, close proximity to the city center added $100,000, and construction date of 2010 added $30,000, for a total predicted price of $230,000. In essence, understanding the exact contribution of each feature used by the model to make each prediction is the main purpose of local explainability.
What ML models does BigQuery Explainable AI apply to?
BigQuery Explainable AI applies to a variety of models, including supervised learning models for IID data and time series models. The documentation for BigQuery Explainable AI provides an overview of the different ways of applying explainability per model. Note that each explainability method has its own way of calculation (e.g. Shapley values), which are covered more in-depth in the documentation.

Examples with BigQuery Explainable AI
In this next section, we will show three examples of how to use BigQuery Explainable AI in different ML applications:
Regression models with BigQuery Explainable AI
Let’s use a boosted tree regression model to predict how much a taxi cab driver will receive in tips for a taxi ride, based on features such as number of passengers, payment type, total payment and trip distance. Then let’s use BigQuery Explainable AI to help us understand how the model made the predictions in terms of global explainability (which features were most important?) and local explainability (how did the model arrive at each prediction?).
The taxi trips dataset comes from the BigQuery public datasets and is publicly available in the table: bigquery-public-data.new_york_taxi_trips.tlc_yellow_trips_2018.
First, you can train a boosted tree regression model.
CREATE OR REPLACE MODEL bqml_tutorial.taxi_tip_regression_modelOPTIONS (model_type='boosted_tree_regressor',input_label_cols=['tip_amount'],max_iterations = 50,tree_method = 'HIST',subsample = 0.85,enable_global_explain = TRUE) ASSELECTvendor_id,passenger_count,trip_distance,rate_code,payment_type,total_amount,tip_amountFROM`bigquery-public-data.new_york_taxi_trips.tlc_yellow_trips_2018`WHERE tip_amount >= 0LIMIT 1000000
Now let’s do a prediction using ML.PREDICT, which is the standard way in BigQuery ML to make predictions without explainability.
SELECT *FROMML.PREDICT(MODEL bqml_tutorial.taxi_tip_regression_model,(SELECT"0" AS vendor_id,1 AS passenger_count,CAST(5.85 AS NUMERIC) AS trip_distance,"0" AS rate_code,"0" AS payment_type,CAST(55.56 AS NUMERIC) AS total_amount))

But you might wonder—how did the model generate this prediction of ~11.077?
BigQuery Explainable AI can help us answer this question. Instead of using ML.PREDICT, you use ML.EXPLAIN_PREDICT with an additional optional parameter top_k_features. ML.EXPLAIN_PREDICT extends the capabilities of ML.PREDICT by outputting several additional columns that explain how each feature contributes to the predicted value. In fact, since ML.EXPLAIN_PREDICT includes all the output from ML.PREDICT anyway, you may want to consider using ML.EXPLAIN_PREDICT every time instead.
SELECT *FROMML.EXPLAIN_PREDICT(MODEL bqml_tutorial.taxi_tip_regression_model,(SELECT"0" AS vendor_id,1 AS passenger_count,CAST(5.85 AS NUMERIC) AS trip_distance,"0" AS rate_code,"0" AS payment_type,CAST(55.56 AS NUMERIC) AS total_amount),STRUCT(6 AS top_k_features))

The way to interpret these columns is:
Σfeature_attributions + baseline_prediction_value = prediction_value
Let’s break this down. The prediction_value is ~11.077, which is simply the predicted_tip_amount. The baseline_prediction_value is ~6.184, which is the tip amount for an average instance. top_feature_attributions indicates how much each of the features contributes towards the prediction value. For example, total_amount contributes ~2.540 to the predicted_tip_amount.
ML.EXPLAIN_PREDICT provides local feature explainability for regression models. For global feature importance, see the documentation for ML.GLOBAL_EXPLAIN.
Classification models with BigQuery Explainable AI
Let’s use a logistic regression model to show you an example of BigQuery Explainable AI with classification models. We can use the same public dataset as before: bigquery-public-data.new_york_taxi_trips.tlc_yellow_trips_2018.
Train a logistic regression model to predict the bracket of the percentage of the tip amount out of the taxi bill.
CREATE OR REPLACE MODEL bqml_tutorial.taxi_tip_classification_modelOPTIONS(model_type='logistic_reg',input_label_cols=['tip_bucket'],enable_global_explain=true) ASSELECTvendor_id,passenger_count,trip_distance,rate_code,payment_type,total_amount,CASEWHEN tip_amount > total_amount*0.20 THEN '20% or more'WHEN tip_amount > total_amount*0.15 THEN '15% to 20%'WHEN tip_amount > total_amount*0.10 THEN '10% to 15%'ELSE '10% or less'END AS tip_bucketFROM`bigquery-public-data.new_york_taxi_trips.tlc_yellow_trips_2018`WHERE tip_amount >= 0LIMIT 1000000
Next, you can run ML.EXPLAIN_PREDICT to get both the classification results and the additional information for local feature explainability. For global explainability, you can use ML.GLOBAL_EXPLAIN. Again, since ML.EXPLAIN_PREDICT includes all the output from ML.PREDICT anyway, you may want to consider using ML.EXPLAIN_PREDICT every time instead.
SELECT *FROMML.EXPLAIN_PREDICT(MODEL bqml_tutorial.taxi_tip_classification_model,(SELECT"0" AS vendor_id,1 AS passenger_count,CAST(5.85 AS NUMERIC) AS trip_distance,"0" AS rate_code,"0" AS payment_type,CAST(55.56 AS NUMERIC) AS total_amount),STRUCT(6 AS top_k_features))

Similar to the regression example earlier, the formula is used to derive the prediction_value:
Σfeature_attributions + baseline_prediction_value = prediction_value
As you can see in the screenshot above, the baseline_prediction_value is ~0.296. total_amount is the most important feature in making this specific prediction, contributing ~0.067 to the prediction_value, though followed by trip_distance. The feature passenger_count contributes negatively to prediction_value by -0.0015. The features vendor_id, rate_code, and payment_type did not seem to contribute much to the prediction_value.
You may wonder why the prediction_value of ~0.389 doesn’t equal the probability value of ~0.359. The reason is that unlike for regression models, for classification models, prediction_value is not a probability score. Instead, prediction_value is the logit value (i.e., log-odds) for the predicted class, which you could separately convert to probabilities by applying the softmax transformation to the logit values. For example, a three-class classification has a log-odds output of [2.446, -2.021, -2.190]. After applying the softmax transformation, the probability of these class predictions is [0.9905, 0.0056, 0.0038].
Time-series forecasting models with BigQuery Explainable AI

Explainable AI for forecasting provides more interpretability into how the forecasting model came to its predictions. Let’s go through an example of forecasting the number of bike trips in NYC using the new_york.citibike_trips public data in BigQuery.
You can train a time-series model ARIMA_PLUS:
CREATE OR REPLACE MODEL bqml_tutorial.nyc_citibike_arima_modelOPTIONS(model_type = 'ARIMA_PLUS',time_series_timestamp_col = 'date',time_series_data_col = 'num_trips',holiday_region = 'US') ASSELECTEXTRACT(DATE from starttime) AS date,COUNT(*) AS num_tripsFROM`bigquery-public-data.new_york.citibike_trips`GROUP BY dateNext, you can first try forecasting without explainability using ML.FORECAST:SELECT*FROMML.FORECAST(MODEL bqml_tutorial.nyc_citibike_arima_model,STRUCT(365 AS horizon, 0.9 AS confidence_level))
This function outputs the forecasted values and the prediction interval. Plotting it in addition to the input time series gives the following figure.

But how does the forecasting model arrive at its predictions? Explainability is especially important if the model ever generates unexpected results.
With ML.EXPLAIN_FORECAST, BigQuery Explainable AI provides extra transparency into the seasonality, trend, holiday effects, level (step) changes, and spikes and dips outlier removal. In fact, since ML.EXPLAIN_FORECAST includes all the output from ML.FORECAST anyway, you may want to consider using ML.EXPLAIN_FORECAST every time instead.
SELECT*FROMML.EXPLAIN_FORECAST(MODEL bqml_tutorial.nyc_citibike_arima_model,STRUCT(365 AS horizon, 0.9 AS confidence_level))

Compared to the previous figure which only shows the forecasting results, this figure shows much richer information to explain how the forecast is made.
First, it shows how the input time series is adjusted by removing the spikes and dips anomalies, and by compensating the level changes. That is:
time_series_adjusted_data = time_series_data - spikes_and_dips - step_changes
Second, it shows how the adjusted input time series is decomposed into different components such as both weekly and yearly seasonal components, holiday effect component and trend component. That is
time_series_adjusted_data = trend + seasonal_period_yearly + seasonal_period_weekly + holiday_effect + residual
Finally, it shows how these components are forecasted separately to compose the final forecasting results. That is:
time_series_data = trend + seasonal_period_yearly + seasonal_period_weekly + holiday_effect
For more information on these time series components, please see the documentation here.
Conclusion
With the GA of BigQuery Explainable AI, we hope you will now be able to interpret your machine learning models with ease.
Thanks to the BigQuery ML team, especially Lisa Yin, Jiashang Liu, Amir Hormati, Mingge Deng, Jerry Ye and Abhinav Khushraj. Also thanks to the Vertex Explainable AI team, especially David Pitman and Besim Avci.
More Relevant Stories for Your Company

This Chart, from Home Depot, Dramatically Demonstrates the Power of a Cloud Data Warehouse
The Home Depot (THD) is the world’s largest home-improvement chain, growing to more than 2,200 stores and 700,000 products in four decades. Much of that success was driven through the analysis of data. This included developing sales forecasts, replenishing inventory through the supply chain network, and providing timely performance scorecards. However,

Make Meaningful Analysis with Geo Boundary Public Datasets on BigQuery
Geospatial data is a critical component for a comprehensive analytics strategy. Whether you are trying to visualize data using geospatial parameters or do deeper analysis or modeling on customer distribution or proximity, most organizations have some type of geospatial data they would like to use - whether it be customer

How Eventrac and Workflows Integration Helps Implement Hybrid Architecture in Google Cloud
I previously talked about Eventarc for choreographed (event-driven) Cloud Run services and introduced Workflows for orchestrated services. Eventarc and Workflows are very useful in strictly choreographed or orchestrated architectures. However, you sometimes need a hybrid architecture that combines choreography and orchestration. For example, imagine a use case where a message to a Pub/Sub topic

How to Enhance Incremental Pipeline Performance while Ingesting Data into BigQuery
When you build a data warehouse, the important question is how to ingest data from the source system to the data warehouse. If the table is small you can fully reload a table on a regular basis, however, if the table is large a common technique is to perform incremental
