





Earth Week: Google Cloud at the Heart of Sustainability

3481
Of your peers have already read this article.
1:30 Minutes
The most insightful time you'll spend today!
Today’s Google Doodle reminds us of the enormous changes our planet is experiencing due to climate change. Everyone, from businesses to governments to technologists, has the opportunity to meet this challenge — transforming themselves and their organizations to be more sustainable. For this Earth Day 2022, and indeed Earth Week, Google Cloud celebrates the organizations and individuals who are fighting climate change with innovative technology. We don’t want you to miss a thing, so here’s a recap of all our news in one handy location.
We asked global CEOs: what is it going to take to make progress on sustainability in your org?
In a survey of 1,500 CXOs across 16 countries, many executives say they are willing to do what it takes to have more sustainable practices. But despite their ambition, real measures of impact are lacking. To see what will change that, check out the blog.
We announced a new innovation challenge supporting climate science and research…
Our blog on Monday announced the Climate Innovation Challenge Research Credits program, to support researchers as they work to better understand climate change, increase climate resilience and develop new, promising solutions to urgent climate challenges. You can apply for research credits here.
…and shared stories of researchers making a difference
We interviewed Dr. Richard Fernandes from Natural Resources Canada, who built the LEAF toolbox that maps and assesses vegetation with satellite data from Google Earth Engine. You can read our Q&A here.
Canada has approximately 10 million square kilometers of land and the annual data volume of these maps is equivalent to streaming HD movies for over 750 hours non-stop. Cloud computing allows us to manage all this data in a useful and accessible way.Dr. Fernandes, Research Scientist
We also published a story about the U.S. Department of Agriculture’s Forest Service, and how they use Google Cloud processing and analysis tools to help sustainably manage 193 million acres of land.
We turned the lights on at new clean energy projects in four countries…
We shared details of our battery project in Belgium, solar projects in Denmark, and wind projects in Chile and Finland. Our battery project in Belgium is the first of its kind, enabling us to switch from diesel generators to a cleaner backup solution that will keep the internet up and running in the event of a power disruption. These will all help us continue to operate the cleanest cloud in the industry.

…and made it easier to learn how to build applications more sustainably
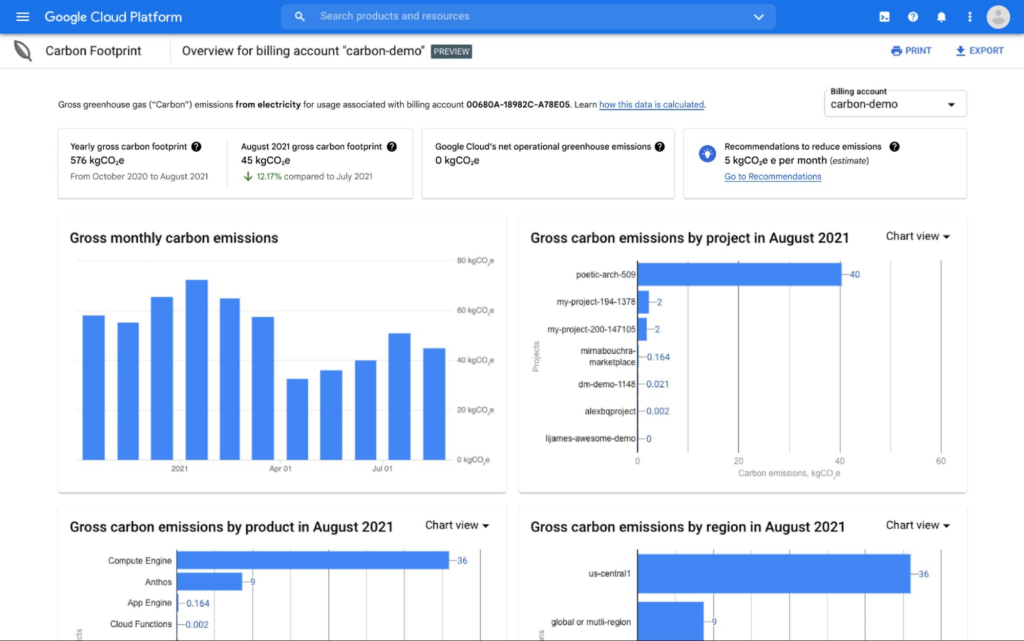
We launched a new lab that walks users through our Carbon Sense suite of products. From using our region picker app to make low-carbon architecture decisions, to analyzing the carbon footprint of your Google Cloud app with Carbon Footprint, we’re building sustainability into the tools you use every day. You can also find Carbon Footprint training in the new Data Warehouse Cloud On-Board.
We formed an ecosystem of partners to help accelerate sustainability projects…
The Google Cloud partner ecosystem is critical to helping our customers act sustainably today. A new whitepaper produced in partnership with Enterprise Strategy Group shares real-world solutions that could make an immediate impact — not in the next decade, but right now.
…and shared stories of innovative startups changing the game with Google Cloud.
Take Enexor and its partners, who are producing clean and sustainable energy from discarded plastics and agro-waste. The blog from Lee Jestings, Enexor Founder & CEO, shares how Google for Startups got them started, and which Google Cloud tools help them build predictive models. Check out their story.
Or Nuuly, the rental and resale business created by the URBN portfolio, which also includes Urban Outfitters, Anthropologie, and Free People. In the blog you can read how Nuuly is using technology to provide a sustainable experience to employees and customers — from upcycling clothing, to recyclable and reusable packaging.
Whether you’re a startup, scientist, executive or developer, at Google Cloud we’ll continue to work hard to help make your digital transformation a sustainable one.
Learn more about our sustainability work here, and don’t miss the inaugural Cloud Sustainability Summit this June. Register now.
Consumption Packs Shorten’s Customers Transition to Google Cloud and Boosts Partners’ Financial Growth

3244
Of your peers have already read this article.
2:00 Minutes
The most insightful time you'll spend today!
When we launched Partner Advantage, we committed to making it predictable and easy for partners to drive business with us. Since launch, those commitments have been validated by channel experts like CRN, which gave Partner Advantage a 5-Star award for 2022, and by the fact that our partners have seen impressive growth* across virtually every facet of their business.
I am pleased to announce that our commitments endure today with the launch of Consumption Packs for Deal Acceleration Funds and Partner Services Funds (DAF and PSF for partners). Inspired by partner feedback, these new packages are designed to accelerate all stages of a customer’s journey to the cloud, and make it even easier and faster for partners to do business with us.
Consumption Packs are purpose-built so that partners can plan and initiate customer projects much more quickly, with predictable funding. They include assets and templates that allow partners to deliver Google Cloud designed and validated infrastructure, application migration and modernization plans to customers faster than ever–particularly for customers beginning their journey to the cloud. Based on learnings gathered from thousands of customer deployments, these turnkey packs have been designed by our partners and Google Cloud Partner Engineering and Professional Services’ teams.
Here’s a brief look at Consumption Packs in action:
- Consumption Packs offer pre-approved, curated templates and assets to simplify and shorten the process for most common projects.
- For Deal Acceleration Funds (DAF), packages include everything partners need to conduct assessments, workshops and proofs-of-concept so they can quickly meet customers where they are on their journey to the cloud.
- For Partner Services Funds (PSF), packages are structured so that partners can develop cloud ready foundation and migration plans that align with Google Cloud priority solution areas.
- Packages have pre-determined funding levels to enable faster deployments.
Partners still have the option to engage with Google Cloud Partner Advantage and their customers through customized requests, as they always have. This is ideally suited for projects that require a tailored approach to meet unique customer requirements.
We are launching nine consumption packs today focused on key enterprise workloads, with a vision toward introducing additional packages to cover more solutions. Partners can explore Consumption Packs now by visiting the Partner Advantage portal.
We welcome your continued feedback and suggestions, and look forward to helping our customers achieve new levels of growth and success, together.
See you in the cloud.
- The Google Cloud Business Opportunity For Partners, a commissioned Total Economic Impact™ study conducted by Forrester Consulting, October 2021
Vodafone Leverages Google Cloud to Aid COVID-19 Frontline with Anonymized Insights on Population Mobility

11205
Of your peers have already read this article.
1:30 Minutes
The most insightful time you'll spend today!
Editor’s note: When Europe’s largest mobile communications company, Vodafone, was asked by the European Commission to help understand population movement across the European Union and the UK to help fight COVID-19, it was able to provide anonymized mobile network-based insights to answer the call. Here’s how Vodafone, with the support of Google Cloud, rapidly mobilized the COVID-19 frontline, while respecting its customers’ privacy.
With the emergence of COVID-19 in early 2020, the European Commission—the executive branch of the European Union (EU)—knew that technology would be instrumental in its fight to control the pandemic. With various lockdowns imposed across its member states, the Commission was keen to predict and prevent the spread of COVID-19 and to manage the related social, political and financial impacts.
Mobile network data helps track COVID-19 across the EU
Mobile networks produce location data, which can be turned into useful anonymous insights to understand population movement within a geographic area. The European Commission, working with mobile industry association GSMA (Groupe Speciale Mobile Association), asked Europe’s major mobile phone operators for help in producing insights to support the fight against COVID-19. As the largest mobile network operator within the EU, Vodafone saw this as a critical opportunity to participate.
Vodafone had previous experience of using mobile network data to support pandemic research. For example, in 2019, Vodafone provided mobility pattern analysis to help track the spread of Malaria in Mozambique. And, during the early stages of the COVID-19 pandemic (prior to working with the European Commission), Vodafone assisted the Italian and Spanish governments in understanding their citizens’ mobility patterns. Vodafone had also previously offered anonymized and aggregated population mobility insights to support public transport and tourism authorities and retail organizations in a number of countries. Consequently, Vodafone was perfectly placed to play a greater role in supporting the European Commission’s response to the pandemic.
When asked to assist the European Commission, Vodafone first considered how it could safely share its data with the governing body without providing details on the individual movements of its customers. It realized it could achieve this through an elaborate set of anonymization and aggregation techniques. Insights are aggregated from a minimum of 50 users and Vodafone only shared these anonymous insights and never the actual raw data with the Commission. As specified by the EU, these insights are then presented onto a large geographical region, typically a city or a county with thousands of people living in that area.
These insights illustrate how people move, helping to determine how lockdowns and self-isolation measures were impacting behaviors.
Using Google Cloud to collate and store population mobility data
In April 2020, Vodafone began migrating its operations, including its mobile data, to Google Cloud on servers in Europe and the UK with elaborate security safeguards, including encryption, building on a previous partnership.
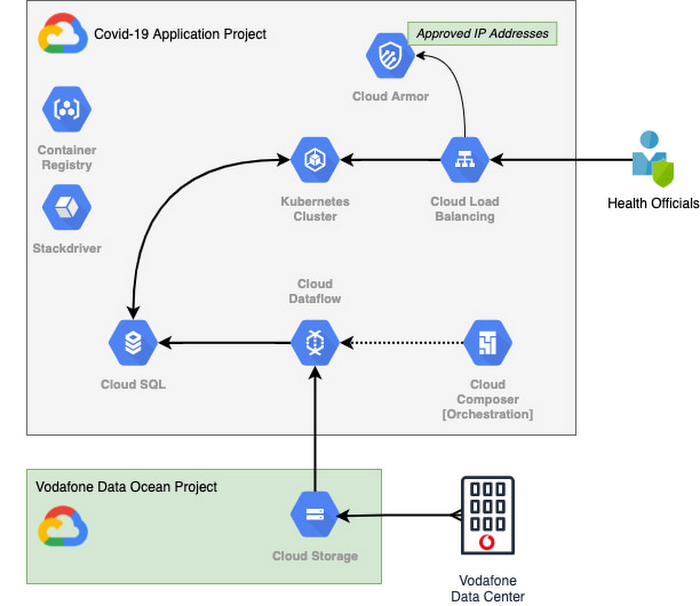
With the data residing in EU and UK data centers and not the United States, Vodafone could then retrieve anonymous insights from Google Cloud Storage instantaneously. Before supplying any information to the European Commission, however, Vodafone used Dataflow to validate the data and run a series of tests to ensure the database had accurate data, before ingesting and archiving the relevant metrics. For instant access, the data was then made available to the European Commission using a Redis database on Google Kubernetes Engine.
To ensure aggregate Vodafone customer data was always safe, secure, and anonymous, all entry points to the front-end were protected behind Google Cloud Armor, where only specific IP addresses were allowed. Using these tools, seamless data pipelines fed in predefined key performance indicators from each specified European market. While data quality measures ensured the definitions for metrics across markets were consistent and could be accurately compared.
The architecture (pictured below) shows how Vodafone integrated and anonymized its data on Google Cloud.
Live interactive dashboard shows population mobility in real-time
With its data integrated on Google Cloud, Vodafone created a live, interactive dashboard to track mobility patterns and share relevant information with the European Commission in real-time.
The European Commission Joint Research Center (JRC) was able to gather valuable information from these insights, which enabled them to see where population mobility was aiding the spread of the disease, when cross-referenced with health data. It could also assess the implications of lockdowns on different populations and forecast cross-country spreading.
Mobile data aids disease modeling for multiple stakeholders
The Vodafone data became instrumental in modeling the likely course of the disease too. For example, the University of Southampton in the UK used it to predict the outcome of different coordinated COVID-19 exit strategies across Europe. This research was published in Science Magazine in September 2020.
The Vodafone data dashboard continues to be used by individual governments, NGOs and organizations to further investigate the impacts of the pandemic and to measure the effectiveness of response strategies alongside the rollout of vaccination programs. The project also helped Vodafone win a DataIQ award for most effective stakeholder engagement.
Using the learnings from this project, Vodafone has been able to adapt its own B2B solution, called Vodafone Analytics, by adaptIng and migrating the code to work in Google Cloud Platform. This solution has been rolled out across Germany, Greece, Portugal and South Africa, and new countries are being onboarded every day. Vodafone Analytics already has more than 100 customers leveraging it for a variety of use cases—Italian fashion retailer OVS, uses it for its smart retail operation, while global real estate company, JLL, uses it to understand the footfall passing through its properties.
Working together, Vodafone and Google Cloud continue to help a range of organizations, governments, and NGOs navigate through the ongoing pandemic, optimize their operations, and help the greater good, without infringing individuals’ fundamental rights to privacy.
To learn more about Google Cloud and Vodafone, watch our full interview here.
Simplifying Payments for SMBs: Helcim’s Transformational Approach

1465
Of your peers have already read this article.
6:00 Minutes
The most insightful time you'll spend today!
Small and medium-sized businesses and enterprises are the backbone of the US economy generating more than 44% of GDP1. Yet these organizations are still underserved when it comes to online financial tools—and dealing with payments is no exception. Complaints include hidden fees, limited capabilities, long-term lease agreements, and poor customer service.
These are the issues that we wanted to solve when we launched Helcim in 2020 in Calgary (Alberta, Canada). We provide a payment service that offers low rates through our interchange plus pricing model, no monthly fee for the core payments offering, and numerous payment options, as well as simple, affordable hardware such as card readers.
Our digital-first approach makes it easy for owners of small and medium-sized businesses to get started. Online sign-up means no paperwork and near instant access to Helcim’s software and all-in-one platform experience. Merchants can choose from a range of payment solutions from the Helcim app including in-person payments, SMS payment requests, online invoices with pay now buttons, and more.
To achieve our goals, we built most of the business systems and processes in-house including our technology stack, financial partnerships, marketing, and everything in between. This is something that few startups would dare to do, but it enabled us to build a payments platform offering the rich capabilities and performance SMBs really need.
Taking control with the cloud
Before migrating our infrastructure to Google Cloud, it was hosted at two colocation data centers in Calgary. This model served us well, but as we grew, most of our hardware needed to be replaced to maintain service security and performance.
A successful round of Series A funding also impacted our trajectory. Giving us the fuel we needed to scale and innovate faster. When we considered the choice between making a large capital investment in our existing environment, or to transition to the cloud, the decision was clear: The cloud was the way to go.
We looked at other big names in cloud hosting and tested another platform. But Google Cloud is by far the best environment for us. It’s much easier for a lean technology team to manage, as we embark on our first cloud strategy. It also offers all the tools and advanced machine learning capabilities we need.
Google Cloud also comes with the backing of Alphabet, a business that in the past five years has spent more on research and development than any other organization in the S&P 5002. The ability to engage the Google Workspace account team for guidance to improve our everyday processes was another bonus.
A variety of investment and training programs from Google Cloud also influenced our decision. We participated in Google for Startups Accelerator Canada which gave us access to Google Cloud experts across all our technology domains. This helped accelerate our infrastructure migration while ensuring we optimized every service from day one. We were also eligible for $100,000 USD of Google Cloud credits, covering our Google Cloud costs which helped us get everything up and running cost-effectively. The partnership with the wider Google team has been extremely impactful as we stand everything up for our business.
But ultimately, it’s the sheer depth and breadth of the Google Cloud environment that makes the difference. Here are the Google Cloud tools we currently have at Helcim.
We chose BigQuery because it is easy to aggregate new data and apply the right access controls. It also delivers outstanding performance running our analytics workloads.
Vertex AI makes the deployment of new models exponentially faster, and with Google Cloud, we can do most of the work through containers instead of proprietary tooling.
GKE has enabled us to migrate to a fully managed cloud service and avoid a lift-and-shift exercise that would have prevented us from getting the full benefits of a containerized infrastructure. Running a new GKE environment also enabled us to significantly reduce platform latency by 20%-50%. We can now deploy projects in hours instead of days.
We updated our centralized file system to use Cloud Storage, which is faster and more scalable.
All of our software today is built on top of MySQL, so CloudSQL was the natural choice for cloud database management.
Cloud Run is more flexible than other serverless tools and was an easy way to reduce the burden of managing some of our services.
Boosting performance across the business
By migrating to Google Cloud, we transformed our application performance. We were able to decouple the infrastructure between systems and use modern server hardware for our compute and database instances. With very little change to our code, we saw a 50%+ increase in the speed of our entire platform.
Giving developers more control of the technology running their systems via containers means that they can enhance systems through more frequent language updates and by deploying new technologies to optimize workloads.
We can more closely monitor our systems to diagnose issues and fix their root cause faster. Being able to quickly add resources gives us further options if we experience platform latency or increased traffic.
Maintaining momentum with machine learning
Leveraging Vertex AI has significantly reduced the time it takes the team to build and deploy new machine learning models. Greater agility in our data stack has also freed up time for exploratory work in the data team. For instance, by creating low fidelity proxy data for human behavior in the application process, we created a new model that will reduce the number of manually reviewed batches by more than 10%.
We’ve also been able to improve our deployment process and the time to rollback. As a result, breaking changes in production have been reduced from more than five minutes to less than 30 seconds.
Thanks to BigQuery, we can make better use of data to support key business decisions. Previously it was hard to aggregate data from different sources and while maintaining our strict requirements for customer data confidentiality. We also needed specialist SQL knowledge to consume it. By investing in a more modern data stack, the availability of trusted data across the organization has increased exponentially.
We’ve also overcome the constraints imposed by static hardware environments especially when maintaining a high-availability configuration between two locations. With Google Cloud, we’re no longer constrained by such a rigid arrangement and the deployment velocity of new infrastructure tooling has been reduced from months to days.
Security is another area where Google Cloud excels. From hackers and fraudsters to bots and web attacks, it protects our users, applications, and data, while facilitating compliance with local and regional authorities. We can also integrate more easily with our security partners ensuring that we can empower our team to stay ahead of cyber criminals and other external threats.
Building the payments platform for the future, today
When we look to the future, Google Cloud opens the door to dozens of opportunities to widen our appeal to SMBs while remaining competitive. Its advanced infrastructure for cloud computing, data analytics and ML supports our roadmap to profitability and will help us attract future rounds of funding.
Above all it provides a foundation for growth. We grew 400% in 2021 and raised more capital in the spring of 2022 to grow even faster. In 2022 we were also listed as one of the top payments processors by industry publications such as Nerdwallet and Merchant Maverick. With Google Cloud, we can build on this success, continue to innovate, and help our SMB customers take their payments and e-commerce strategies to the next level.
If you want to learn more about how Google Cloud can help your startup, visit our page here to get more information about our program, and sign up for our communications to get a look at our community activities, digital events, special offers, and more.
To learn more about Google for Startups Accelerators and to apply to a program in your region, visit the website here.
1. Small Businesses Generate 44 Percent Of U.S. Economic Activity
2. Alphabet: Big Value In Big Tech
10178
Of your peers have already watched this video.
1:00 Minutes
The most insightful time you'll spend today!
Predict User Churn on Gaming Apps with Google Analytics Data using BigQuery ML
User retention can be a major challenge for mobile game developers. According to the Mobile Gaming Industry Analysis in 2019, most mobile games only see a 25% retention rate for users after the first day. To retain a larger percentage of users after their first use of an app, developers can take steps to motivate and incentivize certain users to return. But to do so, developers need to identify the propensity of any specific user returning after the first 24 hours.
In this blog post, we will discuss how you can use BigQuery ML to run propensity models on Google Analytics 4 data from your gaming app to determine the likelihood of specific users returning to your app.
You can also use the same end-to-end solution approach in other types of apps using Google Analytics for Firebase as well as apps and websites using Google Analytics 4. To try out the steps in this blogpost or to implement the solution for your own data, you can use this Jupyter Notebook.
Using this blog post and the accompanying Jupyter Notebook, you’ll learn how to:
- Explore the BigQuery export dataset for Google Analytics 4
- Prepare the training data using demographic and behavioural attributes
- Train propensity models using BigQuery ML
- Evaluate BigQuery ML models
- Make predictions using the BigQuery ML models
- Implement model insights in practical implementations
Google Analytics 4 (GA4) properties unify app and website measurement on a single platform and are now default in Google Analytics. Any business that wants to measure their website, app, or both, can use GA4 for a more complete view of how customers engage with their business. With the launch of Google Analytics 4, BigQuery export of Google Analytics data is now available to all users. If you are already using a Google Analytics 4 property, you can follow this guide to set up exporting your GA data to BigQuery.
Once you have set up the BigQuery export, you can explore the data in BigQuery. Google Analytics 4 uses an event-based measurement model. Each row in the data is an event with additional parameters and properties. The Schema for BigQuery Export can help you to understand the structure of the data.
In this blogpost, we use the public sample export data from an actual mobile game app called “Flood It!” (Android, iOS) to build a churn prediction model. But you can use data from your own app or website.
Here’s what the data looks like. Each row in the dataset is a unique event, which can contain nested fields for event parameters.
SELECT *FROM `firebase-public-project.analytics_153293282.events_*`TABLESAMPLE SYSTEM (1 PERCENT)

This dataset contains 5.7M events from over 15k users.
SELECTCOUNT(DISTINCT user_pseudo_id) as count_distinct_users,COUNT(event_timestamp) as count_eventsFROM`firebase-public-project.analytics_153293282.events_*

Our goal is to use BigQuery ML on the sample app dataset to predict propensity to user churn or not churn based on users’ demographics and activities within the first 24 hours of app installation.

In the following sections, we’ll cover how to:
- Pre-process the raw event data from GA4
- Identify users & the label feature
- Process demographic features
- Process behavioral features
- Train classification model using BigQuery ML
- Evaluate the model using BigQueryML
- Make predictions using BigQuery ML
- Utilize predictions for activation
Pre-process the raw event data
You cannot simply use raw event data to train a machine learning model as it would not be in the right shape and format to use as training data. So in this section, we’ll go through how to pre-process the raw data into an appropriate format to use as training data for classification models.
This is what the training data should look like for our use case at the end of this section:

Notice that in this training data, each row represents a unique user with a distinct user ID (user_pseudo_id).
Identify users & the label feature
We first filtered the dataset to remove users who were unlikely to return the app anyway. We defined these ‘bounced’ users as ones who spent less than 10 mins with the app. Then we labeled all remaining users:
- churned: No event data for the user after 24 hours of first engaging with the app.
- returned: The user has at least one event record after 24 hours of first engaging with the app.
For your use case, you can have a different definition of bounce and churning. Also you can even try to predict something else other than churning, e.g.:
- whether a user is likely to spend money on in-game currency
- likelihood of completing n-number of game levels
- likelihood of spending n amount of time in-game etc.
In such cases, label each record accordingly so that whatever you are trying to predict can be identified from the label column.
From our dataset, we found that ~41% users (5,557) bounced. However, from the remaining users (8,031), ~23% (1,883) churned after 24 hours:
SELECTbounced,churned,COUNT(churned) as count_usersFROMbqmlga4.returningusersGROUP BY 1,2ORDER BY bounced

To create these bounced and churned columns, we used the following snippet of SQL code.
...#churned = 1 if last_touch within 24 hr of app installation, else 0IF (user_last_engagement < TIMESTAMP_ADD(user_first_engagement,INTERVAL 24 HOUR),1,0 ) AS churned,#bounced = 1 if last_touch within 10 min, else 0IF (user_last_engagement <= TIMESTAMP_ADD(user_first_engagement,INTERVAL 10 MINUTE),1,0 ) AS bounced,...
You can view the Jupyter Notebook for the full query used for materializing the bounced and churned labels.
Process demographic features
Next, we added features both for demographic data and for behavioral data spanning across multiple columns. Having a combination of both demographic data and behavioral data helps to create a more predictive model.
We used the following fields for each user as demographic features:
geo.countrydevice.operating_systemdevice.language
A user might have multiple unique values in these fields — for example if a user uses the app from two different devices. To simplify, we used the values from the very first user engagement event.
CREATE OR REPLACE VIEW bqmlga4.user_demographics AS (WITH first_values AS (SELECTuser_pseudo_id,geo.country as country,device.operating_system as operating_system,device.language as language,ROW_NUMBER() OVER (PARTITION BY user_pseudo_id ORDER BY event_timestamp DESC) AS row_numFROM `firebase-public-project.analytics_153293282.events_*`WHERE event_name="user_engagement")SELECT * EXCEPT (row_num)FROM first_valuesWHERE row_num = 1 #first engagement);
Process behavioral features
There is additional demographic information present in the GA4 export dataset, e.g. app_info, device, event_params, geo etc. You may also send demographic information to Google Analytics through each hit via user_properties. Furthermore, if you have first-party data on your own system, you can join that with the GA4 export data based on user_ids.
To extract user behavior from the data, we looked into the user’s activities within the first 24 hours of first user engagement. In addition to the events automatically collected by Google Analytics, there are also the recommended events for games that can be explored to analyze user behavior. For our use case, to predict user churn, we counted the number of times the follow events were collected for a user within 24 hours of first user engagement:
user_engagementlevel_start_quickplaylevel_end_quickplaylevel_complete_quickplaylevel_reset_quickplaypost_scorespend_virtual_currencyad_rewardchallenge_a_friendcompleted_5_levelsuse_extra_steps
The following query shows how these features were calculated:
WITHevents_first24hr AS (SELECTe.*FROM`firebase-public-project.analytics_153293282.events_*` eJOINbqmlga4.returningusers rONe.user_pseudo_id = r.user_pseudo_idWHERETIMESTAMP_MICROS(e.event_timestamp) <= r.ts_24hr_after_first_engagement)SELECTuser_pseudo_id,SUM(IF(event_name = 'user_engagement', 1, 0)) AS cnt_user_engagement,# ... repeated for all behavior data ...SUM(IF(event_name = 'use_extra_steps', 1, 0)) AS cnt_use_extra_steps,FROMevents_first24hrGROUP BY1
View the notebook for the query used to aggregate and extract the behavioral data. You can use different sets of events for your use case. To view the complete list of events, use the following query:
SELECTevent_name,COUNT(event_name) as event_countFROM`firebase-public-project.analytics_153293282.events_*`GROUP BY 1ORDER BYevent_count DESC
After this we combined the features to ensure our training dataset reflects the intended structure. We had the following columns in our table:
- User ID:
user_pseudo_id
- Label:
churned
- Demographic features
countrydevice_osdevice_language
- Behavioral features
cnt_user_engagementcnt_level_start_quickplaycnt_level_end_quickplaycnt_level_complete_quickplaycnt_level_reset_quickplaycnt_post_scorecnt_spend_virtual_currencycnt_ad_rewardcnt_challenge_a_friendcnt_completed_5_levelscnt_use_extra_stepsuser_first_engagement
At this point, the dataset was ready to train the classification machine learning model in BigQuery ML. Once trained, the model will output a propensity score between churn (churned=1) or return (churned=0) indicating the probability of a user churning based on the training data.
Train classification model
When using the CREATE MODEL statement, BigQuery ML automatically splits the data between training and test. Thus the model can be evaluated immediately after training (see the documentation for more information).
For the ML model, we can choose among the following classification algorithms where each type has its own pros and cons:

Often logistic regression is used as a starting point because it is the fastest to train. The query below shows how we trained the logistic regression classification models in BigQuery ML.
CREATE OR REPLACE MODEL bqmlga4.churn_logregTRANSFORM(EXTRACT(MONTH from user_first_engagement) as month,EXTRACT(DAYOFYEAR from user_first_engagement) as julianday,EXTRACT(DAYOFWEEK from user_first_engagement) as dayofweek,EXTRACT(HOUR from user_first_engagement) as hour,* EXCEPT(user_first_engagement, user_pseudo_id))OPTIONS(MODEL_TYPE="LOGISTIC_REG",INPUT_LABEL_COLS=["churned"]) ASSELECT*FROMbqmlga4.train
We extracted month, julianday, and dayofweek from datetimes/timestamps as one simple example of additional feature preprocessing before training. Using TRANSFORM() in your CREATE MODEL query allows the model to remember the extracted values. Thus, when making predictions using the model later on, these values won’t have to be extracted again. View the notebook for the example queries to train other types of models (XGBoost, deep neural network, AutoML Tables).
Evaluate model
Once the model finished training, we ran ML.EVALUATE to generate precision, recall, accuracy and f1_score for the model:
SELECT*FROMML.EVALUATE(MODEL bqmlga4.churn_logreg)

The optional THRESHOLD parameter can be used to modify the default classification threshold of 0.5. For more information on these metrics, you can read through the definitions on precision and recall, accuracy, f1-score, log_loss and roc_auc. Comparing the resulting evaluation metrics can help to decide among multiple models.Furthermore, we used a confusion matrix to inspect how well the model predicted the labels, compared to the actual labels. The confusion matrix is created using the default threshold of 0.5, which you may want to adjust to optimize for recall, precision, or a balance (more information here).
SELECTexpected_label,_0 AS predicted_0,_1 AS predicted_1FROMML.CONFUSION_MATRIX(MODEL bqmlga4.churn_logreg)

This table can be interpreted in the following way:

Make predictions using BigQuery ML
Once the ideal model was available, we ran ML.PREDICT to make predictions. For propensity modeling, the most important output is the probability of a behavior occurring. The following query returns the probability that the user will return after 24 hrs. The higher the probability and closer it is to 1, the more likely the user is predicted to return, and the closer it is to 0, the more likely the user is predicted to churn.
SELECTuser_pseudo_id,returned,predicted_returned,predicted_returned_probs[OFFSET(0)].prob as probability_returnedFROMML.PREDICT(MODEL bqmlga4.churn_logreg,(SELECT * FROM bqmlga4.train)) #can be replaced with a proper test dataset
Utilize predictions for activation
Once the model predictions are available for your users, you can activate this insight in different ways. In our analysis, we used user_pseudo_id as the user identifier. However, ideally, your app should send back the user_id from your app to Google Analytics. In addition to using first-party data for model predictions, this will also let you join back the predictions from the model into your own data.
- You can import the model predictions back into Google Analytics as a user attribute. This can be done using the Data Import feature for Google Analytics 4. Based on the prediction values you can Create and edit audiences and also do Audience targeting. For example, an audience can be users with prediction probability between 0.4 and 0.7, to represent users who are predicted to be “on the fence” between churning and returning.
- For Firebase Apps, you can use the Import segments feature. You can tailor user experience by targeting your identified users through Firebase services such as Remote Config, Cloud Messaging, and In-App Messaging. This will involve importing the segment data from BigQuery into Firebase. After that you can send notifications to the users, configure the app for them, or follow the user journeys across devices.
- Run targeted marketing campaigns via CRMs like Salesforce, e.g. send out reminder emails.
You can find all of the code used in this blogpost in the Github repository:
What’s next?
Continuous model evaluation and re-training
As you collect more data from your users, you may want to regularly evaluate your model on fresh data and re-train the model if you notice that the model quality is decaying.
Continuous evaluation—the process of ensuring a production machine learning model is still performing well on new data—is an essential part in any ML workflow. Performing continuous evaluation can help you catch model drift, a phenomenon that occurs when the data used to train your model no longer reflects the current environment.
To learn more about how to do continuous model evaluation and re-train models, you can read the blogpost: Continuous model evaluation with BigQuery ML, Stored Procedures, and Cloud Scheduler
More resources
If you’d like to learn more about any of the topics covered in this post, check out these resources:
- BigQuery export of Google Analytics data
- BigQuery ML quickstart
- Events automatically collected by Google Analytics 4
- Qwiklabs: Create ML models with BigQuery ML
Or learn more about how you can use BigQuery ML to easily build other machine learning solutions:
- How to build demand forecasting models with BigQuery ML
- How to build a recommendation system on e-commerce data using BigQuery ML
Let us know what you thought of this post, and if you have topics you’d like to see covered in the future! You can find us on Twitter at @polonglin and @_mkazi_.Thanks to reviewers: Abhishek Kashyap, Breen Baker, David Sabater Dinter.

3801
Of your peers have already downloaded this article
10:30 Minutes
The most insightful time you'll spend today!
Digital transformation is about how digital technologies can connect people and processes to solve challenges that traditional methodologies could not.
While this transformation is imperative for businesses of all sizes, the Frost & Sullivan Enterprise Cloud Maturity Index (ECMI) assessment indicates that around 85% of CXOs want to digitally transform their enterprises, but only 39% of them have a clear plan to achieve this transformation.
Most business leaders are exploring new business ideas around cloud to extract better outcomes, increase productivity, create opportunities and redefine customer engagement processes as part of their internal strategies.
It has been proved time and again that enterprises need to bank on emerging technologies like cloud that provide ‘do more with less’ approach. Cloud has the potential to transform IT departments through infrastructure consolidation and optimization.
To understand the interest and level of cloud adoption in enterprises, Google Cloud partnered with Frost & Sullivan to recognize the unique business drivers and key challenges in Cloud adoption that come the enterprise way during their business transformation journey.
Read the report to find out the challenges, solutions and benefits of digital transformation and the cloud.
More Relevant Stories for Your Company

Google Introduces BigQuery Connector for SAP to Power Customers’ Data Analytics Strategy
Google Cloud has a genuine passion for solving technology problems that make a difference for our customers. With the release of our BigQuery Connector for SAP, we're taking a another big step towards solving a major challenge for SAP customers with a quick, easy, and inexpensive way to integrate SAP data

Italian Utility Company Deploys its SAP Workloads on Google Cloud to Meet Sustainability Goals
With more than 2.5 million customers, Italian utility company A2A is committed to delivering electricity, gas, clean water, and waste collection every day. More recently, the company made another significant commitment: To incorporate the principles of the “circular economy” into its way of doing business — part of the UN

NVIDIA CloudXR Streaming from Cloud to Transform Gaming and Enterprise AR/VR Experience
The Opportunity for Streamed AR/VR Content What if you could get a high quality AR/VR experience without a dedicated physical computer—or even without a physical tether? In the past, interacting with VR required a dedicated, high-end workstation and, depending on the headset, wall-mounted sensors and a dedicated physical space. Complex

MIT Cloud Security Confidence Report: An Evolution Worth Noting
The age of unthinking fears about cloud security is over. Not only is cloud adoption rising steadily across geographies, industries and job functions, but confidence in cloud security is rising as well — to the point where increased security is a major reason enterprises opt for cloud solutions. Gone are
