





Data to Business Outcomes with Google’s Data Analytics Design Pattern

6738
Of your peers have already read this article.
1:30 Minutes
The most insightful time you'll spend today!
Companies today are inundated with vast amounts of data from various sources. This overwhelming amount of data is meant to benefit the company, but often leaves data teams feeling overwhelmed, which can create data bottlenecks and result in a slow time to value. In fact, only twenty seven percent of companies agree that data and analytics projects produce insights and recommendations that are highly actionable (Accenture). This means that nearly 3 in 4 companies are not unlocking value in their data, which poses a huge challenge for organizations trying to move the needle and drive real business results. We at Google Cloud, however, saw opportunity in this challenge, which is why we created Data Analytics Design Patterns: cross-product technical solutions designed to accelerate a customer’s path to value realization with their data. These industry solutions bring together product capabilities alongside design methodology, open source deployable code, data models, and reference architectures to accelerate your business outcomes.

With Data Analytics Design Patterns, you get access to more than 30 ready-to-deploy data analytics solutions. Design patterns leverage the best of Google and our rich partner ecosystem, including Technology Partners & System Integrators. In this blog, we will cover 3 examples on how a design pattern can be applied to unlock the value of data:
- Improve mobile app experience with Unified App Analytics
- Maximize digital shop’s revenue with Price Optimization
- Protect internal systems from security and malware threat with Anomaly Detection
Unified App Analytics
If mobile apps are part of your go-to-market strategy, you have several data sources that can provide invaluable customer insights. In addition to tools such as CRM (e.g. Salesforce) and customer care (e.g. Zendesk), you likely use Google Analytics to log app events and Firebase Crashlytics to gather data about app errors. But can you easily combine back-end server data with app front-end data to unlock customer insights?
The Unified App Analytics design pattern makes it easy to plug all the disparate data sources into a single warehouse (BigQuery) and start analyzing it with a Business Intelligence tool (Looker). Once you have a complete and real time view of your customer experience with your app, you can take action. For example, if you notice an increase in app errors, you can quickly combine your Crashlytics data with your CRM data to narrow down the crashes with the highest revenue impact and prioritize their resolution. Further, you can automate your issue resolution workflow by creating a rule for any future crash that impacts a subset of VIP customers.

With the Unified App Analytics design pattern, you’ll gain access to valuable insights about your user experience with your app so you can inform your future app strategy. For example, NPR, an American media company, increased user engagement by showing content that better mapped to listener interests and behaviors.
Price Optimization
In a competitive and hectic global marketplace, strategic pricing matters more than ever, but often projects are consumed by the tedium of standardizing, cleaning, and preparing data—from transactions, inventory, demand, among other sources.
Price Optimization solution allows retailers to build a data driven pricing model. The solution consists of three main components:
- Dataprep by Trifacta: integrates different data sources into a single Common Data Model (CDM). Dataprep is an intelligent data service for visually exploring, cleaning, and preparing structured and unstructured data for analysis, reporting, and machine learning.
- BigQuery: allows you to create and store pricing models in a consistent and scalable way as a serverless Cloud Data Warehouse service
- Looker dashboards: surface insights and enable business teams to take action with enterprise ready BI platform
With the Price Optimization design pattern from Google Cloud and our partner Trifacta, you’ll be able to rapidly unify multiple data sources and create a real-time and ML-powered analysis, leveraging predictive models to estimate future sales. For example, PDPAOLA, an online jewelry company, doubled sales with dynamic pricing adjustments enabled by a single data view.

Anomaly Detection
Organizations need to anticipate and act on risks and opportunities to stay competitive in a digitally transforming society. Anomaly detection helps organizations identify and respond to data points and data trends in high velocity, high volume data sets that deviate from historical standards and expected behaviors, allowing them to take action on changing user needs, mitigate malicious actors and behaviors, and prevent unnecessary costs and monetary losses.
The Anomaly Detection design pattern uses Google Pub/Sub, BigQuery, Dataflow, and Looker to:
- Stream events in real time
- Process the events, extract useful data points, train the detection algorithm of choice
- Apply the detection algorithm in near-real time to the events to detect anomalies
- Update dashboards and/or send alerts
The challenge of finding the important insights and anomalies in vast amounts of data applies to organizations across all industries and lines of business, but is especially important to protecting the security of an organization. For example, TELUS, a national communications company, modernized their security analytics platform leveraging this pattern, allowing them to detect anomalies in near real time to detect and mitigate suspicious activity.
Get started
Turn your data into business outcomes with Google Cloud and our broad partner ecosystem by deploying Data Analytics Design Patterns at your organization. There are more than 30 Data Analytics Design Patterns ready for you to use. We have more than 200+ more ideas in the pipeline, so be sure to check in regularly as new patterns will be added soon.
To dive deeper and find out more about how Data Analytics Design Patterns can help your organization accelerate use cases and create faster time to value, check out this video.
Four Key Takeaways from Google and Quantum Metric’s Back-to-School Retail Benchmark Study

4783
Of your peers have already read this article.
2:00 Minutes
The most insightful time you'll spend today!
Is it September yet? Hardly! School is barely out for the summer. But according to Google and Quantum Metric research, the back-to-school and off-to-college shopping season – which in the U.S. is second only to the holidays in terms of purchasing volume1 – has already begun. For retailers, that means planning for this peak season has kicked off as well.
We’d like to share four key trends that emerged from Google research and Quantum Metric’s Back-to-School Retail Benchmarks study of U.S. retail data, explore the reasons behind them, and outline the key takeaways.
- Out-of-stock and inflation concerns are changing the way consumers shop. Back-to-school shoppers are starting earlier every year, with 41% beginning even before school is out – even more so when buying for college1. Why? The behavior is driven in large part by consumers’ concerns that they won’t be able to get what they need if they wait too long. 29% of shoppers start looking a full month before they need something1.
Back-to-school purchasing volume is quite high, with the majority spending up to $500 and 21% spending more than $1,0001. In fact, looking at year-over-year data, we see that average cart values have not only doubled since November 2021, but increased since the holidays1. And keep in mind that back-to-school spending is a key indicator leading into the holiday season.
That said, as people are reacting to inflation, they are comparing prices, hunting for bargains, and generally taking more time to plan. This is borne out by the fact that 76% of online shoppers are adding items to their carts and waiting to see if they go on sale before making the purchase1. And, to help stay on budget and reduce shipping costs, 74% plan to make multiple purchases in one checkout1. That carries over to in-store shopping, when consumers are buying more in one visit to reduce trips and save on gas.
2. The omnichannel theme continues. Consumers continue to use multiple channels in their shopping experience. As the pandemic has abated, some 82% expect that their back-to-school buying will be in-store, and 60% plan to purchase online. But in any case, 45% of consumers report that they will use both channels; more than 50% research online first before ever setting foot in a store2. Some use as many as five channels, including video and social media, and these 54% of consumers spend 1.5 times more compared to those who use only two channels4.
And mobile is a big part of the journey. Shoppers are using their phones to make purchases, especially for deadline-driven, last-minute needs, and often check prices on other retailers’ websites while shopping in-store. Anecdotally, mobile is a big part of how we ourselves shop with our children, who like to swipe on the phone through different options for colors and styles. We use our desktops when shopping on our own, especially for items that require research and represent a larger investment – and our study shows that’s quite common.
3. Consumers are making frequent use of wish lists. One trend we have observed is a higher abandonment rate, especially for apparel and general home and school supplies, compared to bigger-ticket items that require more research. But that can be attributed in part to the increasing use of wish lists. Online shoppers are picking a few things that look appealing or items on sale, saving them in wish lists, and then choosing just a few to purchase. Our research shows that 39% of consumers build one or two wish lists per month, while 28% said they build one or two each week, often using their lists to help with budgeting1.
4. Frustration rates have dropped significantly. Abandonment rates aside, shopper annoyance rates are down by 41%, year over year1. This is despite out-of-stock concerns and higher prices. But one key finding showed that both cart abandonment and “rage clicks” are more frequent on desktops, possibly because people investing time on search also have more time to complain to customer service.
And frustration does still exist. Some $300 billion is lost each year in the U.S. from bad search experiences5. Data collected internationally shows that 80% of consumers view a brand differently after experiencing search difficulties, and 97% favor websites where they can quickly find what they are looking for5.
Lessons to Learn
What are the key takeaways for retailers? In general, consider the sources of customer pain points and find ways to erase friction. Improve search and personalization. And focus on improving the customer experience and building loyalty. Specifically:
80% of shoppers want personalization6. Think about how you can drive personalized promotions or experiences that will drive higher engagement with your brand.
46% of consumers want more time to research1. Drive toward providing more robust research and product information points, like comparison charts, images, and specific product details.
43% of consumers want a discount1, but given current economic trends, retailers may not be offering discounts. In order to appease budget-conscious shoppers, retailers can consider other retention strategies such as driving loyalty using points, rewards, or faster-shipping perks.
Be sure to keep returns as simple as possible so consumers feel confident when making a purchase, and reduce possible friction points if a consumer decides to make a return. 43% of shoppers return at least a quarter of the products they buy and do not want to pay for shipping or jump through hoops1.
How We Can Help
Google-sponsored research shows that price, deals, and promotions are important to 68% of back-to-school shoppers.7 In addition, shoppers want certainty that they will get what they want. Google Cloud can make it easier for retailers to enable customers to find the right products with discovery solutions. These solutions provide Google-quality search and recommendations on a retailer’s own digital properties, helping to increase conversions and reduce search abandonment. In addition, Quantum Metric solutions, available on the Google Cloud Marketplace, are built with BigQuery, which helps retailers consolidate and unlock the power of their raw data to identify areas of friction and deliver improved digital shopping experiences.
We invite you to watch the Total Retail webinar “4 ways retailers can get ready for back-to-school, off-to college” on demand and to view the full Back-to-School Retail Benchmarks report from Quantum Metric.
Sources:
1. Back-to-School Retail Benchmarks report from Quantum Metric
2. Google/Ipsos,Moments 2021, Jun 2021, Online survey, US, n=335 Back to School shoppers
3. Google/Ipsos, Moments 2021, Jun 2021, Online survey, US, n=2,006 American general population 18+
4. Google/Ipsos, Holiday Shopping Study, Oct 2021 – Jan 2022, Online survey, US, n=7,253, Americans 18+ who conducted holiday shopping activities in past two days
5. Google Cloud Blog, Nov 2021, “Research: Search abandonment has a lasting impact on brand loyalty”
6. McKinsey & Company, “Personalizing the customer experience: Driving differentiation in retail”
7. Think with Google, July 2021, “What to expect from shoppers this back-to-school season”
2993
Of your peers have already watched this video.
34:30 Minutes
The most insightful time you'll spend today!
Reinventing geospatial analytics as only Google can do: Intelligent platform
Geospatial analytics is undergoing a fundamental change with the application of cloud computing products. Every day, data analysts need to understand the geospatial impact on their data and GIS professionals are finding themselves constrained by legacy technology that can’t keep pace with increasing data volume.
Google Cloud’s geospatial analytics platform brings the full suite of Google’s Geo offerings to both sets of users to unblock workloads and free them from legacy capacity constraints.
Listen to Joe Bettridge, Consulting Lead, TELUS Insights, TELUS and Chad Jennings, Product Manager and GIS Lead, Google Cloud, and learn about Google Cloud’s uniquely powerful, full–platform solution for geospatial analytics and how organizations are using it to reduce query times from hours, days, or months to minutes. These workloads can span both structured and imagery data.
In this session, they will cover:
- An overview of BigQuery GIS
- Some use cases
- Examples of algorithms TELUS is using
IT Team Figures Out Easiest Way to Build Data Pipelines and Create ML Models

14090
Of your peers have already read this article.
5:15 Minutes
The most insightful time you'll spend today!
Building a strong brand in today’s hyper-competitive business environment takes vision. It also requires a flexible, easily managed approach to digital asset management (DAM), so marketing professionals and other stakeholders can easily share, store, track, and manipulate assets to build the brand.
Many of today’s leading companies, including JetBlue, Slack, TripAdvisor, Lyft, and HealthONE, rely on Brandfolder to deliver consistent, organized, and efficient brand experiences. Brandfolder provides an easy-to-use platform that can scale across an entire company with little end-user training, empowering customers to distribute digital assets wherever they are needed. Customers also gain much greater insight into how those assets are used, and how to use them more effectively in marketing campaigns and brand messaging.
“Google Cloud made it easy to build an ML platform to quickly iterate through different brand intelligence use cases and release data-driven product features into the Brandfolder platform.”
—Ajay Rajasekharan, Head of Data Science, Brandfolder
Brandfolder is constantly advancing its development efforts to introduce new data-driven features without complicating the user experience. Big data, artificial intelligence (AI), and machine learning (ML) are key to meeting customers’ unique business needs, and essential for Brandfolder to compete in the fast-moving DAM industry. To enhance these capabilities, Brandfolder sought a public cloud provider that could help it scale its data pipeline cost effectively while providing access to advanced AI technologies.
After graduating from the Techstars startup accelerator program in 2013, Brandfolder tried two other cloud providers before standardizing on Google Cloud Platform (GCP).
“We saw a difference with Google Cloud from the very beginning because the interactions felt like a strategic relationship,” says Jim Hanifen, Head of Product at Brandfolder. “Google gave us startup credits and a lot of face-to-face support, which we hadn’t experienced with other cloud providers. We decided to move our entire infrastructure to Google Cloud Platform.”
Building an ML platform for brand intelligence
After performing an initial lift-and-shift migration of virtual machines (VMs) onto Compute Engine, Brandfolder built an ML platform using GCP managed services to seamlessly deliver its data products. The platform leverages Cloud SQL, Cloud Storage as the data lake, Cloud Dataproc for cloud-native Apache Spark computing clusters, Cloud Composer as the batch job scheduler, Cloud Pub/Sub as the backbone data pipeline, Container Registry to store Docker images, and Google Kubernetes Engine (GKE) as the application orchestrator. Cloud Dataflow brings data into the data lake and into BigQuery for analysis.
“Google Cloud made it easy to build an ML platform to quickly iterate through different brand intelligence use cases and release data-driven product features into the Brandfolder platform,” says Ajay Rajasekharan, Head of Data Science at Brandfolder, who describes the architecture in a detailed blog. “We simply ingest raw application and event data on one end and output an ML service on the other.”
“Moving to Google Cloud Platform allows us to complete more sophisticated data analysis and ML models much faster, and at a much lower cost. We can create brand-specific ML models 12x faster and get them into production quickly to address our customers’ unique business needs.”
—Brett Nekolny, Head of Engineering, Brandfolder
For many general use cases, Brandfolder does not need to build custom ML models, and instead relies on pre-trained API models from GCP. For example, it uses Vision API and Video Intelligence API to auto-tag creative assets on import to enable fast, intuitive searches across images and videos. When more product- and brand-specific modeling is required to address unique customer use cases, Brandfolder builds and trains custom ML models using its GCP pipeline or Cloud AutoML, a suite of products built on Google transfer learning and neural architecture search technology. For example, if a Brandfolder customer makes different types of grills, Brandfolder can use AutoML Vision to train a model to recognize the different grills.
“Moving to Google Cloud Platform allows us to complete more sophisticated data analysis and ML models much faster, and at a much lower cost,” explains Brett Nekolny, Head of Engineering at Brandfolder. “We can create brand-specific ML models 12x faster and get them into production quickly to address our customers’ unique business needs.”
Industry-leading security and performance
Google Cloud’s security model helps Brandfolder give existing and prospective customers peace of mind that their data will be protected. Cloud Identity & Access Management (Cloud IAM) provides enterprise-grade access control, while Cloud Identity-Aware Proxy (Cloud IAP) enables remote users to work more securely without the hassles of a VPN client. GCP also isolates cloud resources into projects, making it easy to assign permissions and keep data and VMs organized and segregated.
“With Google Cloud, everything begins and ends with security, which makes things very easy for us,” says Jim. “If we’re under a security review, we can submit a Google security white paper. If a potential customer has security concerns, we tell them we are hosted on GCP, and those concerns go away.”
To give customers even better application performance for accessing their brand assets, Brandfolder uses Cloud Memorystore, an in-memory data store service for Redis, to cache data and provide sub-millisecond data access for production applications.
“It was much easier for us to use Cloud Memorystore versus running Redis on our compute instances,” says Brett. “The high availability, replication across zones, and automatic failover with no data loss are big for us.”
Global private network interconnects between Google Cloud and the Fastly content delivery network (CDN) dramatically reduce latency, allowing Brandfolder’s customers to deliver and update even very large creative assets quickly around the world.
“What’s beautiful about the relationship between Google and Fastly is that if one of our customers uploads a new version of an asset, we can propagate that out to Fastly, and the new version will automatically show up in all the places where it’s referenced,” says Brett.
“The ability to quickly solve problems with AI has a substantial impact on our revenue, and that’s more apparent every quarter. Few of our competitors are doing product- or brand-specific modeling because it takes a lot of time and resources. We overcame those hurdles with Google Cloud.”
—Jim Hanifen, Head of Product, Brandfolder
Improving employee and customer productivity
Brandfolder also uses Google solutions for real-time collaboration and productivity, using G Suite to connect employees with intuitive, cloud-based apps. Teams use Gmail, Calendar, Docs, Drive, Sheets, Slides, and Hangouts Meet every day to move the business forward. Many of Brandfolder’s customers are also G Suite users, and Brandfolder offers a plug-in that allows them to view their creative assets inside of Docs and pull images in as needed. Customers can also log into Brandfolder with their G Suite credentials, making the solution even easier to use.
“We’ve been using G Suite since the beginning, and it’s helped us collaborate efficiently to build a successful, growing company,” says Jim. “Our teams expect to have that kind of close collaboration, and everyone here enjoys the G Suite experience.”
Driving 99 percent annual business growth
With automated tagging and other innovative AI-based features, Brandfolder is helping customers locate and distribute assets faster. As a result, Brandfolder is building customer loyalty and increasing sales, growing its business by 99 percent year-over-year. Since moving to GCP, Brandfolder has been able to scale its analytics and data pipeline 50x without a corresponding increase in costs and has not had to expand its development team.
“The ability to quickly solve problems with AI has a substantial impact on our revenue, and that’s more apparent every quarter,” says Jim. “Few of our competitors are doing product- or brand-specific modeling because it takes a lot of time and resources. We overcame those hurdles with Google Cloud.”
NVIDIA and Google Cloud Pave the Way for Single-cell Genomic Analysis

3002
Of your peers have already read this article.
2:00 Minutes
The most insightful time you'll spend today!
In the past decade, the Healthcare and Life Sciences industry has enjoyed a boon in technological and scientific advancement. New insights and possibilities are revealed almost daily. At Google Cloud, driving innovation in cloud computing is in our DNA. Our team is dedicated to sharing ways Google Cloud can be used to accelerate scientific discovery. For example, the recent announcement of AlphaFold2 showcases a scientific breakthrough, powered by Google Cloud, that will promote a quantum leap in the field of proteomics. In this blog, we’ll review another omics use case, single-cell analysis, and how Google Cloud’s Dataproc and NVIDIA GPUs can help accelerate that analysis.
The Need for Performance in Scientific Analysis
The ability to understand the causal relationship between genotypes and phenotypes is one of the long-standing challenges in biology and medicine. Understanding and drawing insights from the complexity of biological systems abounds from the actual code of life (DNA) through to expression of genes (RNA) to translation of gene transcripts into proteins that function in different pathways, cells, and tissues within an organism. Even the smallest of changes in our DNA can have large impacts on protein expression, structure, and function, which ultimately drives development and response – at both cellular and organism levels. And, as the omics space becomes increasingly data- and compute-intensive, research requires an adequate informatics infrastructure. An infrastructure that scales with growing data demands, enables a diverse range of resource-intensive computational activities, and is affordable and efficient – reducing data bottlenecks and enabling researchers to maximize insight.
But where do all these data and compute challenges come from and what makes scientific study so arduous? The layers of biological complexity begin to be made apparent immediately when looking at not just the genes themselves, but their expression. Although all the cells in our body share nearly identical genotypes, our many diverse cell types (e.g. hepatocytes versus melanocytes) express a unique subset of genes necessary for specific functions, making transcriptomics a more powerful method of analysis by allowing researchers to map gene expression to observable traits. Studies have shown that gene expression is heterogeneous, even in similar cell types. Yet, conventional sequencing methods require DNA or RNA extracted from a cell population. The development of single-cell sequencing was pivotal to the omics field. Single-cell RNA sequencing has been critical in allowing scientists to study transcriptomes across large numbers of individual cells.
Despite its potential, and the increasing availability of single-cell sequencing technology, there are several obstacles: an ever increasing volume of high-dimensionality data, the need to integrate data across different types of measurements (e.g. genetic variants, transcript and protein expression, epigenetics) and across samples or conditions, as well as varying levels of resolution and the granularity needed to map specific cell types or states. These challenges present themselves in a number of ways including background noise, signal dropouts requiring imputation, and limited bioinformatics pipelines that lack statistical flexibility. These and other challenges result in analysis workflows that are very slow, prohibiting the iterative, visual, and interactive analysis required to detect differential gene activity.
Accelerating Performance
Cloud computing can help not only with data challenges, but with some of the biggest obstacles: scalability, performance, and automation of analysis. To address several of the data and infrastructure challenges facing single-cell analysis, NVIDIA developed end-to-end accelerated single-cell RNA sequencing workflows that can be paired with Google Cloud Dataproc, a fully-managed service for running open source frameworks like Spark, Hadoop, and RAPIDS. The Jupyter notebooks that power these workflows include examples using samples like human lung cells and mouse brains cells and demonstrate acceleration between CPU-based processing compared to GPU-based workflows.
Google Cloud Dataproc powers the NVIDIA GPU-based approach and demonstrates data processing capabilities and acceleration, which in turn have the potential of delivering considerable performance gains. When paired with RAPIDS, practitioners can accelerate data science pipelines on NVIDIA GPUs, reducing operations like data loading, processing, and training from hours to seconds. RAPIDS abstracts the complexities of accelerated data science by building upon popular Python and Java libraries effortlessly. When applying RAPIDS and NVIDIA accelerated compute to single-cell genomics use cases, practitioners can churn through analysis of a million cells in only a few minutes.
Give it a Try
The journey to realizing the full potential of omics is long; but through collaboration with industry experts, customers, and partners like NVIDIA, Google Cloud is here to help shine a light on the road ahead. To learn more about the notebook provided for single-cell genomic analysis, please take a look at NVIDIA’s walkthrough. To give this pattern a try on Dataproc, please visit our technical reference guide.
Looking for a Cloud Data Warehouse? Find out Why Forrester Thinks Google BigQuery is a Leader

4484
Of your peers have already read this article.
4:30 Minutes
The most insightful time you'll spend today!
We are thrilled to announce that Google has been named a Leader in The Forrester Wave™: Cloud Data Warehouse, Q1 2021 report. For more than a decade, BigQuery, our petabyte-scale cloud data warehouse, has been in a class of its own. We’re excited to share this recognition and we want to thank our strong community of customers and partners for voicing their opinion. We believe this report validates the alignment of our strategy with our customers’ analytics needs.
“Customers like Google’s frequency of data warehouse releases, business value, future proof architecture, high-end scale, geospatial capabilities, strong AI/ML capabilities, good security capabilities, and broad analytical use cases,” according to the Forrester report. Today’s data leaders require a data warehousing platform that provides both depth and breadth and with BigQuery, organizations are able to unlock deeper data science and machine learning capabilities while promoting data democratization and providing the highest levels of availability.
Google BigQuery: 5 out of 5!
Forrester gave Google BigQuery a score of 5 out of 5 across 19 different criteria, including:
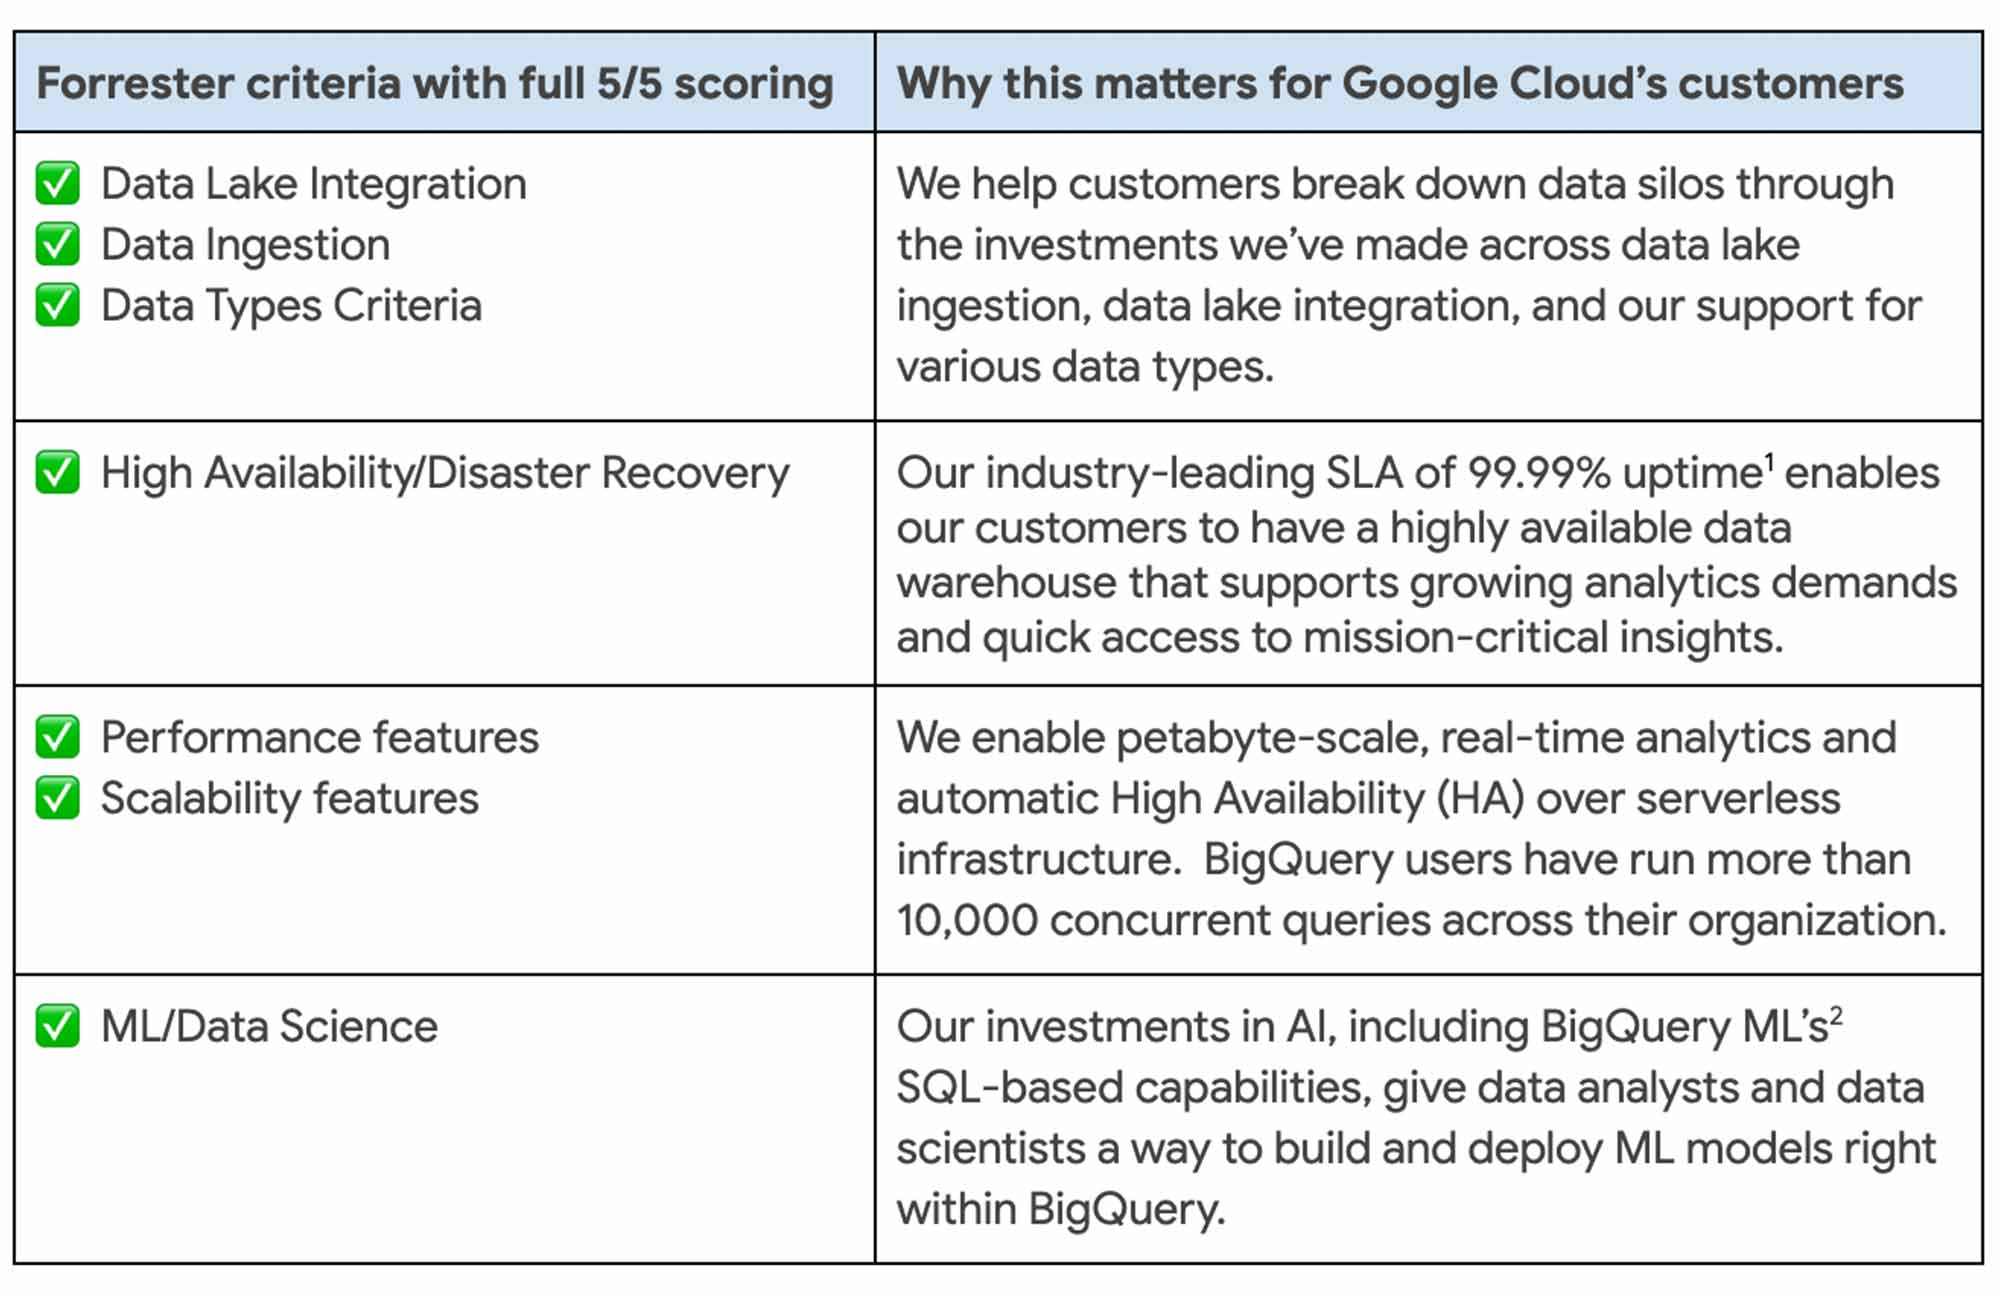
Today, customers across the globe use BigQuery to run business critical analytics workloads to enable BI acceleration, IoT analytics, customer intelligence, AI/ML-based analytics, data science, data collaboration, and data services. Customers such as Verizon, Wayfair, HSBC, Twitter, AirAsia, KeyBank, The Home Depot, and Vodafone have anchored their digital transformation efforts on BigQuery—unlocking deeper insights for their people.
Customers use BigQuery across all industries, to solve issues like credit card fraud detection, predictive forecasting, anomaly detection, log analytics and many more. Forrester recognized this work and gave BigQuery a 5/5 score for supporting vertical and horizontal use cases.
More BigQuery advantages
Google is the first hyperscale provider to offer a multi cloud data analytics solution. With BigQuery Omni, customers can perform cross-cloud analytics with ease, and drive business outcomes they couldn’t achieve with the siloed approach offered by other vendors.
We designed BigQuery to be highly scalable and more open and interoperable so that customers can join data across SQL databases, traditional unstructured data lakes in object storage, and even spreadsheets using any analysis tool.
Recent innovations like BigQuery BI Engine lets us provide the best analytics experience by delivering sub-second query response times from any business intelligence tool, from Google’s Looker and Connected Sheets to Tableau, Microsoft Power BI, ThoughtSpot, and others. Our goal is to meet customers where they are rather than force them into a one-size-fits-all approach to data analysis.
With BigQuery, organizations gain both breadth and depth of capabilities to transform their analytics strategy. Forrester also gave BigQuery 5 out of 5 in:
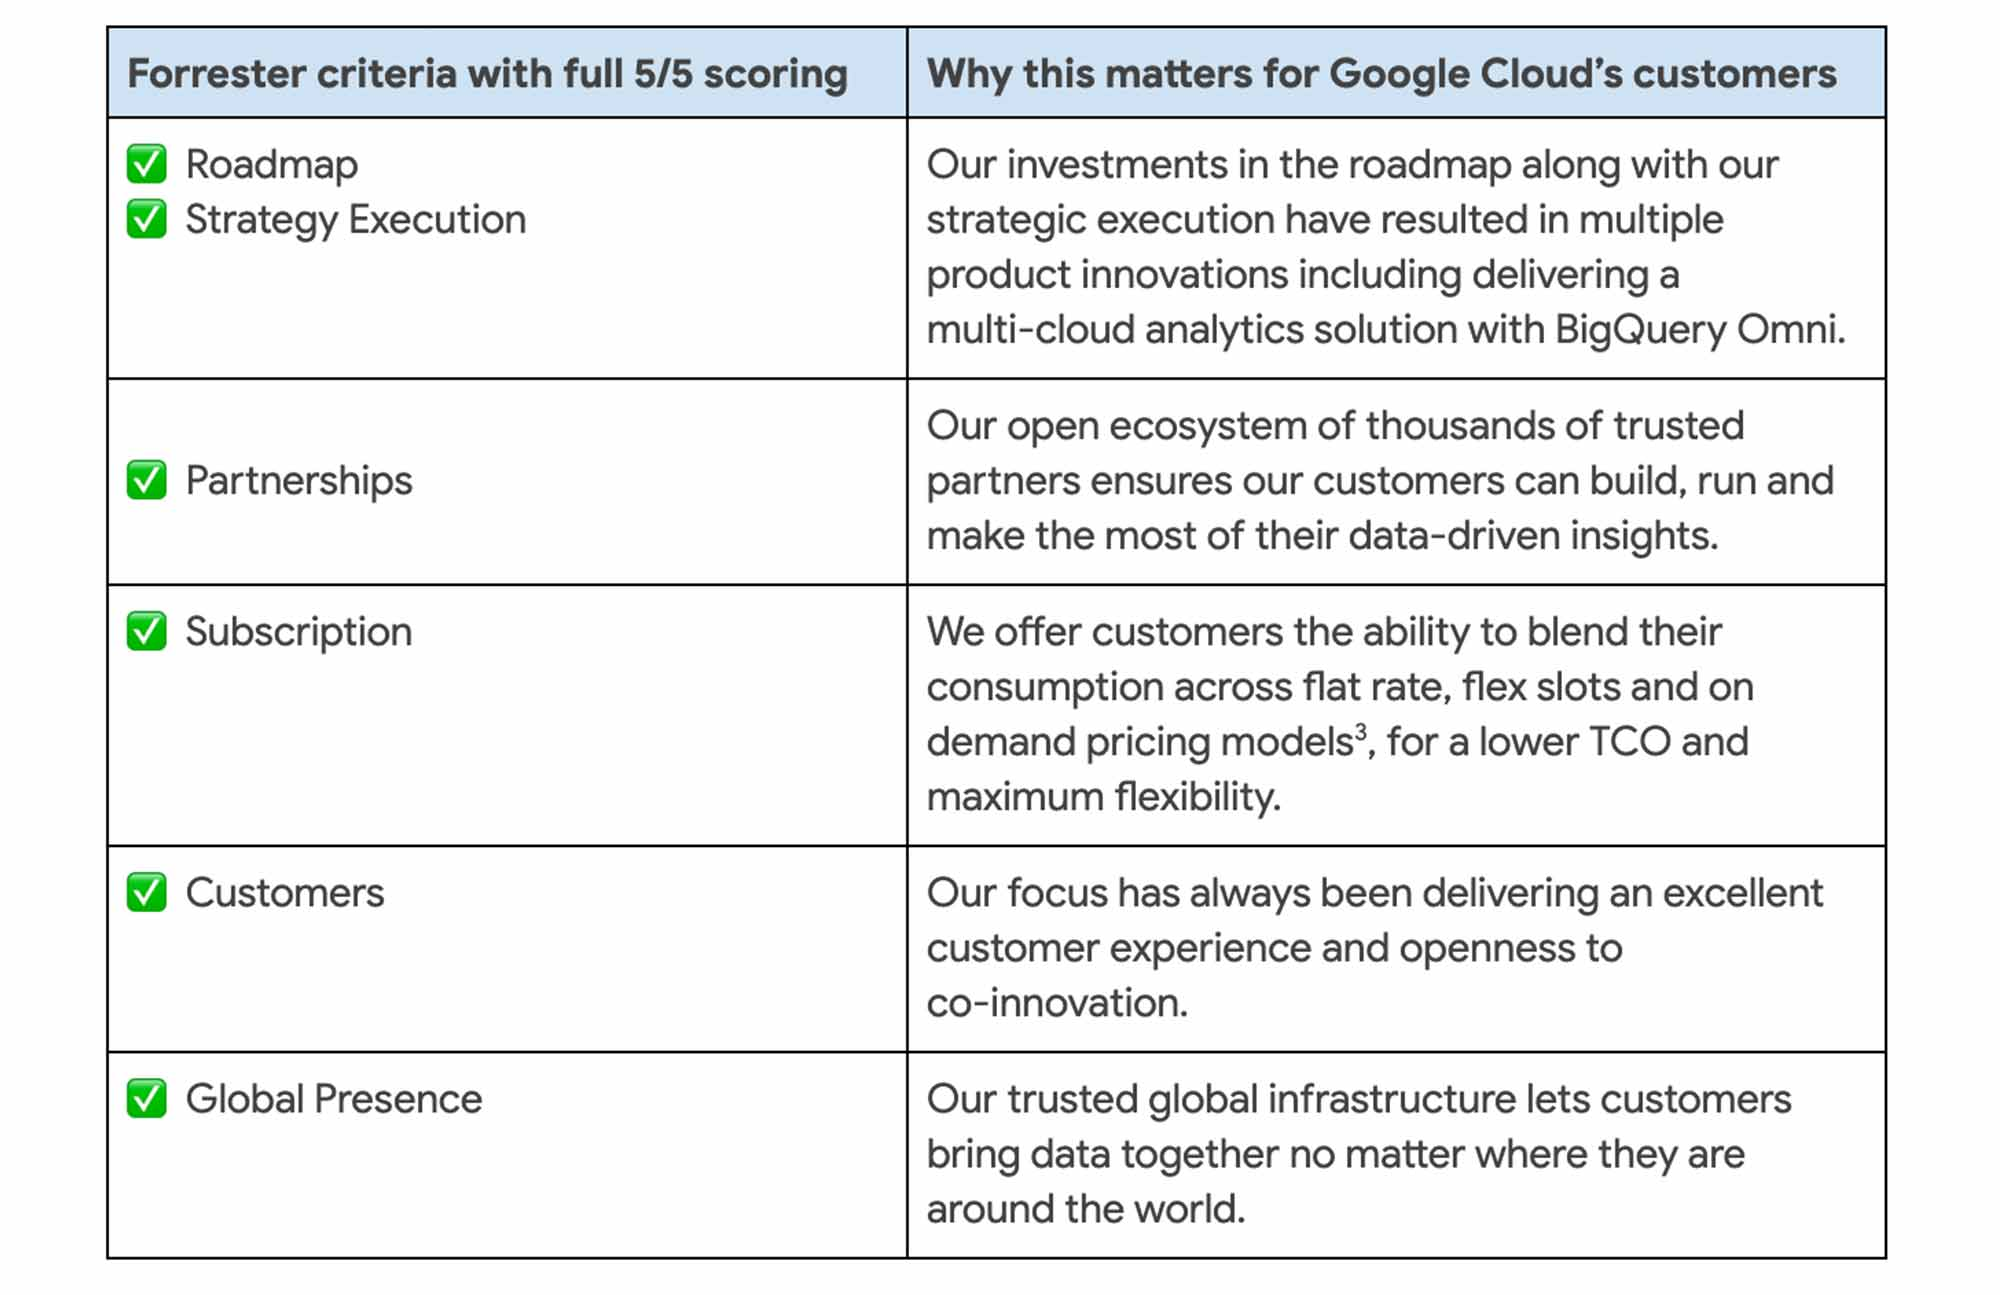
Data-powered innovation
These advantages enable our customers to accelerate their digital transformation and reimagine their business through data-powered innovation. Google’s leadership across AI, analytics, and databases comes together in a single data cloud platform that provides everyone with the ability to get value out of their data faster.
We bring decades of research and innovation in AI to our customers through industry-leading AI solutions, that in turn helps our customers solve their biggest problems. Our support of open standards and APIs enables interoperability between a variety of services for ingestion, storage, processing and analytics across the data cloud platform. And finally, we believe our multi-layered security approach throughout the data stack ensures redundancy and reliability so that customers can have the peace of mind that their data is always protected.
We are honored to be a leader in this Forrester Wave™ and look forward to continuing to innovate and partner with you on your digital transformation journey.
Download the full Forrester Wave™ :Cloud Data Warehouse, Q1 2021 report. And check out these smart analytics reference patterns. To learn more about BigQuery, visit our website, and get started immediately with the free BigQuery Sandbox.
More Relevant Stories for Your Company

Tools to Simplify Streaming Analytics
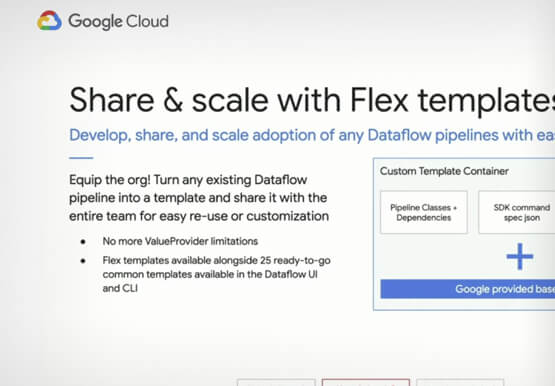
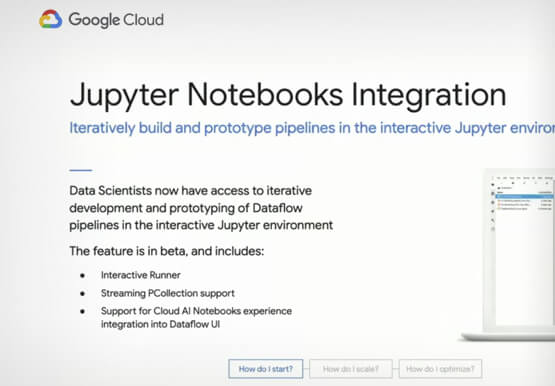
Streaming analytics is transforming how companies interact with their customers and operate with agility. Dataflow supports a number of features to guide you through your journey to adopt streaming, including notebooks for writing your first pipeline, SQL to accelerate your streaming deployments, Flex Templates to scale streaming in your organization,

How Do You Cut Costs and Improve Staff Productivity, and Business Visibility? Ascend Money Has an Answer
Hundreds of millions of residents of South East Asia have only limited access to banking and finance services. However, help is at hand. One of South East Asia's largest fintech businesses, Ascend Money is using digital technologies to realize its mission of enabling as many people as possible to access

How to Predict the Cost of a Managed Streaming and Batch Analytics Service
The value of streaming analytics comes from the insights a business draws from instantaneous data processing, and the timely responses it can implement to adapt its product or service for a better customer experience. “Instantaneous data insights,” however, is a concept that varies with each use case. Some businesses optimize

A Look Back on Google Cloud’s Data Analytics Development Efforts from June
June is the month that holds the summer solstice, and some of us in the northern hemisphere get to enjoy the longest days of sunshine out of the entire year. We used all the hours we could in June to deliver a flurry of new features across BigQuery, Dataflow, Data
