





Combining IoT and Analytics to Warn Manufacturers of Line Break Downs and Increase Profitability

7576
Of your peers have already read this article.
2:45 Minutes
The most insightful time you'll spend today!
Oden Technologies is using the Internet of Things (IoT) to improve the factories of today. The giant network of “things” (including people) connected to each other via the Internet has the potential to reduce waste, increase efficiency, and improve safety across all walks of life. Oden is leading IoT innovation in manufacturing by combining wireless connectivity, big data, and cloud computing.
The use of data to improve manufacturing is practically as old as manufacturing itself. But the computerization of manufacturing has resulted in broad and rapid changes to the way data is collected and processed, as well as the sheer volume of data available.
Oden’s goal is to help manufacturers tap into this data to quickly identify process trends and even warning signs of machine breakdown. Such visibility can reveal opportunities to improve manufacturing and maintenance processes that reduce waste and increase profit margins.
Oden designs and develops data collection devices that can plug into almost any kind of machine and can wirelessly transmit data with minimal complexity and setup time.
Once devices are installed, the Oden technology platform processes data to give manufacturers cutting-edge analytics that are easy to comprehend. Analysis produced by the platform provides factory engineers with data points such as detailed root-cause analysis down to the second, factory-wide performance in real-time, and trend analysis.
Improving cloud delivery
Oden’s previous cloud platform performed satisfactorily, but the company evaluated alternatives in search of potential reductions in cost and complexity and increases in performance.
When evaluating Google Cloud Platform, Oden discovered it would require fewer virtual machine (VM) instances for equivalent performance, which would cut costs. Furthermore, Oden could gain more sophisticated data analytics and machine learning capabilities compared with its existing cloud provider.
Today, Oden runs its entire platform on Google Cloud Platform including Google Compute Engine, Google Cloud Pub/Sub, Google Cloud Bigtable, Google Stackdriver, and Google Kubernetes Engine.
“In order to serve our customers, we need a cloud platform that can scale reliably while keeping costs low, perform under heavy loads, and consistently deliver sophisticated features such as machine learning,” says Willem Sundblad, CEO and Founder at Oden Technologies. “Google Cloud Platform is way ahead in all of these areas compared to our previous cloud provider.”
Capturing tens of millions of metrics a day
Using Google Cloud Platform, Oden can help an average factory capture and store approximately 10 million metrics on a single manufacturing line every day.
Metrics can include extremely granular detail, such as the amount of electricity going to machines, the amount of raw material consumed, and the volume of material produced. Sensors can also capture and transmit environmental information such as temperature, humidity, and dew point so that manufacturers can identify weather-related and seasonal impacts on production.
The updated Oden Cloud Platform uses Kubernetes Engine—powered by the open source Kubernetes system—to run application program interfaces (APIs) that capture data from Oden’s wireless devices on the factory floor.
Google Cloud Pub/Sub then sends the data in real time to Google Cloud Bigtable, where data is processed using Oden’s proprietary analytics tools. Google Stackdriver supports Google Cloud Platform monitoring, logging, and diagnostics, which help Oden deliver its cloud platform with confidence.
Oden Technologies builds dashboards powered by Kubernetes Engine, which pull analyzed data from Google Cloud Bigtable. The dashboards provide customers with real-time visibility into their manufacturing lines. Oden Factory Cloud dashboards allow customers to delve deeper into their data to fine-tune production processes or discover the root causes of production issues.
With the previous cloud provider, Oden required 80 VM instances to run the dashboards. With Google Cloud Platform that number has been cut to 45, which dramatically reduces costs and complexity.
“We migrated from our previous cloud provider to Google Cloud Platform in just one month,” says Willem. “Further, our storage and data analytics costs have decreased by 30%. Cost savings like these allow us to protect customers from rising expenses, keeping us focused on bringing the best products possible to market.”
Faster data access; more efficient factories
With Google Cloud Platform, Oden can now deliver a complete factory analytics picture to manufacturers. In environments where thousands of variables affect the bottom line, businesses can now automatically and perpetually record machine and performance measurement. Oden Factory Cloud gives customers access to comprehensive data insights and can eliminate reliance on onsite infrastructure investments to run their own analytics.
Because manufacturers have access to live data and can analyze production data quickly, they can troubleshoot and resolve problems in minutes rather than months. Such information helps improve product quality, minimize unplanned downtime, cut costs, and improve profitability.
“With the help of Google Cloud Platform, we are helping our customers to be data-driven, which wasn’t possible before,” adds Willem. “They now understand that data is their most important asset. That allows them to be more innovative and continually improve their production processes.”
Unifying Data and AI: Bringing Unstructured Data Analytics to BigQuery

4174
Of your peers have already read this article.
2:30 Minutes
The most insightful time you'll spend today!
Over one third of organizations believe that data analytics and machine learning have the most potential to significantly alter the way they run business over the next 3 to 5 years. However, only 26% of organizations are data driven. One of the biggest reasons for this gap is that a major portion of the data generated today is unstructured, which includes images, documents, and videos. It is estimated to cover roughly up to 80% of all data, which has so far remained untapped by organizations.
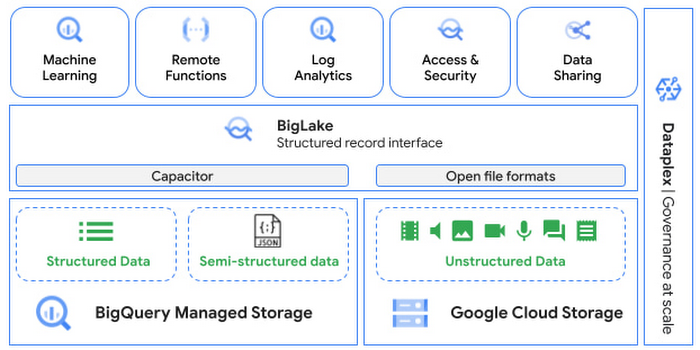
One of the goals of Google’s data cloud is to help customers realize value from data of all types and formats. Earlier this year, we announced BigLake, which unifies data lakes and warehouses under a single management framework, enabling you to analyze, search, secure, govern and share unstructured data using BigQuery.
At Next ‘22, we announced the preview of object tables, a new table type in BigQuery that provides a structured record interface for unstructured data stored in Google Cloud Storage. This enables you to directly run analytics and machine learning on images, audio, documents and other file types using existing frameworks like SQL and remote functions natively in BigQuery itself. Object tables also extend our best practices of securing, sharing and governing structured data to unstructured, without needing to learn or deploy new tools.
Directly process unstructured data using BigQuery ML
Object tables contain metadata such as URI (Uniform Resource Identifier), content type, and size that can be queried just like other BigQuery tables. You can then derive inferences using machine learning models on unstructured data with BigQuery ML. As part of preview, you can import open source TensorFlow Hub image models, or your own custom models to annotate the images. Very soon, we plan to enable this for audio, video, text and many other formats, and pre-trained models to enable out-of-the box analysis. Check out this video to learn more and watch a demo.
Create an object table
CREATE EXTERNAL TABLE my_dataset.object_table
WITH CONNECTION us.my_connection
OPTIONS(uris=["gs://mybucket/images/*.jpg"],
object_metadata="SIMPLE", metadata_cache_mode="AUTOMATIC");
# Generate inferences with BQML
SELECT * FROM ML.PREDICT(
MODEL my_dataset.vision_model,
(SELECT ML.DECODE_IMAGE(data) AS img FROM my_dataset.object_table)
);By analyzing unstructured data natively in BigQuery, businesses can
- Eliminate manual effort as pre-processing steps such as tuning image sizes to model requirements are automated
- Leverage the simple and familiar SQL interface to quickly gain insights
- Save costs by utilizing existing BigQuery slots without needing to provision new forms of compute
Adswerve is a leading Google Marketing, Analytics and Cloud partner on a mission to humanize data. Twiddy & Co. is Adswerve’s client – a vacation rental company in North Carolina. By combining structured and unstructured data, Twiddy and Adswerve used BigQuery ML to analyze images of rental listings and predict the click-through rate, enabling data-driven photo editorial decisions.
“Twiddy now has the capability to use advanced image analysis to stay competitive in an ever changing landscape of vacation rental providers – and can do this using their in-house SQL skills.” said Pat Grady, Technology Evangelist, Adswerve
Process unstructured data using remote functions
Customers today use remote functions (UDFs) to process structured data for languages and libraries that are not supported in BigQuery. We are extending this capability to process unstructured data using object tables.
Object tables provide signed URLs to allow remote UDFs running on Cloud Functions or Cloud Run to process the object table content. This is particularly useful for running Google’s pre-trained AI models, including Vision AI, Speech-to-Text, Document AI, open source libraries such as Apache Tika, or deploying your own custom models where performance SLAs are important.
Here’s an example of an object table being created over PDF files that are parsed using an open source library running as a remote UDF.
SELECT uri, extract_title(samples.parse_tika(signed_url)) AS title<br>FROM EXTERNAL_OBJECT_TRANSFORM(TABLE pdf_files_object_table,<br>["SIGNED_URL"]);
Extending more BigQuery capabilities to unstructured data
Business intelligence – The results of analyzing unstructured data either directly in BigQuery ML or via UDFs can be combined with your structured data to build unified reports using Looker Studio (at no charge), Looker or any of your preferred BI solutions. This allows you to gain more comprehensive business insights. For example, online retailers can analyze product return rates by correlating them with the images of defective products. Similarly, digital advertisers can correlate ad performance with various attributes of ad creatives to make more informed decisions.
BigQuery search index – Customers are increasingly using the search functionality of BigQuery to power search use cases. These capabilities now extend to unstructured data analytics as well. Whether you use BigQueryML to produce inference on images or use remote UDFs with Doc AI to produce document extraction, the results can now be search indexed and used to support search access patterns.
Here’s an example of search index on data that is parsed from PDF files:
CREATE SEARCH INDEX my_index ON pdf_text_extract(ALL COLUMNS);
SELECT * FROM pdf_text_extract WHERE SEARCH(pdf_text, "Google");Security and governance – We are extending BigQuery’s row-level security capabilities to help you secure objects in Google Cloud Storage. By securing specific rows in an object table, you can restrict the ability of end users to retrieve the signed URLs of corresponding URIs present in the table. This is a shared responsibility security model, for which administrators need to ensure that end users don’t have direct access to Google Cloud Storage, and use signed URLs from object tables as the only access mechanism.
Here’s an example of a policy for PII images that are secured to be first processed through a blur pipeline:
CREATE ROW ACCESS POLICY pii_data ON object_table_images
GRANT TO ("group:admin@example.com")
FILTER USING (ARRAY_LENGTH(metadata)=1 AND
metadata[OFFSET(0)].name="face_detected")
Soon, Dataplex will support object tables, allowing you to automatically create object tables in BigQuery and manage and govern unstructured data at scale.
Data sharing – You can now use Analytics Hub to share unstructured data with partners, customers and suppliers while not compromising on security and governance. Subscribers can consume the rows of object tables that are shared with them, and use signed URLs for unstructured data objects.
Getting Started
Submit this form to try these new capabilities that unlock the power of your unstructured data in BigQuery. Watch this demo to learn more about these new capabilities.
Special thanks to engineering leaders Amir Hormati, Justin Levandoski and Yuri Volobuev for contributing to this post.
ShareChat Builds its Diverse, Hyperlocal Social Network. Thanks to Google Cloud

9231
Of your peers have already read this article.
3:00 Minutes
The most insightful time you'll spend today!
Editor’s note: Today’s guest post comes from Indian social media platform ShareChat. Here’s the story of how they improved performance, app development, and analytics for serving regional content to millions of users using Google Cloud.
How do you create a social network when your country has 22 major official languages and countless active regional dialects? At ShareChat, we serve more than 160 million monthly active users who share and view videos, images, GIFs, songs, and more in 15 different Indian languages. We also launched a short video platform in 2020, Moj, which already supports over 80 million monthly active users.
Connecting with people in the language they understand
As mobile data and smartphones have become more affordable in India, we noticed a large new segment of people, many in rural areas, being welcomed onto the internet. However, many of them didn’t speak English, and when it comes to accessing content and information—language plays a significant role. Instead of joining other social media sites where English reigned supreme, new internet users chose to join language or dialect-specific Whatsapp groups where they felt more comfortable instead.
So, we set out to build a platform where people can share their opinions, document their lives, and make new friends, all in their native language. ShareChat simplifies content and people discovery by using a personalized content newsfeed to deliver language-specific content to the right audience.
Given the high-intensity data and high volume of content and traffic, we rely heavily on IT infrastructure. On top of that, a large number of our users rely on 2G networks to post, like, view, or follow each other. Our platform needs to deliver great experiences to people who are spread out across the country and different networks without any reduction in performance.
The right cloud partner to support future growth
ShareChat was born in the cloud—we already knew how to scale systems to serve a large customer base with our existing cloud provider. But like many companies, we struggled with over-provisioning compute and storage to accommodate unpredictable traffic and avoid running out of storage. With demand rising for local language content and an increase in online interactions in response to the COVID-19 crisis, we realized that we would need a more efficient way to scale dynamically and allocate resources as needed.
Google Cloud was a natural choice for us. We wanted to partner with a technology-first company that would make it easy (and cost-effective) to manage a strong technology portfolio that would allow us to build whatever we wanted. Google is at the forefront of technology innovation and provided everything we needed to build, run, and manage our applications (including creating an efficient DevOps pipeline to fix and release new features quickly).
We had a few issues in mind at the start of discussions with the Google Cloud team, but over time, as we got information and support from them, we realized that these were the partners we wanted in our corner when it came time to tackle our most challenging problems. In the end, we decided to take our entire infrastructure to Google Cloud.
To support millions of users, we deploy and scale using Google Kubernetes Engine. While we analyze our data using a combination of managed data cloud services, such as Pub/Sub for data pipelines, BigQuery for analytics, Cloud Spanner for real-time app serving workloads, and Cloud Bigtable for less-indexed databases. We also rely on Cloud CDN to help us distribute high-quality and reliable content delivery at low latency to our users.
We now use just half the total core consumption of our legacy environment to run ShareChat’s existing workloads.
Google Cloud delivers better outcomes at every level
By moving to Google Cloud, we saw major benefits in several key areas:
Zero-downtime migration for users
At the time of migration, we had over 70 terabytes of data, consisting of 220 tables—some of which were up to 14 terabytes with nearly 50 billion rows. Due to our data’s interdependencies, moving services over one at a time wasn’t an option for us.
Even though we were migrating such large volumes of data, we didn’t want to impact any of our customers. Latency spikes for out-of-sync data might affect message delivery. For instance, if a message or notification was delayed, we didn’t want to risk a bad user experience causing someone to abandon ShareChat.
To prepare for the move, we ran a proof-of-concept cluster for over four months to test database performance in a real-world scenario for handling more than a million queries per second. Using an open-source API gateway, we replicated our legacy data environment into Google Cloud for performance testing and capacity analysis. As soon as we were confident Google Cloud could handle the same traffic as our previous cloud environment, we were ready to execute.
Using wrappers, we were able to migrate without having to change anything in our existing application code. The entire migration of 60 million users to Google Cloud took five hours—without any data loss or downtime. Today, ShareChat has grown to 160 million users, and Google Cloud continues to give us the support we need.
Scaling globally to meet unexpected demand
We rely on real-time data to drive everything on ShareChat by tracking everything that goes on in our app—from messages and new groups to content people like or who they follow. Our users create more than a million posts per day, so it’s critical that our systems can process massive amounts of data efficiently.
We chose to migrate to Spanner for its global consistency and secondary index. Unlike our legacy NoSQL database, we could scale without having to rethink existing tables or schema definitions and keep our data systems in sync across multiple locations. It’s also cost-effective for us—moving over 120 tables with 17 indexes into Cloud Spanner reduced our costs by 30%.
Spanner also replicates data seamlessly in multiple locations in real time, enabling us to retrieve documents if one region fails. For instance, when our traffic unexpectedly grew by 500% over just a few days, we were able to scale horizontally with zero lines of code change. We were also launching our Moj video app simultaneously, and we were able to move it to another region without a single issue.
Simplifying development and deployment
On average, we experience about 80,000 requests per second (RPS) –nearly 7 billion RPS per day. That means daily push notifications sent out to the entire user base about daily trending topics can often result in a spike of 130,000 RPS in just a few seconds.
Instead of over-provisioning, Google Kubernetes Engine (GKE) enables us to pre-scale for traffic spikes around scheduled events, such as holidays like Diwali, when millions of Indians send each other greetings.
Migrating to GKE has also enabled us to adopt more agile ways of work, such as automating deployment and saving time with writing scripts. Even though we were already using container-based solutions, they lacked transparency and coverage across the entire deployment funnel.
Kubernetes features, such as sidecar proxy, allows us to attach peripheral tasks like logging into the application without requiring us to make code changes. Kubernetes upgrades are managed by default, so we don’t have to worry about maintenance and stay focused on more valuable work. Clusters and nodes automatically upgrade to run the latest version, minimizing security risks and ensuring we always have access to the latest features.
Low latency and real-time ML predictions
Even though many of our users may be accessing ShareChat outside of metropolitan areas, it doesn’t mean they’re more patient if the app loads slowly or their messages are delayed. We strive to deliver a high-performance experience, regardless of where our users are.
We use Cloud CDN to cache data in five Google Cloud Point of Presence (PoP) locations at the edge in India, allowing us to bring content as close as possible to people and speeding up load time. Since moving to Cloud CDN, our cache hit ratio has improved from 90% to 98.5%—meaning our cache can handle 98.5% of content requests.
As we expand globally, we’d like to use machine learning to reach new people with content in different languages. We want to build new algorithms to process real-time datasets in regional languages and accurately predict what people want to see. Google Cloud gives us an infrastructure optimized to handle compute-intensive workloads that will be useful to us both now—and in the future.
The confidence to build the best platform
Our current system now performs better than before we migrated, but we are continuously building new features on top of it. Google’s data cloud has provided us with an elegant ecosystem of services that allows us to build whatever we want, more easily and faster than ever before.
Perhaps the biggest advantage of partnering with Google Cloud has been the connection we have with the engineers at Google. If we’re working to solve a specific problem statement and find a specific solution in a library or a piece of code, we have the ability to immediately connect with the team responsible for it.
As a result, we have experienced a massive boost in our confidence. We know that we can build a really good system because we not only have a good process in place to solve problems—we have the right support behind us.

Google’s Lesson on Leveraging AI and More to Optimize Cloud Value for Innovation
DOWNLOAD EXPLAINER4836
Of your peers have already downloaded this article
1:30 Minutes
The most insightful time you'll spend today!
Google has managed to stay ahead of the curve and demonstrate its ‘growth while staying innovative’ approach using advanced open technologies, AI/ML based analytics solutions, as well as tools for team collaboration and skill development, automation and storage security. Businesses too can achieve the same by deriving maximum value from its people and technology by following Google’s simple guide to stay innovative. Download to learn more.
Geospatial Data for Business Apps Drive Sustainable and Accurate Decision-making

4349
Of your peers have already read this article.
1:30 Minutes
The most insightful time you'll spend today!
Organizations that collect geospatial data can use that information to understand their operations, help make better business decisions, and power innovation. Traditionally, organizations have required deep GIS expertise and tooling in order to deliver geospatial insights. In this post, we outline some ways that geospatial data can be used in various business applications.
Assessing environmental risk
Governments and businesses involved in insurance underwriting, property management, agriculture technology, and related areas are increasingly concerned with risks posed by environmental conditions. Historical models that predict natural disasters like pollution, flooding, and wildfires are becoming less accurate as real-world conditions change. Therefore, organizations are incorporating real-time and historical data into a geospatial analytics platform and using predictive modeling to more effectively plan for risk and to forecast weather.
Selecting sites and planning expansion
Businesses that have storefronts, such as retailers and restaurants, can find the best locations for their stores by using geospatial data like population density to simulate new locations and to predict financial outcomes. Telecom providers can use geospatial data in a similar way to determine the optimal locations for cell towers. A site selection solution can combine proprietary site metrics with publicly-available data like traffic patterns and geographic mobility to help organizations make better decisions about site selection, site rationalization, and expansion strategy.
Planning logistics and transport
For freight companies, courier services, ride-hailing services, and other companies that manage fleets, it’s critical to incorporate geospatial context into business decision-making. Fleet management operations include optimizing last-mile logistics, analyzing telematics data from vehicles for self-driving cars, managing precision railroading, and improving mobility planning. Managing all of these operations relies extensively on geospatial context. Organizations can create a digital twin of their supply chain that includes geospatial data to mitigate supply chain risk, design for sustainability, and minimize their carbon footprint.
Understanding and improving soil health and yield
AgTech companies and other organizations that practice precision agriculture can use a scalable analytics platform to analyze millions of acres of land. These insights help organizations understand soil characteristics and help them analyze the interactions among variables that affect crop production. Companies can load topography data, climate data, soil biomass data, and other contextual data from public data sources. They can then combine this information with data about local conditions to make better planting and land-management decisions. Mapping this information using geospatial analytics not only lets organizations actively monitor crop health and manage crops, but it can help farmers determine the most suitable land for a given crop and to assess risk from weather conditions.
Managing sustainable development
Geospatial data can help organizations map economic, environmental, and social conditions to better understand the geographies in which they conduct business. By taking into account environmental and socio-economic phenomena like poverty, pollution, and vulnerable populations, organizations can determine focus areas for protecting and preserving the environment, such as reducing deforestation and soil erosion. Similarly, geospatial data can help organizations design data-driven health and safety interventions. Geospatial analytics can also help an organization meet its commitments to sustainability standards through sustainable and ethical sourcing. Using geospatial analytics, organizations can track, monitor, and optimize the end-to-end supply chain from the source of raw materials to the destination of the final product.
What’s next
Google Cloud provides a full suite of geospatial analytics and machine learning capabilities that can help you make more accurate and sustainable business decisions without the complexity and expense of managing traditional GIS infrastructure. Get started today by learning how you can use Google Cloud features to get insights from your geospatial data, see Geospatial analytics architecture.
Acknowledgements: We’d like to thank Chad Jennings, Lak Lakshmanan, Kannappan Sirchabesan, Mike Pope, and Michael Hao for their contributions to this blog post and the Geospatial Analytics architecture.
Mercari’s Big Leap: Supercharging Growth with Google Cloud’s BigQuery

1119
Of your peers have already read this article.
6:30 Minutes
The most insightful time you'll spend today!
When peer-to-peer marketplace Mercari came to the US in 2014, it had its work cut out for it. Surrounded by market giants like eBay, Craigslist, and Wish, Mercari needed to carve out an approach to compete for new users. Furthermore, Mercari wanted to build a network for buyers and sellers to return to, rather than a site for individual specialty purchases.
As an online marketplace that connects millions of people across the U.S. to shop and sell items of value no longer being used, Mercari is built for the everyday shopper and casual seller. Two teams, Machine Learning (ML) team and Marketing Technology specialists, both led by Masumi Nakamura, Mercari VP of Engineering, saw an opportunity to supercharge Mercari’s growth in the US by leveraging their first-party data in BigQuery and connecting predictive models built in Google Cloud directly to marketing channels, such as churn predictions and item recommendations for email campaigns, and LTV predictions to optimize paid media. Churn predictions could be used to target marketing communications, and item recommendations could be used to personalize the content of those communications at the user level. By fully utilizing cloud computing services, they could grow sustainably and flexibly, focusing their team’s efforts where they belonged — user understanding and personalized marketing.
In 2018, the Mercari US team engaged GrowthLoop, formerly Flywheel Software, experts in leveraging first-party customer data for business growth. Working exclusively in Google Cloud and BigQuery, GrowthLoop helped Masumi transform Marketing Technology at Mercari in the US.
Use cases: challenges
Masumi and the ML team’s primary goal aimed to reduce churn across buyers and sellers. Customers would make an initial purchase, but repurchase and resale rates were lower than the team hoped for. The ML team, led by Masumi, was confident that if they could get customers to make a second and third purchase, they could drive strong lifetime value (LTV).
Despite the team’s robust data science capabilities and investments in a data warehouse (BigQuery), they were missing the ability to streamline efforts for efficient audience segmentation and targeting. Like most companies looking to utilize data for marketing, the team at Mercari had to engage with engineering in order to build out customer segments for campaign launches and testing. From start to finish, launching a single campaign could take three months.
In short, Mercari needed a way to speed up the process across the teams at Mercari. How could they turn the team’s predictions into active marketing experiments with greater velocity and agility?
Solution: BigQuery and GrowthLoop supercharge growth across the customer lifecycle
With their strong data engineering foundation and BigQuery already in place, the Mercari team began addressing their needs step-by-step. First, they used predictions to identify retention features, then built out initial segment definitions based on those features. From there, the team designed and launched experiments and measured their performance, refining as they went. By providing Mercari’s marketing team with the ability to build their own customer lists that leveraged predictive models without requiring continuous support from other teams’ data engineers and business intelligence analysts, GrowthLoop enabled them to address churn and acquisition with a single, self-serve solution.
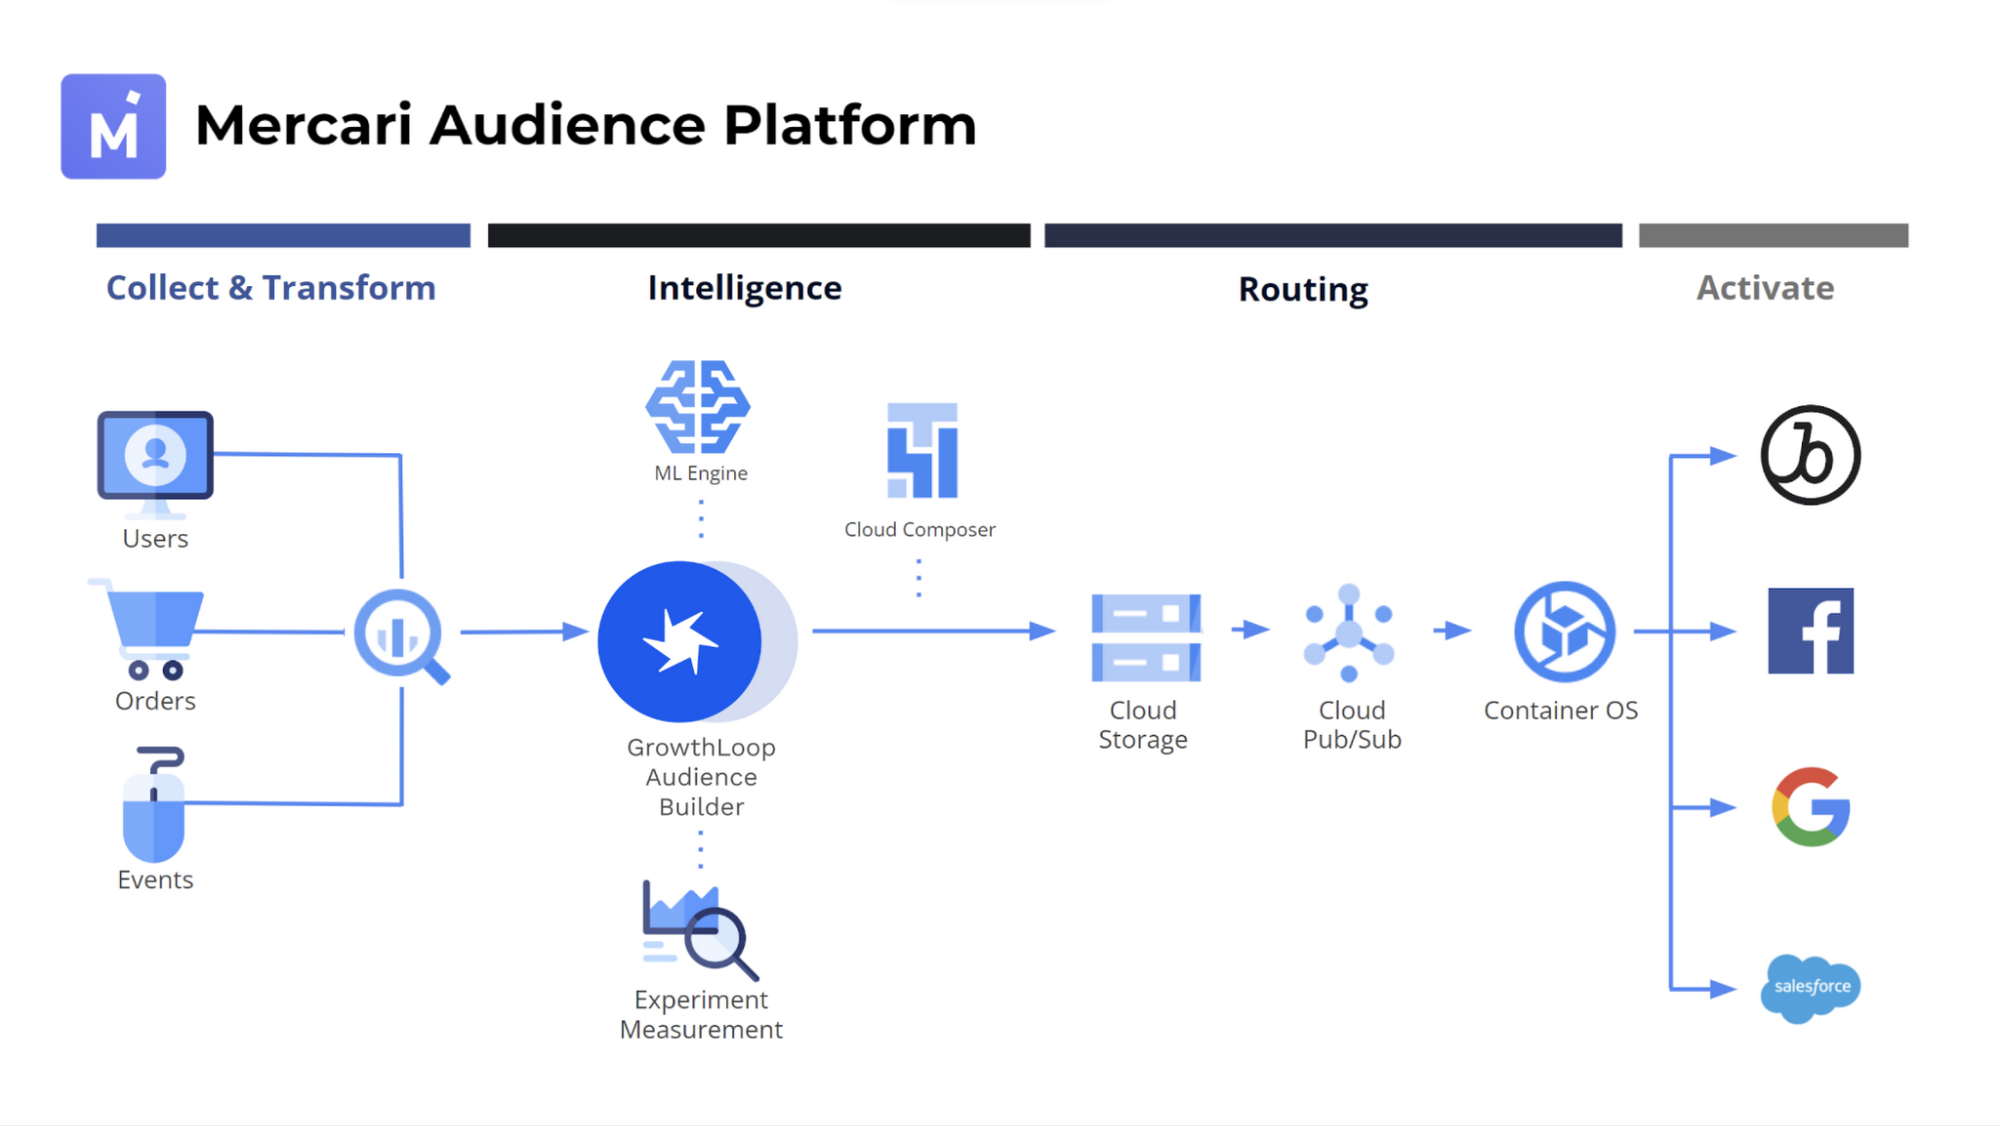
The dynamic duo: GrowthLoop and BigQuery
- Customer 360: GrowthLoop enabled Mercari to combine their data sources into a single view of their customers in BigQuery, then connected them to marketing and sales channels via GrowthLoop’s platform. Notably, Mercari is able to leverage its own complex data model, which was ideal for a two-sided marketplace. This is shown in the “Collect & Transform” stage in the architecture diagram above.
- Predictive models: GrowthLoop activated predictions that had been snapshotted by Mercari’s team in BigQuery. The Mercari ML team used Jupyter notebooks offering part of Google Vertex AI Workbench to build user churn and customer lifetime value (CLTV) prediction models, then productionized them using Cloud Composer to deploy Airflow DAGs, which wrote the predictions back to BigQuery for targeting, and triggered exports to destination channels using Pub/Sub. This is shown in the “Intelligence” stage of the architecture diagram above.
- Extensible measurement and data visualization: Since GrowthLoop writes all audience data back to BigQuery, the Mercari analytics team can conduct performance analysis on metrics from revenue to retention. They are able to use GrowthLoop’s performance visualization in-app, but they are also able to create custom data visualizations with Looker Studio. This is also shown in the “Intelligence” stage of the architecture diagram.
- Seamless routing and activation: With GrowthLoop’s audience platform connected directly to Customer 360 and the predictive model’s results in BigQuery, the marketing team is able to launch and sync audiences and their personalization attributes across all of Mercari’s major marketing, sales and product channels, such as Braze, Google Ads and other destinations. This is shown in the “Routing” and “Activate” stage of the architecture diagram.
“Being able to measure what you’re doing – that results-based orientation – is key. The thing that I like most about GrowthLoop is that you brought a really fundamental way of thinking which was very feedback-based and open to experimenting but within reason. With other products, that feedback loop isn’t so built in that it’s very easy to get lost.”– Masumi Nakamura, VP of Engineering at Mercari
Predictive modeling puts the burn on churn
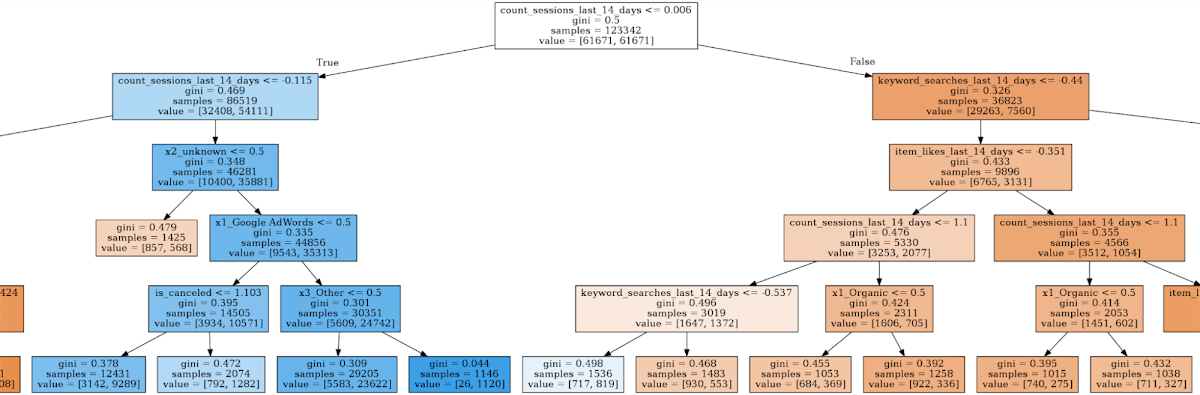
In collaboration with GrowthLoop, Mercari began analyzing user data in BigQuery via Vertex AI Workbench to identify patterns across churned customers. The teams evaluated a range of attributes like the customer acquisition channel, categories browsed or purchased from, and whether or not they had any saved searches while shopping. Comparing various models and performance metrics, the teams selected the best model for accurately predicting when a buyer or seller was at risk to churn. For sellers, they evaluated audience members by the time elapsed since their last sale – for buyers, the time since their last purchase.
These churn prediction scores could then be applied to data pipelines that would feed into GrowthLoop’s audience builder. Audience members with a high likelihood to churn would be segmented into their own group and from there, Mercari could target those users with relevant paid media and email campaigns.
By partnering with GrowthLoop, Mercari was able to simultaneously bridge the gap between the data and marketing teams – and reduce the time between segmentation and campaign launch from months to just a few days.
“One of the big areas of benefit of working with GrowthLoop was the increased integration of marketing channels such as the CRM, User Acquisition, as well as more traditional marketing channels.” – Masumi Nakamura, VP of Engineering at Mercari
Creating the audience within the audience
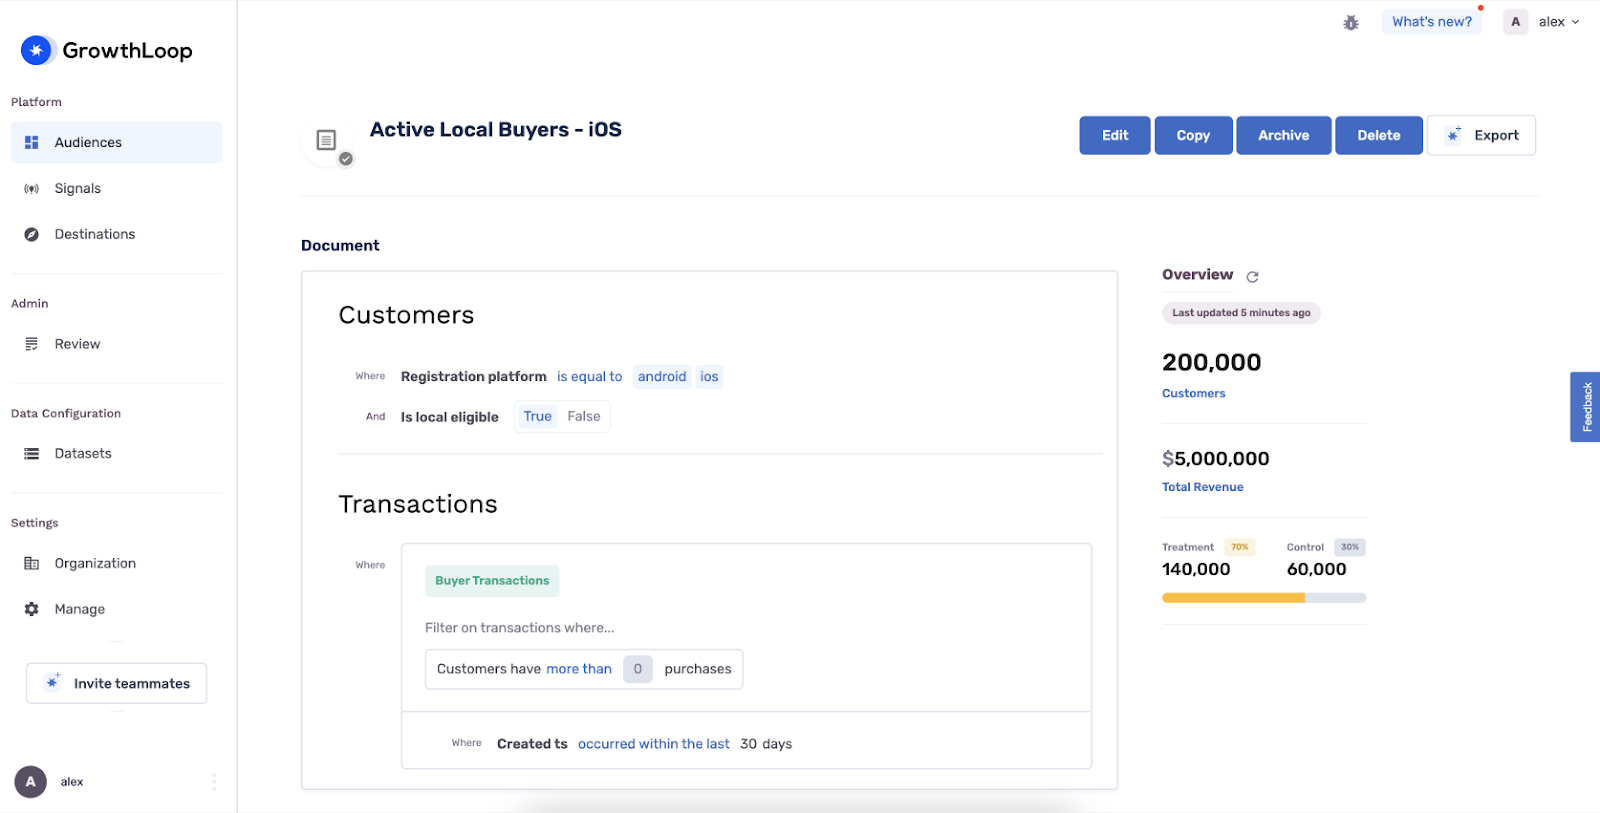
Once the team had successfully created a model to predict churn across buyers and sellers, Mercari needed to launch retargeting campaigns to measure their ability to reduce churn. Each of their ongoing experiments features tailored segments along with automatic A/B testing. With analytics and activation all under one roof, the marketing team at Mercari could craft audiences and begin measuring the impact of their targeted campaigns. Since starting their work with GrowthLoop, the Mercari team has created over 120 audiences.
“Our marketing teams are more sophisticated with in-house knowledge, but GrowthLoop provides a more user-friendly way to build audiences for campaigns.” – Masumi Nakamura, VP of Engineering, Mercari
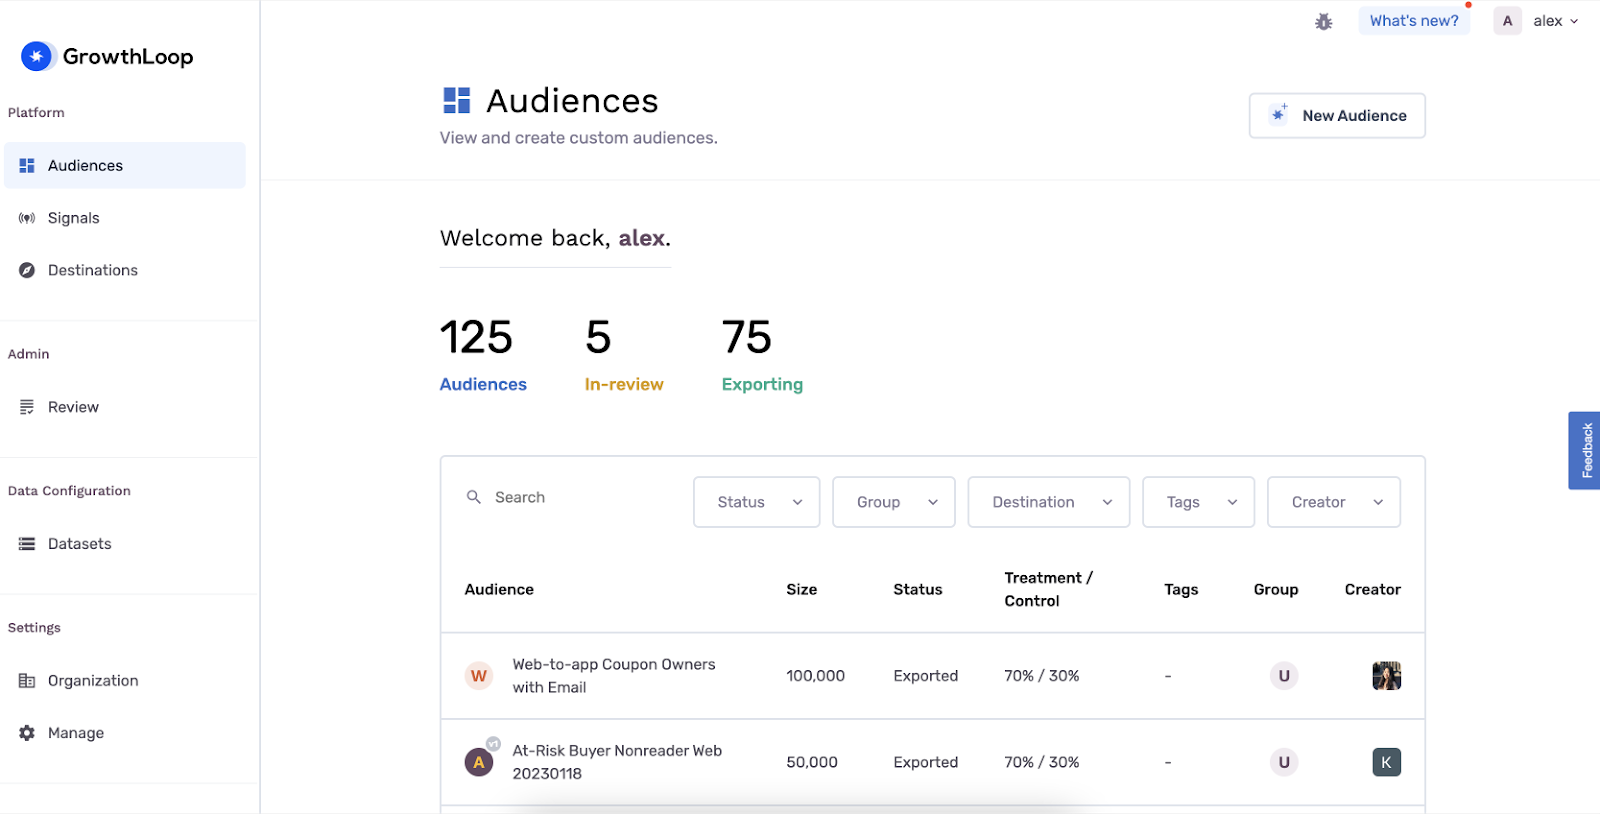
“GrowthLoop brings a very fundamental way of thinking about problems, including experimentation…. The ability to organize experiments and results was key. The number of variables is too high for most people without good organization.”– Masumi Nakamura, VP of Engineering at Mercari
Making segmentation smarter
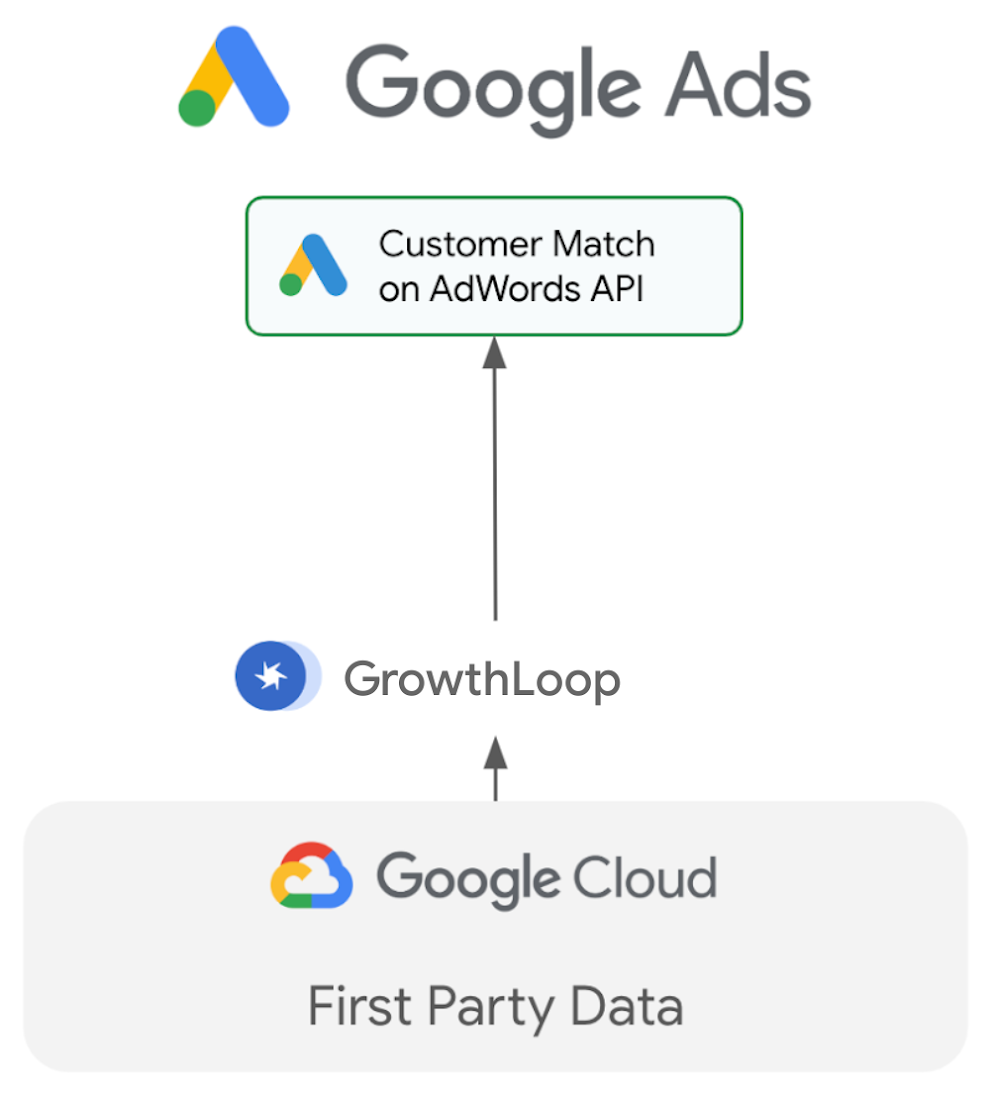
Mercari’s first audiences leveraging GrowthLoop were sent to Braze to supercharge email campaigns and coupons with churn predictions and automated campaign performance evaluations. Then, Mercari shifted its focus to Facebook for paid media retargeting, using GrowthLoop’s lifecycle segmentation framework to target customers at the right step in their user journey. Lastly, Mercari moved its focus to Google Ads, where they used GrowthLoop to implement new segmentation models based on product category propensity. Mercari had long used Google Ads for product listing ads, and with GrowthLoop, Mercari was able to define more powerful product propensity segments and measure custom incremental lift metrics.
Finding new users in the haystack
Finally, in addition to preventing churn and driving retention, the Mercari team also wanted to boost user acquisition. They were having trouble measuring performance of UA campaigns due to new iOS and Facebook data privacy restrictions that made measuring campaign attribution impossible for many users. Using the familiar stack of Vertex AI Workbench for analysis, performance analysis on campaign data in BigQuery, and Airflow DAGs deployed via Cloud Composer to productionize the data pipelines, GrowthLoop enabled the team to activate targeted campaigns based on a user’s geographical location. In this way, Mercari could make decisions about their UA campaigns using incrementality analysis between geographic regions rather than attribution data, thus preserving user privacy.
The Mercari approach to customer data activation and acquisition
Other marketplace retailers can learn from Mercari’s successes activating data from BigQuery with GrowthLoop. Here are a few best practices to apply:
Identify your team’s needs and existing strengths
Mercari knew that their team had built out a strong foundation for data analysis within BigQuery. They also knew that their process was missing a key component that would allow them to activate that data. In order to achieve similar results, work to evaluate the strength of your team and your data – and define exactly what you aim to achieve with customer segmentation.
Partner with the right providers
With BigQuery, the Mercari team had all of their data centralized in one single location, simplifying the process for predictive modeling, segmentation, and activation. By partnering with GrowthLoop, this centralized data could be activated with ease across Mercari’s marketing teams. When evaluating providers for data warehousing, segmentation, and activation, be sure to partner with a provider that ensures you can get the most out of your data.
Know your audience
With a deeper understanding of their customers, Mercari was able to see nearly immediate value. By investing in the proper tools to accurately predict customer behavior, Mercari delivered impact in exactly the right areas. Using the data you’ve already compiled on your customers, consider partnering with a customer segmentation platform provider like GrowthLoop. In fact, Masumi went so far as to organize his Machine Learning team around these concepts: “We split the ML team into two areas – one to augment and work with GrowthLoop, the other team was to augment and orient around item data.”
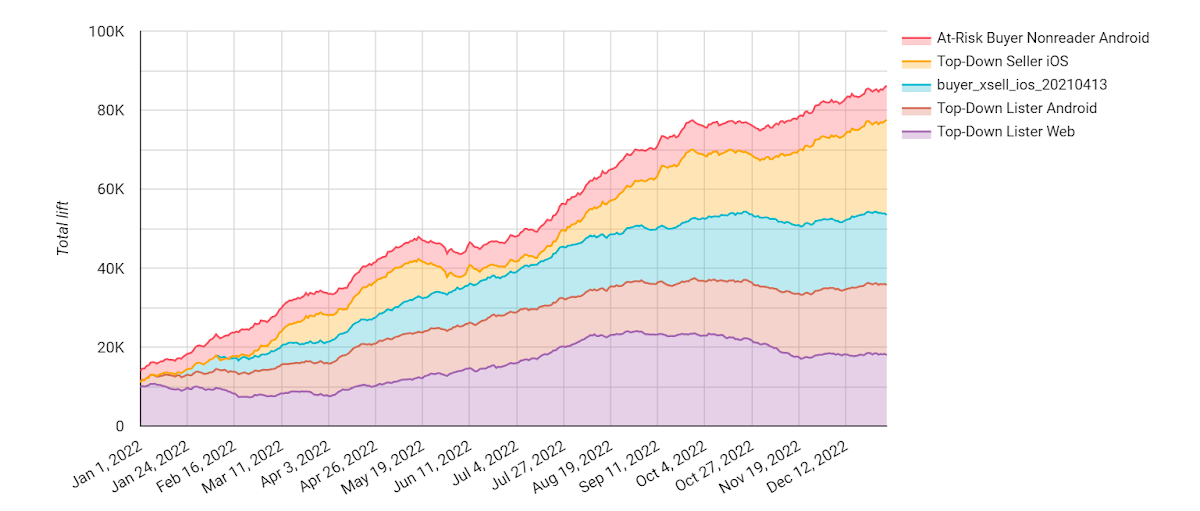
Scale has been modified to intentionally obfuscate actual results.
How to boost growth like Mercari in three steps
Today, many leading brands leverage GrowthLoop and BigQuery to drive marketing and sales wins. Whether your company is in retail, financial services, travel, software, or another industry entirely, you can join the growing number of companies driving sustainable growth through real-time analytics by connecting BigQuery from Google Cloud to GrowthLoop. Here’s how:
If you have customer data in BigQuery…
- Book a GrowthLoop + BigQuery demo customized to your use cases.
- Link your BigQuery tables and marketing and sales destinations to the GrowthLoop platform.
- Launch your first GrowthLoop audience in less than one week.
If you are getting started with BigQuery…
- Get a Data Strategy Session with a GrowthLoop Solutions Architect at no cost.
- Use our Quick Start Program to get started with BigQuery in 4 to 8 weeks.
- Launch your first GrowthLoop audience in less than one week thereafter.
GrowthLoop and Google: Better together
The key question for many marketers today is, “How do you best leverage all you know about your customers to drive more intelligent and effective marketing engagement?” When Mercari set out to answer this question in 2019, they applied an innovative BigQuery data strategy that leveraged machine learning models. However, they achieved remarkable marketing results because they were among the first companies to discover and apply GrowthLoop to enable the marketing team to launch audiences with a first party data platform directly connected to their datasets and predictions in BigQuery. This greatly accelerated the design-launch-measure feedback loop to generate repeatable growth in customer lifetime value.
The Built with BigQuery advantage for ISVs and Data Providers
Google is helping companies like GrowthLoop build innovative applications on Google’s data cloud with simplified access to technology, helpful and dedicated engineering support, and joint go-to-market programs through the Built with BigQuery initiative. Participating companies can:
- Accelerate product design and architecture through access to designated experts who can provide insight into key use cases, architectural patterns, and best practices.
- Amplify success with joint marketing programs to drive awareness, generate demand, and increase adoption.
BigQuery gives ISVs the advantage of a powerful, highly scalable data warehouse that’s integrated with Google Cloud’s open, secure, sustainable platform. And with a huge partner ecosystem and support for multi-cloud, open source tools and APIs, Google provides technology companies the portability and extensibility they need to avoid data lock-in.
Click here to learn more about Built with BigQuery.
We thank the Mercari, GrowthLoop and Google Cloud team members who collaborated on the blog:
Mercari: Masumi Nakamura, VP of Engineering
GrowthLoop: Julia Parker, Product Marketing Manager; Alex Cuevas, Head of Analytics
Google: Sujit Khasnis, Solutions Architect
More Relevant Stories for Your Company

This New Offering of Google Cloud Brings AI and Data Together!
Without AI, you’re not getting the most out of your data.Without data, you risk stale, out-of-date, suboptimal models. But most companies are still struggling with how to keep these highly interdependent technologies in sync and operationalize AI to take meaningful action from data. We’ve learned from Google’s years of experience

Next-Level Search: Discover the Game-Changing Capabilities of Enterprise Search on Gen App Builder
In our conversations with customers, few generative AI use cases have driven as much enthusiasm as generative search. Leaders at enterprises know the limits of traditional enterprise search, with queries producing a list of links based on pattern matching, and significant manual investigation required to find the more relevant answers. In generative

Google Unveils New Cloud Region in Delhi NCR to Power India’s Digitization
In the past year, Google has worked to surface timely and reliable health information, amplify public health campaigns, and help nonprofits get urgent support to Indians in need. Now, we are continuing to focus on helping India’s businesses accelerate their digital transformation, deepening our commitment to India’s digitization and economic recovery.

How Domino’s Increased Monthly Revenue By 6% with Google Marketing Platform
Pizza purveyor Domino’s is dominating delivery sales around the world. Today, Domino’s is the most popular pizza delivery chain operating in the U.K., the Republic of Ireland, Germany, and Switzerland — and sales just keep growing. In these regions in 2014, Domino’s sold 76 million pizzas and generated £766.6 million
