





Cloud Bigtable brings database stability and performance to Precognitive

5728
Of your peers have already read this article.
3:40 Minutes
The most insightful time you'll spend today!
At Precognitive, we were able to start with a blank technology slate to support our fraud detection software products. When we started building the initial version of our platform in 2017, we had some decisions to make: What coding language to use? What cloud infrastructure provider to choose? What database to use? The majority of the decisions were straightforward, but we struggled to decide upon a database. We had plenty of collective experience with relational databases, but not with a wide-column database like Cloud Bigtable—which we knew we’d need to scale our behavior and device workloads. At launch, our products were supported by a self-managed database, but we quickly migrated to Cloud Bigtable, and we love it.
To efficiently support our bursty, real-time fraud detection workloads, we needed a cloud database that could satisfy the following key requirements:
- Stability to keep up with increased adoption of our products
- Intelligent scaling that avoids bottlenecks
- Native integrations with BigQuery and Cloud Dataproc
- Managed services that free up our engineers’ time to work on our products
Adding Cloud Bigtable as our performance database
As we scaled our services and added customers, our data collection services for our Device Intelligence and Behavioral Analytics products were seeing thousands of events per second. Cloud Bigtable provided a stable managed database that could handle the volume we were receiving during peak hours. We weren’t always able to handle this scale, as an early version of our product utilized a self-managed database.
Every month, two or three engineers spent hours managing the database instances. Whenever the instances crashed, it would cost at least one engineer a day or two of productivity attempting to restore the instances and recovering any data from our backup database. Managing this database internally was taking precious time away from product development.
We circled back to Cloud Bigtable. After two weeks of R&D, we decided to switch the Device Intelligence and Behavioral Analytics services to Cloud Bigtable.
Cloud Bigtable solved our scaling issues. Cloud Bigtable had been attractive to us from the start because it was fully managed, and offered regional replication and other features we were lacking in our own managed instances. Cloud Bigtable provides horizontal scaling and automatically rebalances row keys (equivalent to a shard key) over time to prevent “hot” nodes. In addition, Cloud Bigtable provides a connector to BigQuery and Cloud Dataproc that allows us to analyze the terabytes of data we are processing and use that data for unsupervised machine learning.
The perks of using Cloud Bigtable
After the migration to Cloud Bigtable, we noticed a number of additional benefits: improved I/O performance, a significant cost reduction, and a sizable decrease in hours spent on database maintenance.
We measured some of our typical metrics before and after implementing Cloud Bigtable. Our request latency dropped by about 30 ms on average (to sub-10 ms) for API requests. Prior to the change, we were seeing latencies of 40+ ms on average. This latency drop on our Behavioral Analytics and Device Intelligence products allowed us to trim about an additional 10 to 15 ms off our average response time across all dependent services.
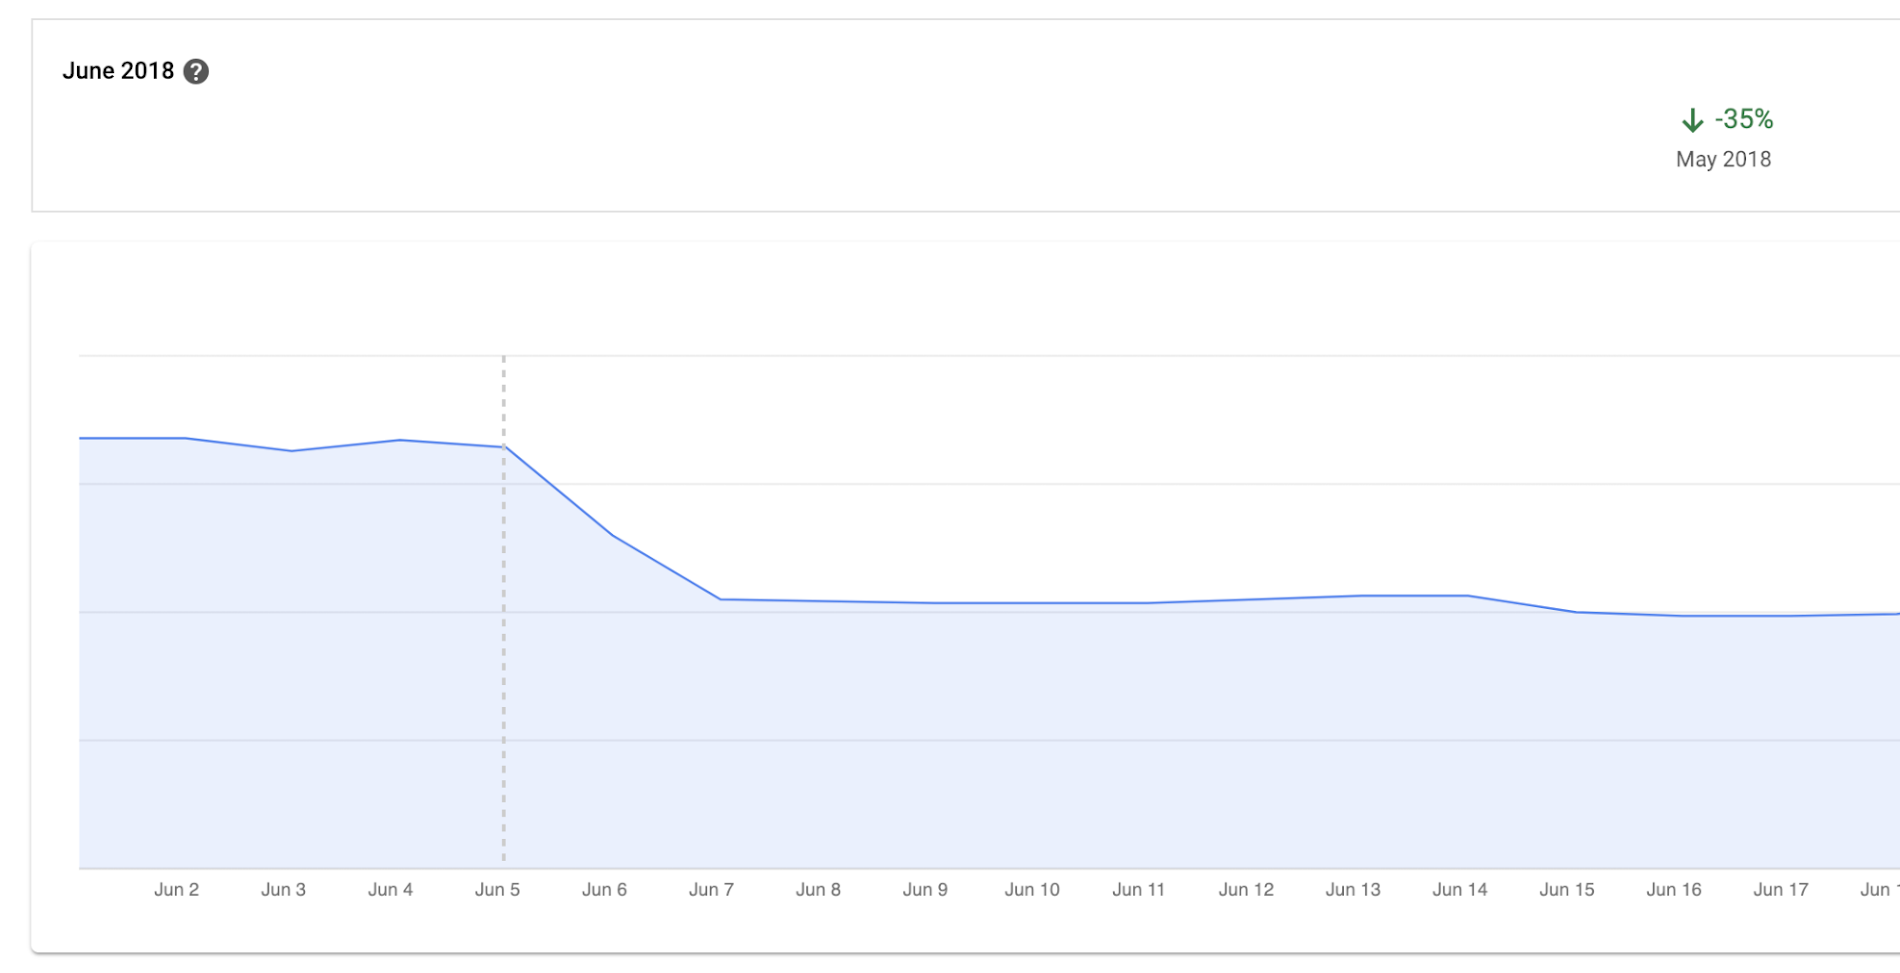
Before we moved to Cloud Bigtable, we had to scale our database instances every time a new customer was onboarded. We were over-scaling in an attempt to avoid constantly resizing our database servers. By sunsetting our self-managed database and switching to Cloud Bigtable, we cut database infrastructure costs by approximately 35% and can now scale as needed, with a couple of clicks, during onboarding.
We have spent zero hours managing a Cloud Bigtable database since launch, and we put the time we are saving every month toward product development.
Moving forward with Cloud Bigtable
As an engineering team, we love working with Cloud Bigtable. We are not only seeing improved developer experience and reduced latency, which keeps the engineers happy, but also reduced costs, which keeps the business happy. We’re able to build more product, too, with the time we’ve saved by switching to Cloud Bigtable. Stay tuned to our engineering blog for more on the lessons we’ve learned and our contributions to the wider Cloud Bigtable community.

AirAsia Turns to Google Cloud to refine Pricing, Increase Revenue, and Improve Customer Experience
DOWNLOAD CASE STUDY7138
Of your peers have already downloaded this article
1:30 Minutes
The most insightful time you'll spend today!
AirAsia needed a platform incorporating products that could capture, process, analyze, and report on data, while delivering value for money and meeting its speed and availability requirements. The airline also wanted to minimise infrastructure management and system administration demands on its technology team members.
The airline conducted a proof of concept and found Google Cloud Platform—including the Google BigQuery analytics data warehouse—was the best fit.
AirAsia was impressed by the ease and flexibility with which it could extract, transform, and load customer data from its systems, websites, and mobile applications into Google BigQuery for analysis. Reporting and dashboards were quickly and effectively delivered through Google Data Studio.
“With a minimal number of people involved, we can very quickly transform an idea or thought process into a deliverable. Prior to Google Cloud Platform, bringing those ideas to fruition would have been impossible,” says Nikunj Shanti, Chief Data and Digital Officer, AirAsia.

Google Leads the Database-as-a-Service Market: Forrester Research
DOWNLOAD RESEARCH REPORTS5491
Of your peers have already downloaded this article
3:00 Minutes
The most insightful time you'll spend today!
Database-as-a-service (DBaaS) has become critical for all businesses to build and support modern business applications and operational systems. It is changing the way companies build and support business applications and operational systems. With DBaaS, organizations can provision a relational or non-relational database of any size in minutes, without needing any technical expertise.
For app developers, it offers a database platform to build simple to sophisticated applications quickly, allowing them to focus on application logic rather than deal with database administration challenges. DBaaS automates the provisioning, administration, backup, recovery, availability, security, and scalability of the database without the need for a database administrator (DBA).
In addition, DBaaS helps enterprises migrate from their on-premises databases to the cloud to save money, support elastic scale, and deliver higher performance for expanding workloads.
Analyst firm Forrester Research in its recent report on the Database-as-a-Service market has named Google Cloud a leader in this space as it supports a broader set of use cases, automation, high-end scalability and performance, and security.
Download this Forrester Research report to understand why enterprises are turning to DBaaS and why Google Cloud is a leader in this space.
An AI-Powered Cost Cutting Guide: 8 Strategies for Maximizing Profits

1720
Of your peers have already read this article.
3:30 Minutes
The most insightful time you'll spend today!
We are increasingly seeing one question arise in virtually every customer conversation: How can the organization save costs and drive new revenue streams?
Everyone would love a crystal ball, but what you may not realize is that you already have one. It’s in your data. By leveraging Data Cloud and AI solutions, you can put your data to work to achieve your financial objectives. Combining your data and AI reveals opportunities for your business to reduce expenses and increase profitability, which is especially valuable in an uncertain economy.
Google Cloud customers globally are succeeding in this effort, across industries and geographies. They are improving ROI by saving money and creating new revenue streams. We have distilled the strategies and actions they are implementing—along with customer examples and tips—in our eBook, “Make Data Work for You.” In it, you’ll find ways you can pare costs, increase profitability, and monetize your data.
Find money in your data
Our Google Cloud teams have identified eight strategies that successful organizations are pursuing to trim expenses and uncover new sources of revenue through intelligent use of data and AI. These use cases range from scaling small efficiencies in logistics to accelerating document-based workflows, monetizing data, and optimizing marketing spend.
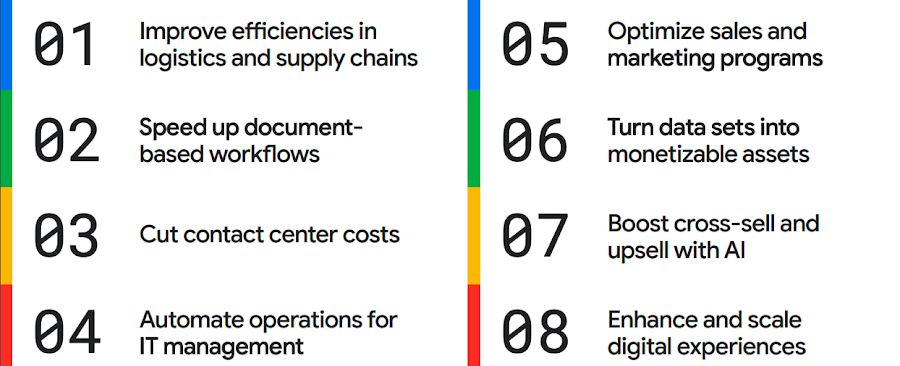
The results are impressive. They include massive cost savings and additional revenue. On-time deliveries have increased sharply at one company, and procure-to-pay processing costs have fallen by more than half at another. Other organizations have reaped big gains in ecommerce upselling and customer satisfaction.
We’ve found that businesses across every industry and around the globe are able to take action on at least one of these eight strategies. Contrary to common misperceptions, implementation does not require massive technology changes, crippling disruption to your business, or burdensome new investments.
What success looks like
If you worry your business is not ready or you need to gain buy-in from leadership, the success stories of the 15 companies in this report are helpful examples. Learning how organizations big and small, in different industries and parts of the world, have implemented these data and AI strategies makes the opportunities more tangible.
Carrefour
Among the world’s largest retailers, Carrefour operates supermarkets, ecommerce, and other store formats in more than 30 countries. To retain leadership in its markets, the company wanted to strengthen its omnichannel experience.
Carrefour moved to Google Data Cloud and developed a platform that gives its data scientists secure, structured access to a massive volume of data in minutes. This paved the way for smarter models of customer behavior and enabled a personalized recommendation engine for ecommerce services.
The company saw a 60% increase in ecommerce revenue during the pandemic, which it partly attributes to this personalization.
ATB Financial
ATB Financial, a bank in the Canadian province of Alberta, uses its data and AI to provide real-time personalized customer service, generating more than 20,000 AI-assisted conversations monthly. Machine learning models enable agents to offer clients real-time tailored advice and product suggestions.
Moreover, marketing campaigns and month-end processes that used to take five to eight hours now run in seconds, saving over CA$2.24 million a year.
Bank BRI
Bank BRI, which is owned by the Indonesian government, has 75.5 million clients. Through its use of digital technologies, the institution amasses a lot of valuable data about this large customer base.
Using Google Cloud, the bank packages this data through more than 50 monetized open APIs for more than 70 ecosystem partners who use it for credit scoring, risk management, and other applications. Fintechs, insurance companies, and financial institutions don’t have the talent or the financial resources to do quality credit scoring and fraud detection on their own, so they are turning to Bank BRI.
Early in the effort, the project generated an additional $50 million in revenue, showing how data can drive new sources of income.
How to get going now
“Make Data Work for You” will help you launch your financial resiliency initiatives by outlining the steps to get going. The process lays the groundwork for realizing your own cost savings and new revenue streams by leveraging data and AI.
Among these steps include building frameworks to operate cost efficiently, make informed decisions related to spending and optimize your data and AI budgets.
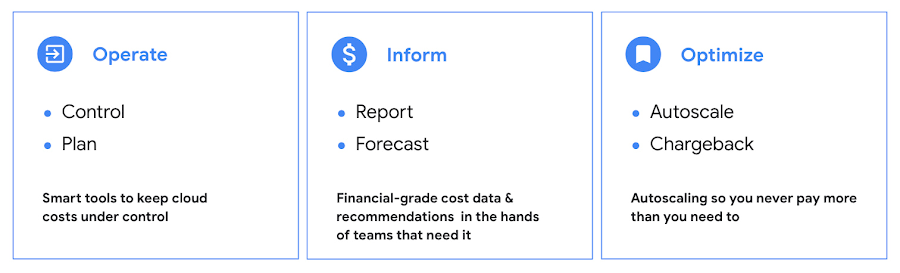
Operate: Billing that’s specific to your use-case
Control your costs by choosing data and analytics vendors who offer industry-leading data storage solutions and flexible pricing options. For example, multiple pricing options such as flat rate and pay-as-you-go allow you to optimize your spend for best price-performance.
Inform: make informed decisions based on usage
Use your cloud vendor’s dashboards or build a billing data report to gain insights on your spending over time. Make use of cost recommendations and other forecasting tools to predict what your future expenses are going to be.
Optimize: Never pay more than you use
While planning data analytics capacity, organizations often overprovision and overpay than what they actually use. Consider migrating your workloads that have unpredictable demand to a data warehousing solution that offers granular level autoscaling features so that you never have to pay for more than what you use.
There are other key moves that will set your initiative up for success including how to shorten time to value in building AI models and measuring impact. You can find details in the report.
A brighter future
The teams at Google Cloud helped the companies in “Make Data Work for You,” along with many more organizations, use their data and AI to achieve meaningful results. Download the full report to see how you can too.

3699
Of your peers have already downloaded this article
16:30 Minutes
The most insightful time you'll spend today!
Organizations today are being forced to make difficult decisions. Innovation has moved down the list for many companies, replaced with realities like making sure your business systems stay up and running during a disaster, managing unexpected shifts in demand,and above all, staying in business.
In the short term, this means looking for cost savings wherever possible, and making sure you’re up and running, no matter what circumstances come your way. In the longer term, it means identifying areas to reduce capital expenditures—including things like data center commitments, migration costs, and other overhead.
Google Cloud database solutions can help with both the short- and longer-term issues. Our solutions provide the opportunity to reduce the load that managing legacy applications is placing on your IT department and ensure you can manage unforeseen demand, all while making sure your databases are up and running, no matter what circumstances come your way.
In this whitepaper we’ll look in detail at some Google Cloud database solutions that can help you re-host, re-platform, or re-write your enterprise database with Google Cloud. You’ll see how we can help you plan for both the short- and long-term health of your Oracle workloads.
Recommendations for Modelling SAP Data inside BigQuery

8444
Of your peers have already read this article.
4:00 Minutes
The most insightful time you'll spend today!
Over the past few years, many organizations have experienced the benefits of migrating their SAP solutions to Google Cloud. But this migration can do more than reduce IT maintenance costs and make data more secure. By leveraging BigQuery, SAP customers can complement their SAP investments and gain fresh insights by consolidating enterprise data and easily extending it with powerful datasets and machine learning from Google.
BigQuery is a leading cloud data warehouse, fully managed and serverless, and allows for massive scale, supporting petabyte-scale queries at super-fast speeds. It can easily combine SAP data with additional data sources, such as Google Analytics or Salesforce, and its built-in machine learning lets users operationalize machine learning models using standard SQL — all at a comparatively low cost.
If your SAP-powered organization is looking to supercharge its analytics with the strength of BigQuery, read on for considerations and recommendations for modeling with SAP data. These guidelines are based on our real-world implementation experience with customers and can serve as a roadmap to the analytics capabilities your business needs.
Considerations for data replication
Like most technology journeys, this one should start with a business objective. Keeping your intended business value and goals in mind is critical to making the right decisions in the early steps of the design process.
When it comes to replicating the data from an SAP system into BigQuery, there are multiple ways to do it successfully. Decide which method will work best for your organization by answering these questions:
- Does your business need real-time data? Will you need to time travel into past data?
- Which external datasets will you need to join with the replicated data?
- Are the source structures or business logic likely to change? Will you be migrating the SAP source systems any time soon? For instance, will you be moving from SAP ECC to SAP S/4HANA?
You’ll also need to determine whether replication should be done on a table-by-table basis or whether your team can source from pre-built logic. This decision, along with other considerations such as licensing, will influence which replication tool you should use.
Replicating on a table-by-table basis
Replicating tables, especially standard tables in their raw form, allows sources to be reused and ensures more stability of the source structure and functional output. For example, the SAP table for sales order headers (VBAK) is very unlikely to change its structure across different versions of SAP, and the logic that writes to it is also unlikely to change in a way that affects a replicated table.
Something else to consider: Reconciliation between the source system and the landing table in BigQuery is linear when comparing raw tables, which helps avoid issues in consolidation exercises during critical business processes, such as period-end closing. Since replicated tables aren’t aggregated or subject to process-specific data transformation, the same replicated columns can be reused in different BigQuery views. You can, for instance, replicate the MARA table (the material master) once and use it in as many models as needed.
Replicating pre-built logic
If you replicate pre-built models, such as those from SAP extractors or CDS views, you don’t need to build the logic in BigQuery, since you’re using existing logic. Some of these extraction objects have embedded delta mechanisms, which may complement a replication tool that can’t handle deltas. This will save initial development time, but it can also lead to challenges if you create new columns, or if customizations or upgrades change the logic behind the extraction.
It’s also important to note that different extraction processes may transform and load the same source columns multiple times, which creates redundancy in BigQuery and can lead to higher maintenance needs and costs. However, replicating pre-built models may still be a good choice, since doing so can be especially useful for logic that tends to be immutable, such as flattening a hierarchy, or logic that is highly complex.
How you approach replication will also depend on your long-term plans and other key factors — for example, the availability (and curiosity) of your developers, and the time or effort they can put into applying their SQL knowledge to a new data warehouse.
With either replication approach, bear in mind when designing your replication process that BigQuery is meant to be an append-always database — so post-processing of data and changes will be required in both cases.
Processing data changes
The replication tool you choose will also determine how data changes are captured (known as CDC – change data capture). If the replication tool allows for it (for example as SAP SLT does) the same patterns described in the CDC with BigQuery documentation also apply to SAP data.
Because some data, like transactions, are known to be less static than others (e.g., master data), you need to decide what should be scanned in real time, what will require immediate consistency, and what can be processed in batches to manage costs. This decision will be based on the reporting needs from the business.
Consider the SAP table BUT000, containing our example master data for business partners, where we have replicated changes from an SAP ERP system:
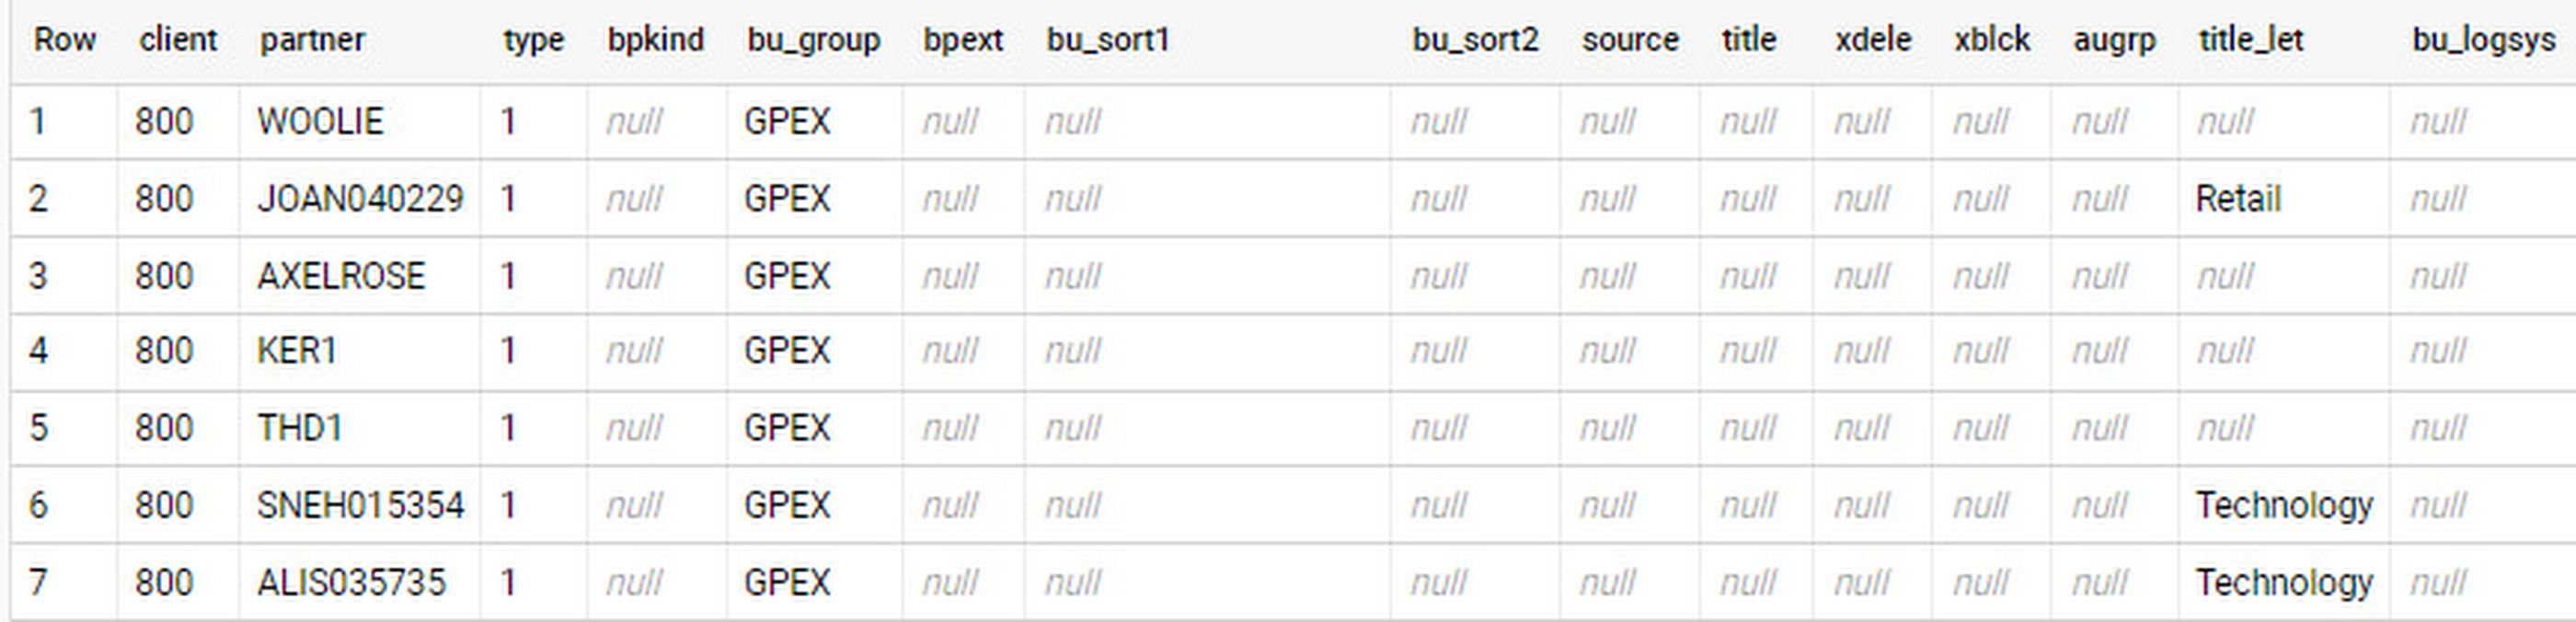
In an append-always replication in BigQuery, all updates are received as new records. For example, deleting a record in the source will be represented as a new record in BigQuery with a deletion flag. This applies to whether the records are coming from raw tables like BUT000 itself or pre-aggregated data, as from a BW extractor or a CDS view.
Let’s take a closer look at data coming particularly from the partners “LUCIA” and “RIZ”. The operation flag tells us whether the new record in BigQuery is an insert (I), update (U) or deletion (D), while the timestamps help us identify the latest version of our business partner.
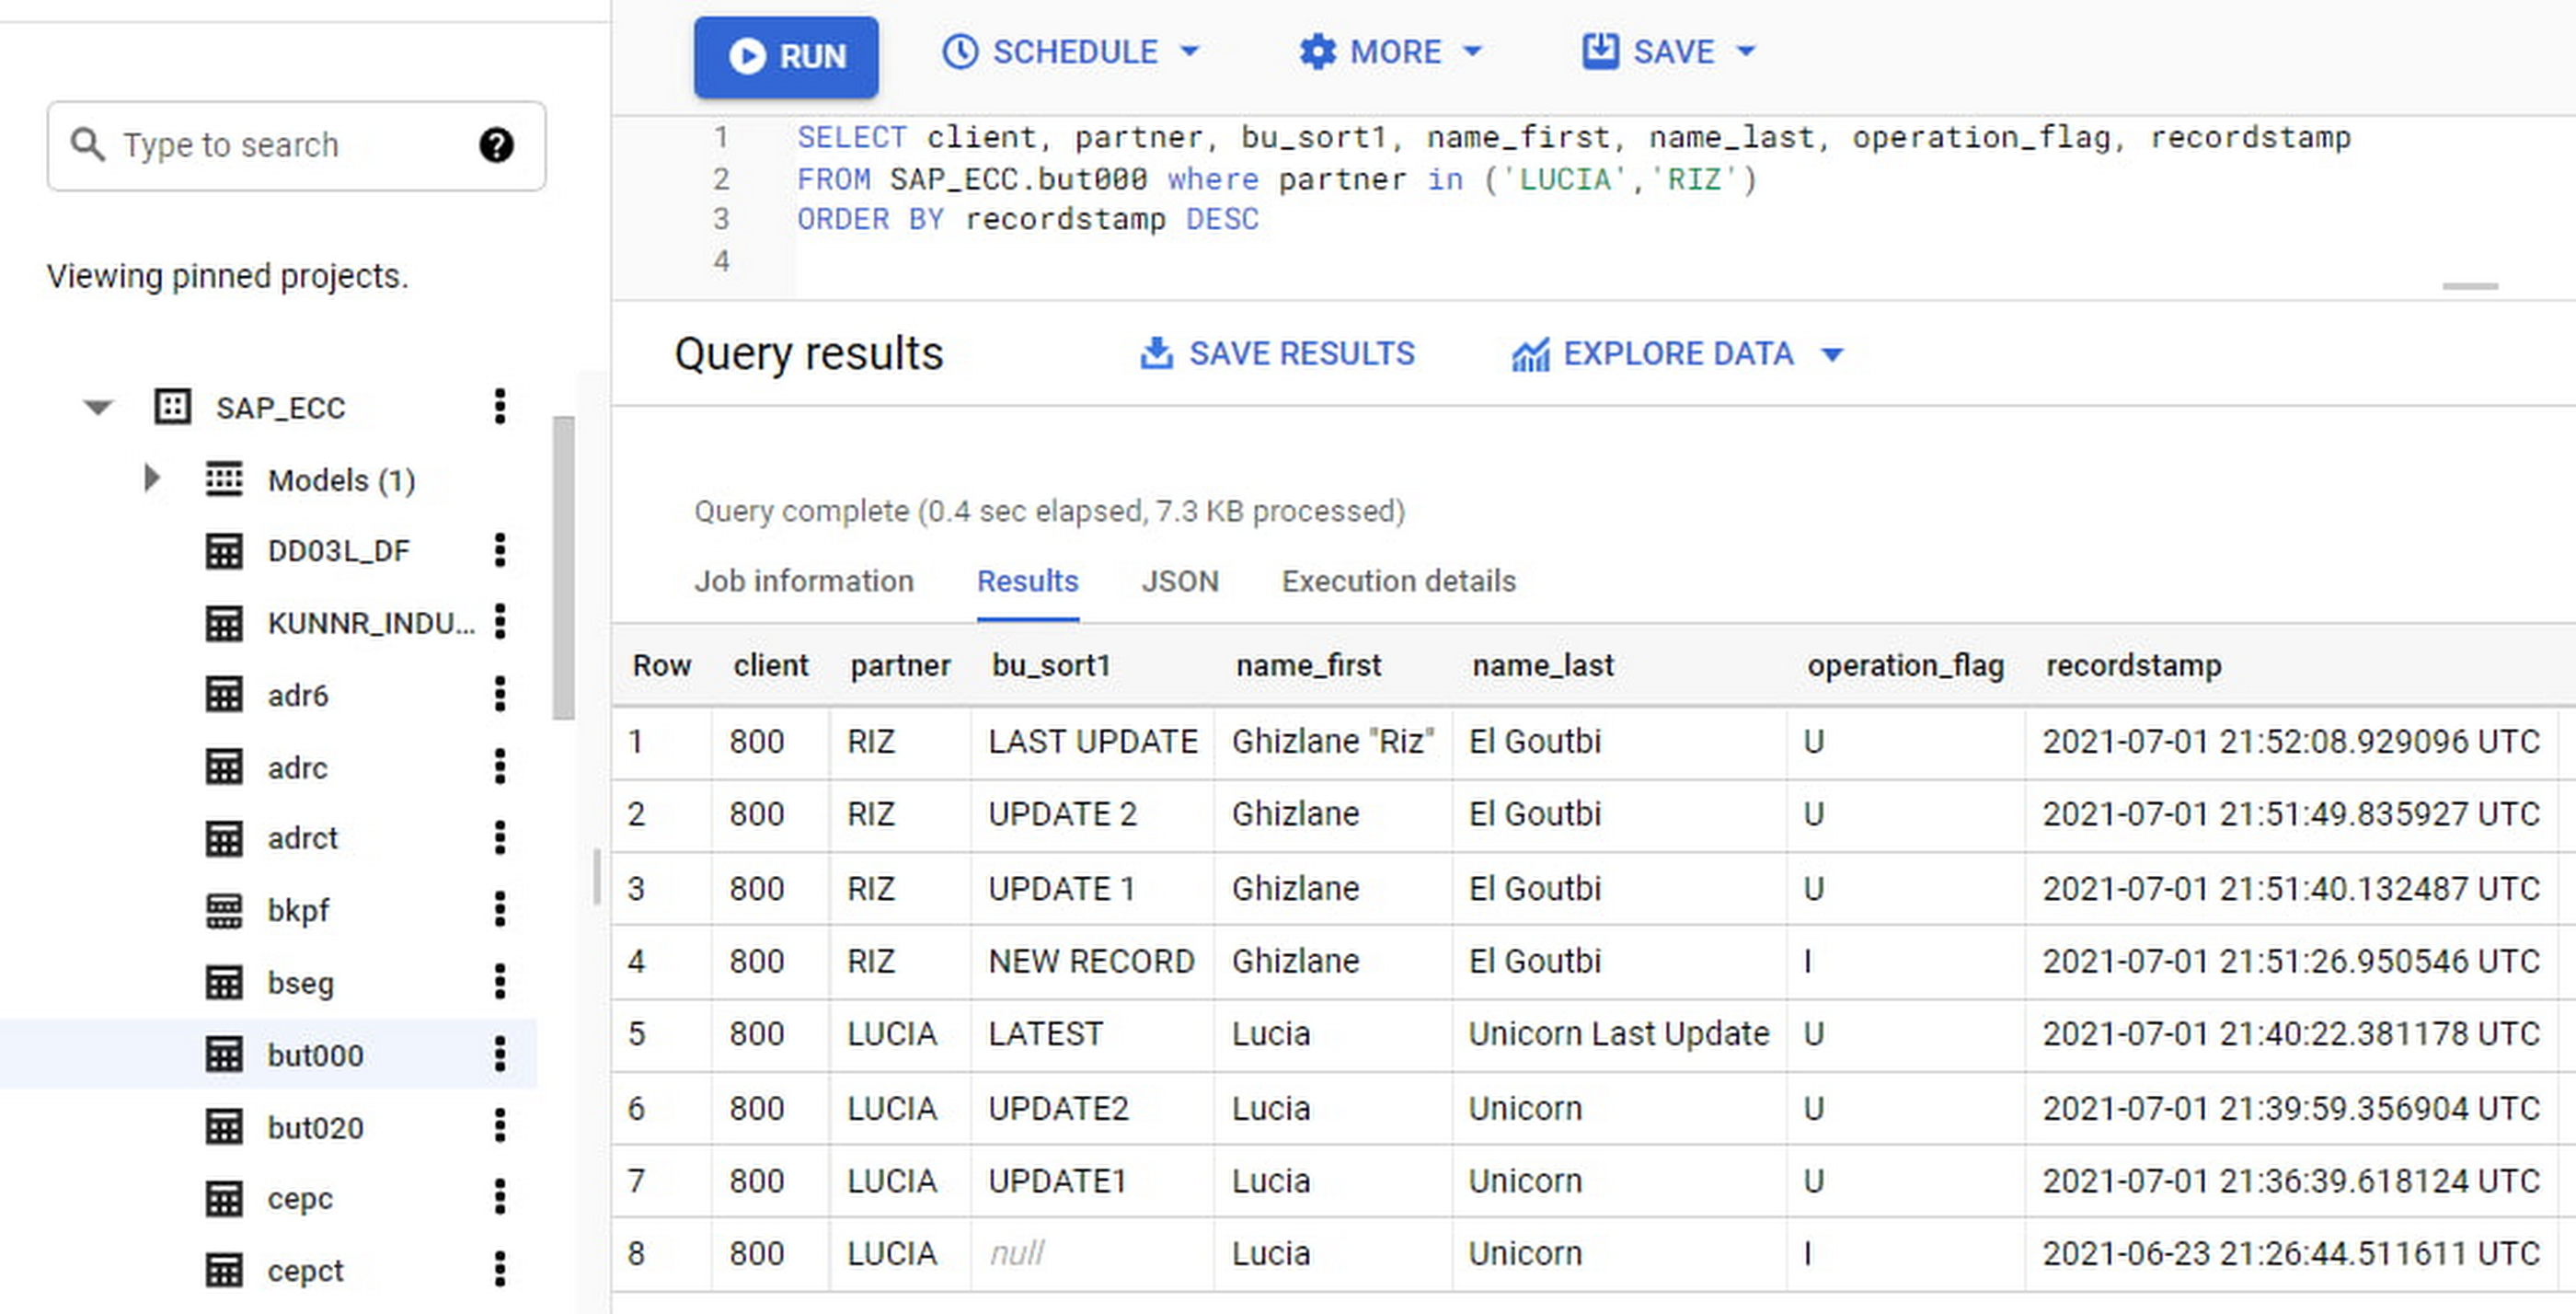
If we want to find the latest updated record for the partners LUCIA and RIZ, this is what the query would look like:
SELECT partner,ARRAY_AGG(i1 ORDER BY i1.recordstamp DESC LIMIT 1) AS rowFROM SAP_ECC.but000 i1WHERE partner in ('LUCIA','RIZ')GROUP BY partner
With the following result:
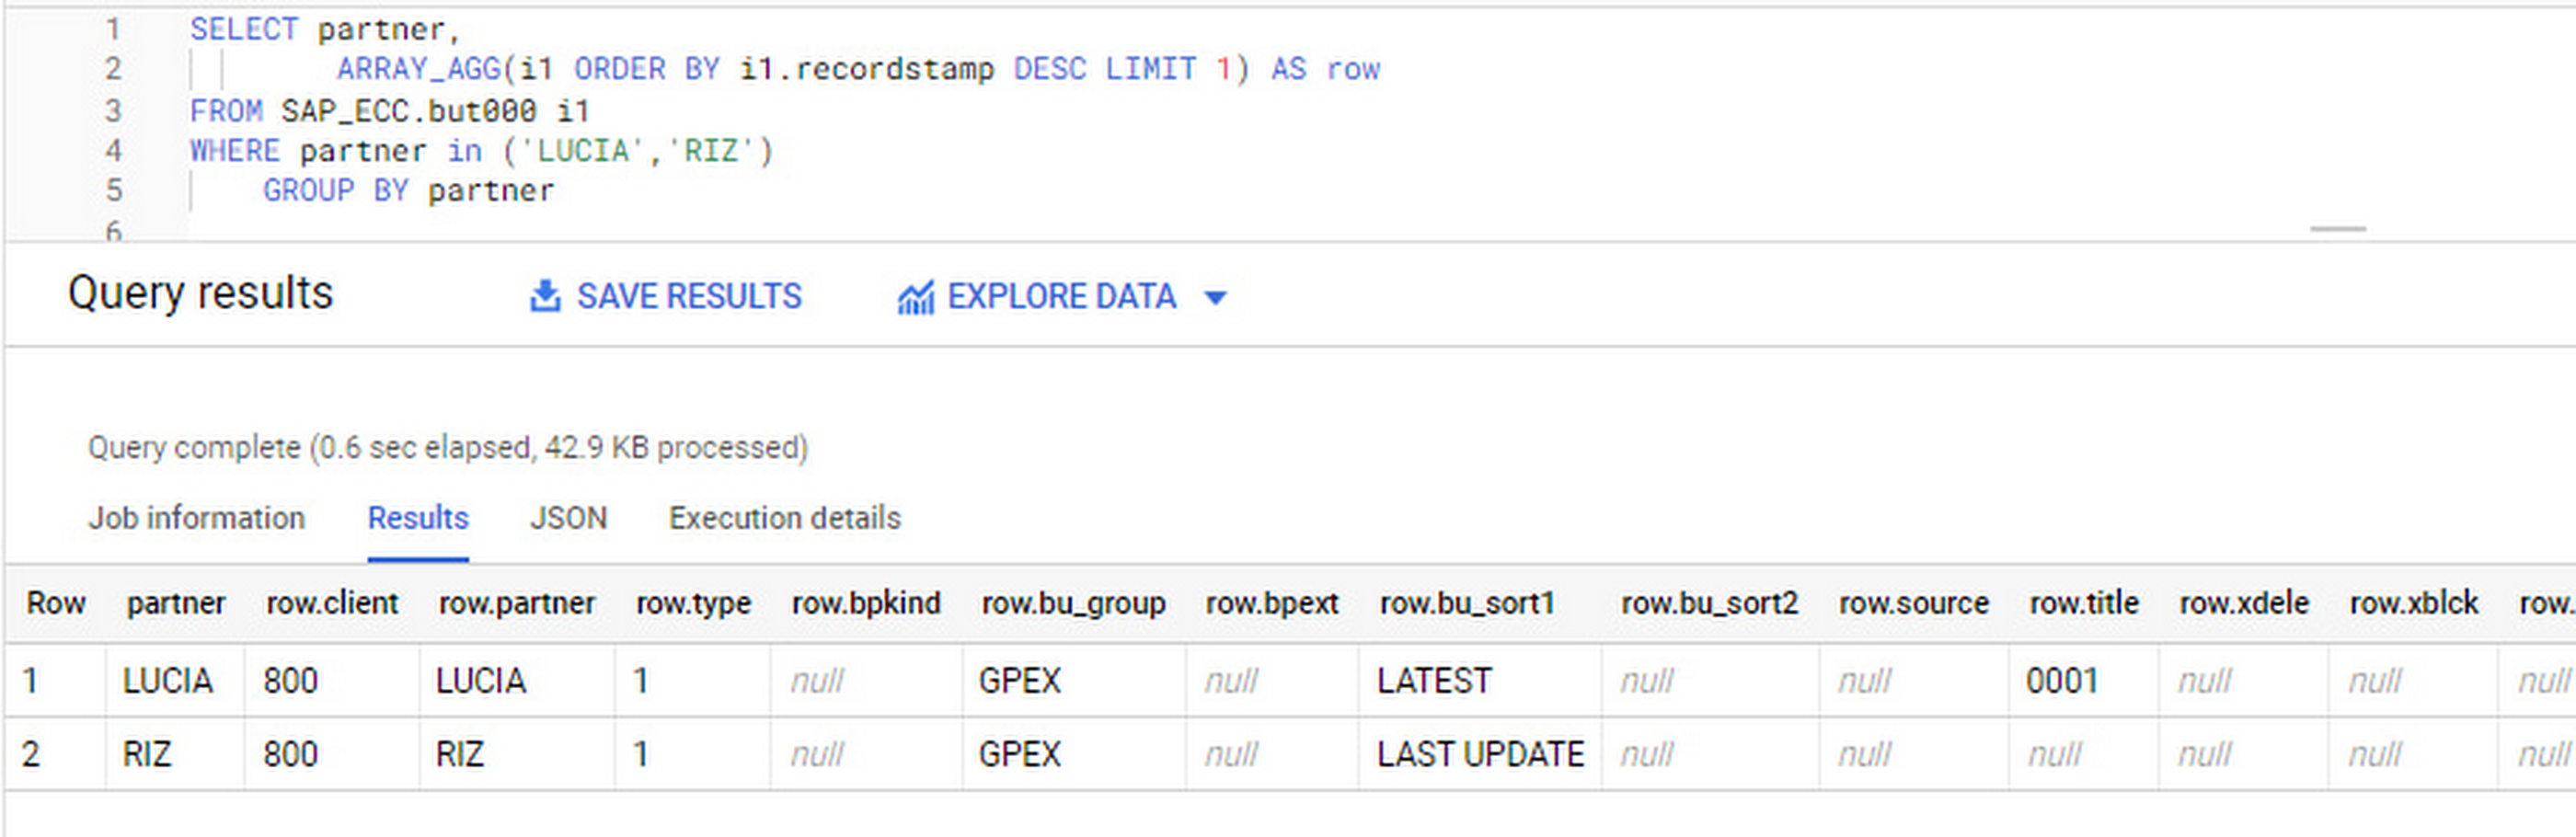
After identifying stale records for “LUCIA” and “RIZ” business partners, we can proceed to deleting all stale records for “LUCIA” if we do not want to retain the history. In this example, we are using a different table to which the same replication has been done, for the purpose of comparison and to check that all stale records have been deleted for the selection made and that we only kept last updated records. For example:
DELETE SAP_HANA.but000 i1WHEREi1.recordstamp < TIMESTAMP_SUB(CURRENT_TIMESTAMP(), INTERVAL 3 HOUR) ANDi1.recordstamp < (SELECT MAX(recordstamp) FROM SAP_HANA.but000 i2WHEREi1.partner = i2.partnerand partner="LUCIA")
You can also use the following query to retrieve stale records for “LUCIA” partner before moving forward with deletion
SELECT partner, operation_flag, recordstamp FROM SAP_HANA.but000 i1WHEREi1.recordstamp < TIMESTAMP_SUB(CURRENT_TIMESTAMP(), INTERVAL 3 HOUR)ANDi1.recordstamp < (SELECT MAX(recordstamp) FROM SAP_HANA.but000 i2WHEREi1.partner = i2.partnerand partner="LUCIA")
Which produces all of the records, except the latest update:

Partitioning and clustering
To limit the number of records scanned in a query, save on cost and achieve the best performance possible, you’ll need to take two important steps: determine partitions and create clusters.
Partitioning
A partitioned table is one that’s divided into segments, called partitions, which make it easier to manage and query your data. Dividing a large table into smaller partitions improves query performance and controls costs because it reduces the number of bytes read by a query.
You can partition BigQuery tables by:
- Time-unit column: Tables are partitioned based on a “timestamp,” “date,” or “datetime” column in the table.
- Ingestion time: Tables are partitioned based on the timestamp recorded when BigQuery ingested the data.
- Integer range: Tables are partitioned based on an integer column.
Partitions are enabled when the table is created, as in the example below. A great tip is to always include the partition filter as shown on the left-hand side of the query.

Clustering
Clustering can be created on top of partitioned tables by applying the fields that are likely to be used for filtering. When you create a clustered table in BigQuery, the table data is automatically organized based on the contents of one or more of the columns in the table’s schema. The columns you specify are then used to colocate related data.
Clustering can improve the performance of certain query types — for example, queries that use filter clauses or that aggregate data. It makes a lot of sense to use them for large tables such as ACDOCA, the table for accounting documents in SAP S/4HANA. In this case, the timestamp could be used for partitioning, and common filtering fields such as the ledger, company code, and fiscal year could be used to define the clusters.
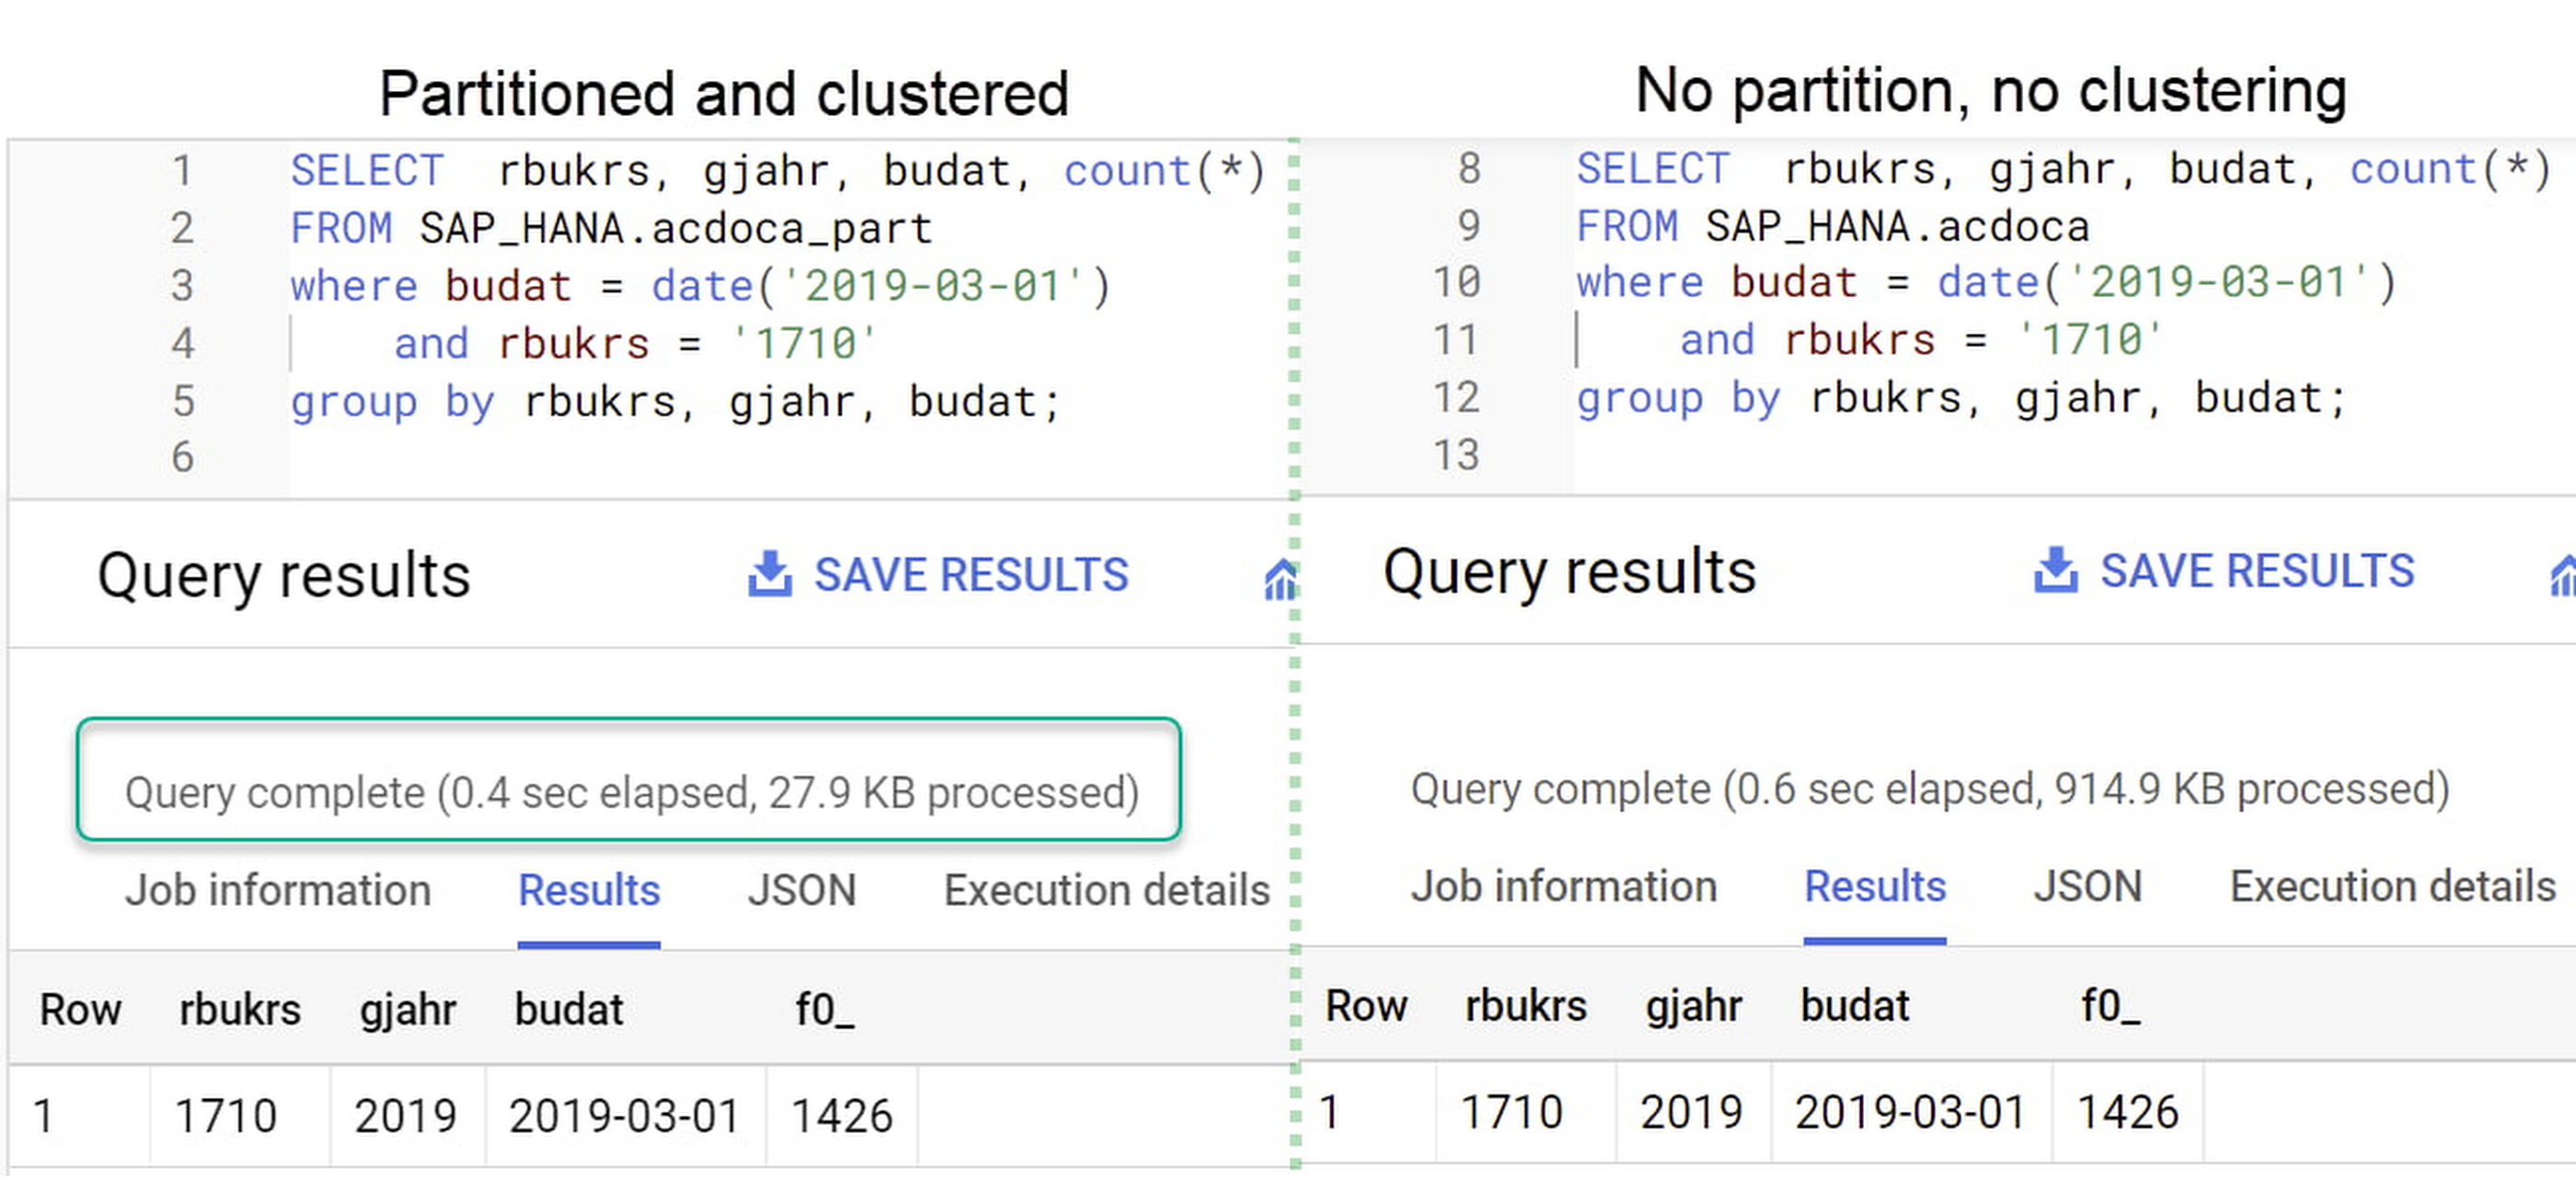
A great feature is that BigQuery will also periodically recluster the data automatically.
Materialized views
In BigQuery, materialized views are precomputed views that periodically cache the results of a query for better performance and efficiency. BigQuery uses precomputed results from materialized views and, whenever possible, reads only the delta changes from the base table to compute up-to-date results quickly. Materialized views can be queried directly or can be used by the BigQuery optimizer to process queries to the base table.
Queries that use materialized views are generally completed faster and consume fewer resources than queries that retrieve the same data only from the base table. If workload performance is an issue, materialized views can significantly improve the performance of workloads that have common and repeated queries. While materialized views currently only support single tables, they are very useful common and frequent aggregations like stock levels or order fulfillment.
Further tips on performance optimization while creating select statements can be found in the documentation for optimizing query computation.
Deployment pipeline and security
For most of the work you’ll do in BigQuery, you’ll normally have at least two delivery pipelines running — one for the actual objects in BigQuery and the other to keep the data staging, transforming, and updated as intended within the change-data-capture flows. Note that you can use most existing tools for your Continuous Integration / Continuous Deployment (CI/CD) pipeline — one of the benefits of using an open system like BigQuery. But, if your organization is new to CI/CD pipelines, this is a great opportunity to gradually gain experience. A good place to start is to read our guide for setting up a CI/CD pipeline for your data-processing workflow.
When it comes to access and security, most end-users will only have access to the final version of the BigQuery views. While row and column-level security can be applied, as in the SAP source system, separation of concerns can be taken to the next level by splitting your data across different Google Cloud projects and BigQuery datasets. While it’s easy to replicate data and structures across your datasets, it’s a good idea to define the requirements and naming conventions early in the design process so you set it up properly from the start.
Start driving faster and more insightful analytics
The best piece of advice we can give you is this: Try it yourself. Anyone with SQL knowledge can get started using the free BigQuery tier. New customers get $300 in free credits to spend on Google Cloud during the first 90 days. All customers get 10 GB storage and up to 1 TB queries/month, completely free of charge. In addition to discovering the massive processing capabilities, embedded machine learning, multiple integration tools, and cost benefits, you’ll soon discover how BigQuery can simplify your analytics tasks.
If you need additional assistance, our Google Cloud Professional Services Organization (PSO) and Customer Engineers will be happy to help show you the best path forward for your organization. For anything else, contact us at cloud.google.com/contact.
More Relevant Stories for Your Company

BURGER KING Germany: Serving Up Marketing Insights and Supply Chain Visibility Easily
Do hamburgers really come from Hamburg? This may still be a matter of debate, but the popularity of American-style burger joints not just in Hamburg but all over Germany, is clear. Germany’s top two fast food companies are both burger chains. One of them is BURGER KING®, a global brand that welcomes more
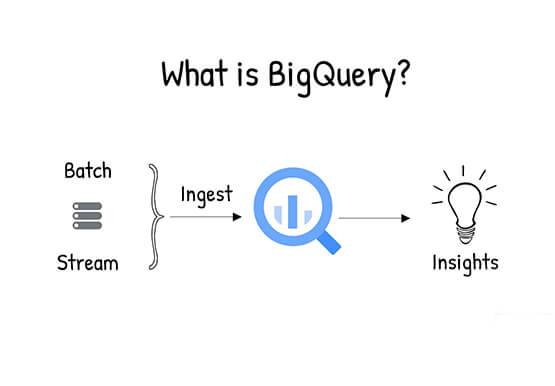
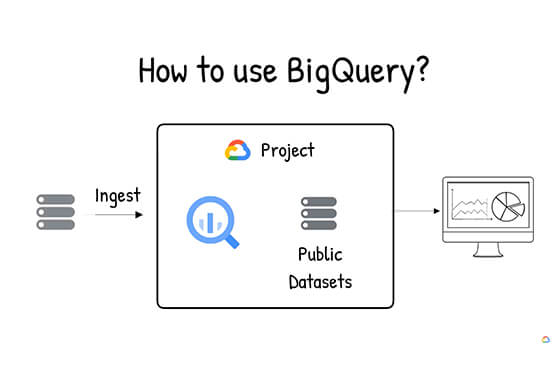

What is BigQuery?
BigQuery is Google Cloud's enterprise data warehouse designed to help you ingest, store, analyze, and visualize big data with ease. Organizations rely on data warehouses to aggregate data from disparate sources, process it, and make it readily available for data analysis that supports their strategic decision-making. You can ingest data

PaGaLGuY Turns to Google Cloud Platform to Power Leading India Education Network
Founded in 2006, PaGaLGuY started as a forum that enabled students, typically aged between 20 and 30 to discuss and seek advice on academic issues. By 2011, PaGaLGuY had increased its traffic to about 250,000 page views per month. The business is now one of India’s largest education networks and



Uber’s Story of Scaling Their App with Millions of Concurrent Requests
Uber has millions of concurrent customers who use the platform to book rides and place food delivery orders, generating billions of database transactions per day. In just a click of a button, Uber captures users' intent which bases their fulfillment model to meet the customers' demand, and match it to
