





Canadian Bank’s SAP Workload Moved to BigQuery Helps Unlock New Business Opportunities

7356
Of your peers have already read this article.
2:00 Minutes
The most insightful time you'll spend today!
When ATB Financial decided to migrate its vast SAP landscape to the cloud, the primary goal was to focus on things that matter to customers as opposed to IT infrastructure. Based in Alberta, Canada, ATB Financial serves over 800,000 customers through hundreds of branches as well as digital banking options. To keep pace with competition from large banks and FinTech startups and to meet the increasing 24/7 demands of customers, digital transformation was a must. To support this new mandate, in 2019, ATB migrated its extensive SAP backbone to Google Cloud. In addition to SAP S/4 HANA, ATB runs SAP financial services, core banking, payment engine, CRM and business warehouse on Google Cloud.
In parallel, changes were needed to ATB’s legacy data platform. The platform had stability and reliability issues and also suffered from a lack of historical data governance. Analytics processes were ad hoc and manual. The legacy data environment was also not set up to tackle future business requirements that come with a high dependency on real-time data analysis and insights.
After evaluating several potential solutions, ATB chose BigQuery as a serverless data warehouse and data lake for its next-generation, cloud-native architecture. “BigQuery is a core component of what we call our data exposure enablement platform, or DEEP,” explains Dan Semmens, Head of Data and AI at ATB Financial. According to Semmens, DEEP consists of four pillars, all of which depend on Google Cloud and BigQuery to be successful:
- Real-time data acquisition: ATB uses BigQuery throughout its data pipeline, starting with sourcing, processing, and preparation, moving along to storage and organization, then discovery and access, and finally consumption and servicing. So far, ATB has ingested and classified 80% of its core SAP banking data as well as data from a number of its third-party partners, such as its treasury and cash management platform provider, its credit card provider, and its call center software.
- Data enrichment: Before migrating to Google Cloud, ATB managed a number of disconnected technologies that made data consolidation difficult. The legacy environment could handle only structured data, whereas Google Cloud and BigQuery lets the bank incorporate unstructured data sets, including sensor data, social network activity, voice, text, and images. ATB’s data enrichment program has enabled more than 160 of the bank’s top-priority insights running on BigQuery, including credit health decision models, financial reporting, and forecasting, as well as operational reporting for departments across the organization. Jobs such as marketing campaigns and month-end processes that used to take five to eight hours now run in seconds, saving over CA$2.24 million in productivity.
- Self-service analytics: Data for self-service reporting, dashboarding, and visualization is now available for ATB’s 400+ business users and data analysts. Previously, bringing data and analytics to the business users who needed it while ensuring security was burdensome for IT, fraught with recurrent data preparation and other highly manual elements. Now, ATB automates much of its data protection and governance controls through the entire data lifecycle management process. Data access is not only open to more team members but it is faster and easier to acquire without compromising security. And it’s not just raw data that users can access. ATB uses BigQuery to define its enterprise data models and create what it calls its data service layer to make it easier for team members to visualize their data.
- AI-assisted analytics and automation: Through Google Cloud and BigQuery, ATB has been able to publish data and ML models that provide alerts and notifications via APIs to customer service agents. These real-time recommendations allow customer service agents to provide more tailored service with contextualized advice and suggested new services. So far, the company has deployed more than 40 ML models to generate over 20,000 AI-assisted conversations per month. Thanks to improved customer advocacy and less churn, the bank has realized more than CA$4 million in operating revenue. During the ongoing COVID crisis, the system was also able to predict when business and personal banking customers were experiencing financial distress so that a relationship manager could proactively reach out to offer support, such as payment deferral or loan restructuring. The AI tools provided by BigQuery are also helping ATB detect fraud that previously evaded rules-based fraud detection by using broader sets of timely and accurate data.
Thanks to the speed and ease of moving data from SAP to BigQuery, ATB is using artificial intelligence (AI) and machine learning (ML) to do things it previously hadn’t thought possible, including sophisticated fraud prevention models, product recommendations, and enriched CRM data that improves the customer experience.
Using the power of Google Cloud and BigQuery, ATB Financial has been able to draw more value from its SAP data while lowering cost and improving security and reliability. Speed to provide data sets and insights to internal team members has improved 30%. The bank also has seen a 15x reduction in performance incidents while improving data governance and security. Dan Semmens projects that the digital transformation strategy built on Google Cloud and BigQuery has both saved millions compared to its on-premises environment and has also realized millions in new business opportunities.
Semmens is looking toward the future that includes initiatives like Open Banking and greater ability to provide real time personalized advice for customers to drive revenue growth. “We see our data platform as foundational to ATB’s 10-year strategy,” he says. “The work we’ve undertaken over the past 18 months has enabled critical functionality for that future.”
Learn more about how ATB Financial is leveraging BigQuery to gain more from SAP data. Visit us here to explore how Google Cloud, BigQuery, and other tools can unlock the full value of your SAP enterprise data.
This New Offering of Google Cloud Brings AI and Data Together!

2962
Of your peers have already read this article.
5:00 Minutes
The most insightful time you'll spend today!
Without AI, you’re not getting the most out of your data.
Without data, you risk stale, out-of-date, suboptimal models.
But most companies are still struggling with how to keep these highly interdependent technologies in sync and operationalize AI to take meaningful action from data.
We’ve learned from Google’s years of experience in AI development how to make data-to-AI workflows as cohesive as possible and as a result our data cloud is the most complete and unified data and AI solution provider in the market. By bridging data and AI, data analysts can take advantage of user-friendly, accessible ML tools, and data scientists can get the most out of their organization’s data. All of this comes together with built-in MLOps to ensure all AI work — across teams — is ready for production use.
In this blog we’ll show you how all of this works, including exciting announcements from the Data Cloud Summit:
Vertex AI Workbench is now GA bringing together Google Cloud’s data and ML systems into a single interface so that teams have a common toolset across data analytics, data science, and machine learning. With native integrations across BigQuery, Spark, Dataproc, and Dataplex data scientists can build, train and deploy ML models 5X faster than traditional notebooks.
Introducing Vertex AI Model Registry, a central repository to manage and govern the lifecycle of your ML models. Designed to work with any type of model and deployment target, including BigQuery ML, Vertex AI Model Registry makes it easy to manage and deploy models.
Use ML to get the most out of your data, no matter the format
Analyzing structured data in a data warehouse, like using SQL in BigQuery, is the bread and butter for many data analysts. Once you have data in a database, you can see trends, generate reports, and get a better sense of your business. Unfortunately, a lot of useful business data isn’t in the tidy tabular format of rows and columns. It’s often spread out over multiple locations and in different formats, frequently as so-called “unstructured data” — images, videos, audio transcripts, PDFs — can be cumbersome and difficult to work with.
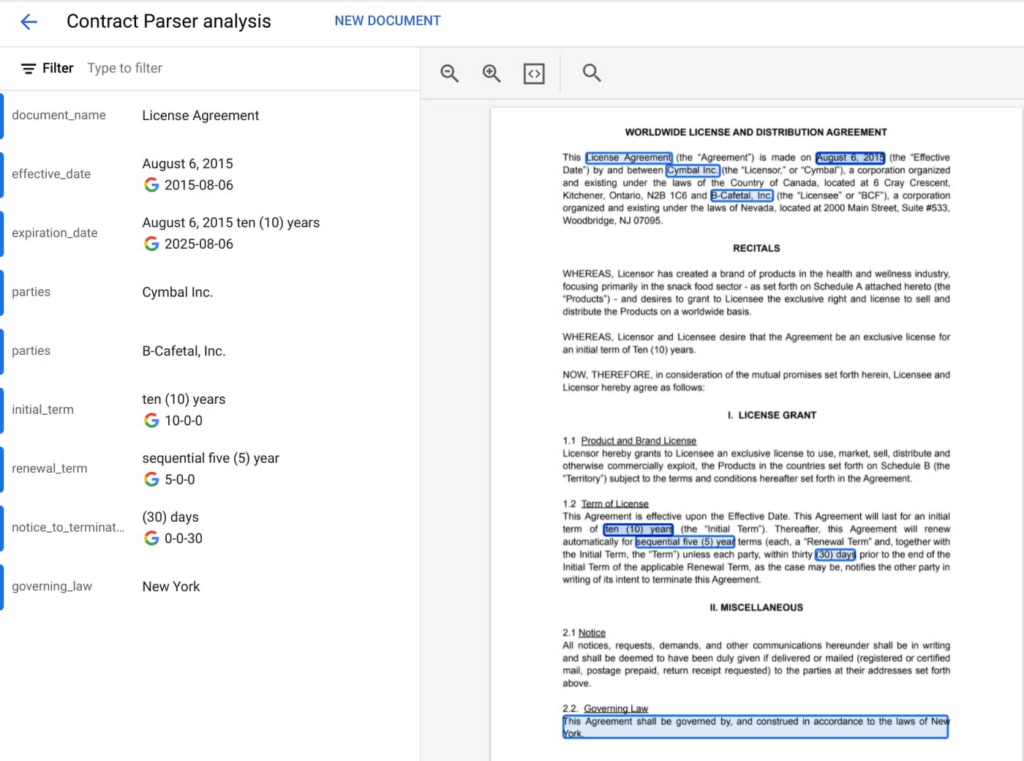
Here, AI can help. ML models can be used to transcribe audio and videos, analyze language, and extract text from images—that is, to translate elements of unstructured data into a form that can be stored and queried in a database like BigQuery. Google Cloud’s Document AI platform, for example, uses ML to understand documents like forms and contracts. Below, you can see how this platform is able to intelligently extract structured text data from an unstructured document like a resume. Once this data is extracted, it can be stored in a data warehouse like BigQuery.
Bring machine learning to data analysts via familiar tools
Today, one of the biggest barriers to ML is that the tools and frameworks needed to do ML are new and unfamiliar. But this doesn’t have to be the case. BigQuery ML, for example, allows you to train sophisticated ML models at scale using SQL code, directly from within BigQuery. Bringing ML to your data warehouse alleviates the complexities of setting up additional infrastructure and writing model code. Anyone who can write SQL code can train a ML model quickly and easily.

Easily access data with a unified notebook interface
One of the most popular ML interfaces today are notebooks: interactive environments that allow you to write code, visualize and pre-process data, train models, and a whole lot more. Data scientists often spend most of their day building models within notebook environments. It’s crucial, then, that notebook environments have access to all of the data that makes your organization run, including tools that make that data easy to work with.
Vertex AI Workbench, now generally available, is the single development environment for the entire data science workflow. Integrations across Google Cloud’s data portfolio allow you to natively analyze your data without switching between services:
Cloud Storage: access unstructured data
BigQuery: access data with SQL, take advantage of models trained with BigQuery ML
Dataproc: execute your notebook using your Dataproc cluster for control
Spark: transform and prepare data with autoscaling serverless Spark
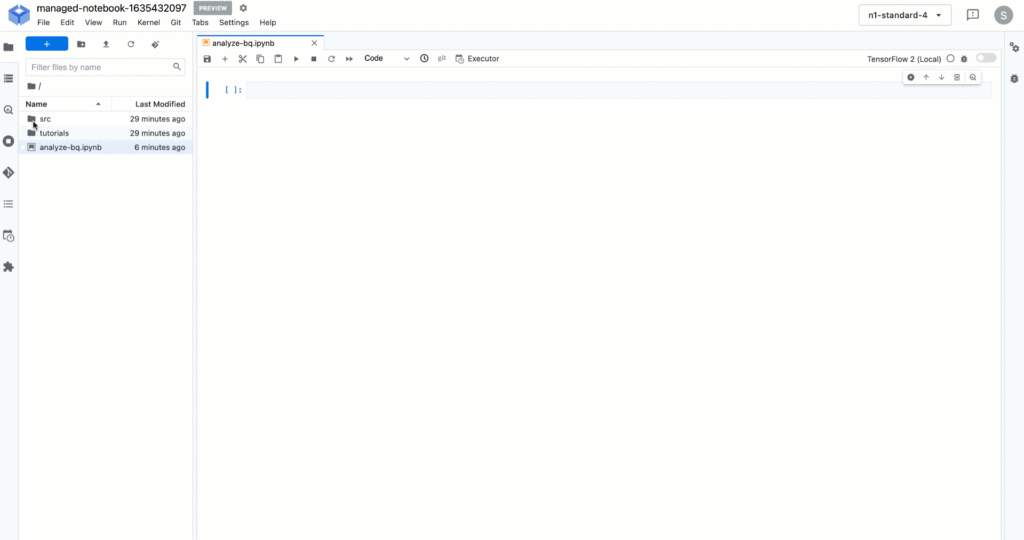
Below, you’ll see how you can easily run a SQL query on BigQuery data with Vertex AI Workbench.
But what happens after you’ve trained the model? How can both data analysts and data scientists make sure their models can be utilized by application developers and maintained over time?
Go from prototyping to production with MLOps
While training accurate models is important, getting those models to be scalable, resilient, and accurate in production is its own art, known as MLOps. MLOps allow you to:
- Know what data your models are trained on
- Monitor models in production
- Make training process repeatable
- Serve and scale model predictions
- A whole lot more! (See the “Practitioners Guide to MLOps” whitepaper for a full and detailed overview of MLOps)
Built-in MLOps tools within Vertex AI’s unified platform remove the complexity of model maintenance. Practical tools can help with everything from training and hosting ML models, managing model metadata, governance, model monitoring, and running pipelines – all critical aspects of running ML in production and at scale.
And now, we’re extending our capabilities to make MLOps accessible to anyone working with ML in your organization.
Easy handoff to MLOps with Vertex AI Model Registry
Today, we’re announcing Vertex AI Model Registry, a central repository that allows you to register, organize, track, and version trained ML models and is designed to work with any type of model and deployment target, whether that’s through BigQuery, Vertex AI, AutoML, custom deployments on GCP or even out of the cloud.
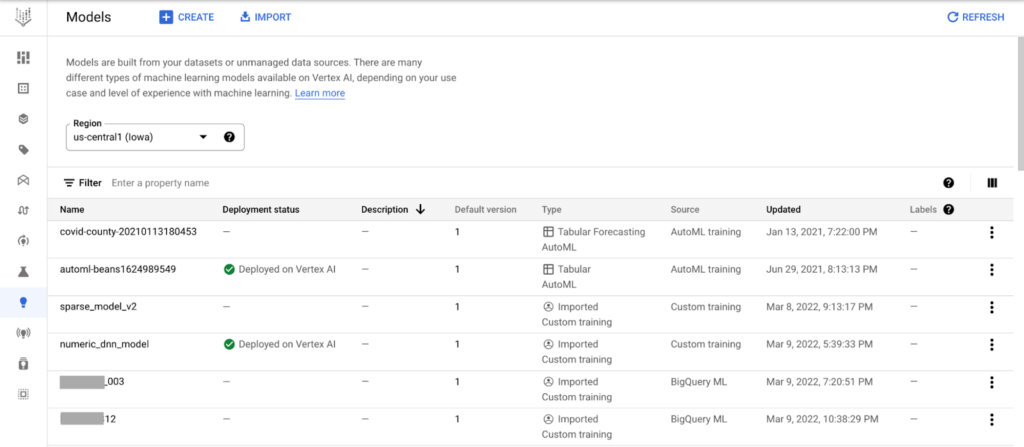
Vertex AI Model Registry is particularly beneficial for BigQuery ML. While BigQuery ML brings the powerful scalability of BigQuery for batch predictions, using a data warehouse engine for real-time predictions just isn’t practical. Furthermore, you might start to wonder how to orchestrate your ML workflows based in BigQuery. You can now discover and manage BigQuery ML models and easily deploy those models to Vertex AI for real-time predictions and MLOps tools.
End-to-End MLOps with pipelines
One of the most popular approaches to MLOps is the concept of ML pipelines: where each distinct step in your ML workflow from data preparation to model training and deployment are automated for sharing and reliably reproducing.
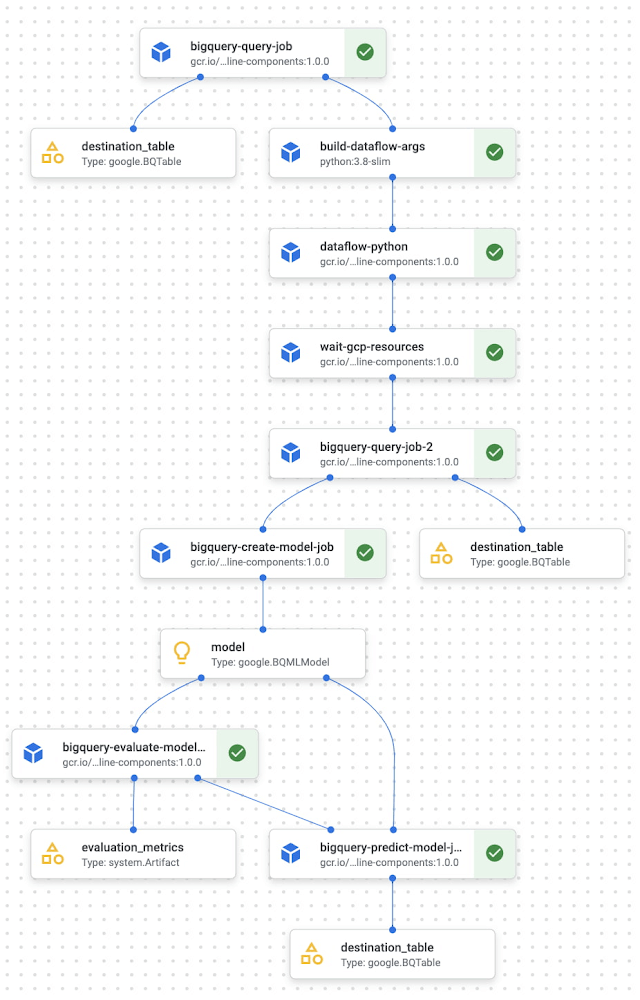
Vertex AI Pipelines is a serverless tool for orchestrating ML tasks using pre-built components or your own custom code. Now, you can easily process data and train models with BigQuery, BigQuery ML, and Dataproc directly within a pipeline. With this capability, you can combine familiar ML development within BigQuery and Dataproc into reproducible, resilient pipelines and orchestrate your ML workflows faster than ever.
See an example of how this works with the new BigQuery and BigQuery ML components.
Learn more and get started
We’re excited to share more about our unified data and AI offering today at the Data Cloud Summit. Please join us for the spotlight session on our “AI/ML strategy and product roadmap” or the “AI/ML notebooks ‘how to’ session.”
And if you’re ready to get hands on with Vertex AI, check out these resources:
Codelab: Training an AutoML model in Vertex AI
Codelab: Intro to Vertex AI Workbench
Video Series: AI Simplified: Vertex AI
GitHub: Example Notebooks
Training: Vertex AI: Qwik Start
Making Your Pictures Worth a Thousand Labels! (with Cloud Vision API)
1207
Of your peers have already read this article.
2:30 Minutes
The most insightful time you'll spend today!
In this post, I’ll be showing some amazing ways the Vision API can extract meaning from your images – keep reading, or jump directly into a tutorial using Python, Node.js, Go, or Java! This tutorial can be completed at no cost within the Google Cloud Free Tier.
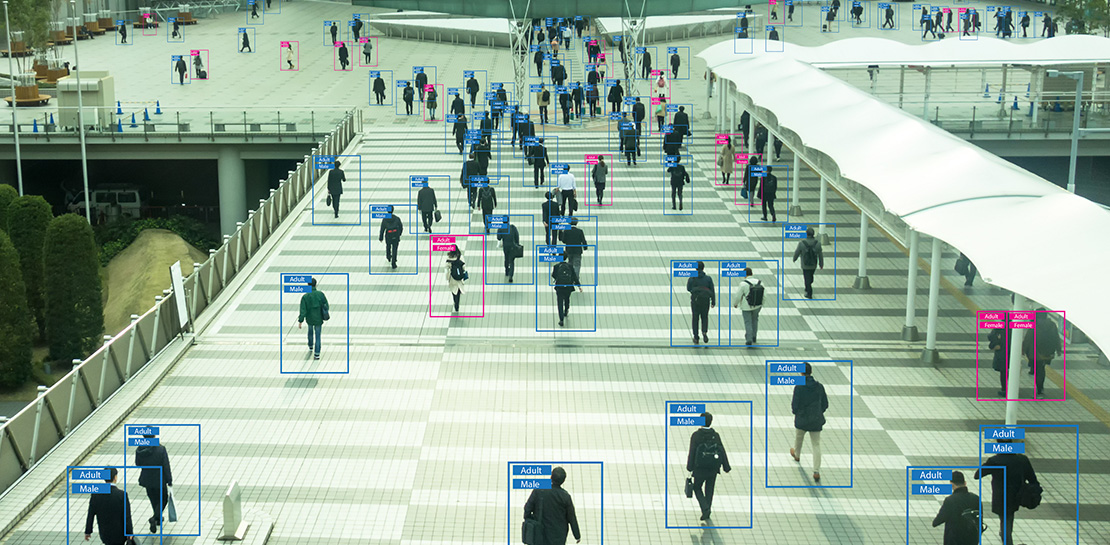
They say a picture is worth a thousand words. But how do you make those words available and useful? Around the world, we are generating more images than ever before, and it’s no surprise that businesses are turning to image recognition technology to help meet the immense opportunities created with this growing set of data.
Cloud Vision API is a powerful tool that enables you to perform a variety of tasks including label detection, text recognition, and object tracking on your image data. Whether it’s identifying products in a retail store, analyzing social media posts for brand mentions, or scanning through millions of images to find a specific object, the Cloud Vision API can help businesses automate their image analysis workflows and gain valuable insights from their visual data. To protect privacy, and help you build responsibly, the Cloud Vision API offers features to limit personal identification, such as person blur, which hides identifiable features.
Let’s explore a few of the key features of the Cloud Vision API.
Detect famous landmarks
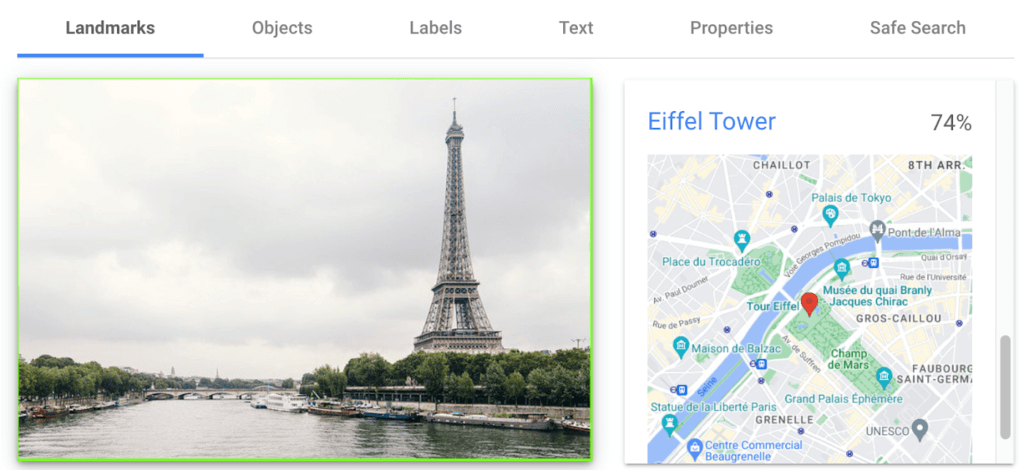
Landmark detection allows you to analyze images to identify specific landmarks such as buildings, natural features, and other recognizable locations. Cloud Vision API recognizes landmarks and provides information about them, including their name, location, and other relevant details. Perhaps you are trying to identify the landmarks in images shared by customers as part of social campaigns, or want to build a mobile app that provides information to tourists on famous landmarks.
In the below left-hand side image, Cloud Vision API has detected the Eiffel Tower, shown in the visualized response. Not shown in this visualization here, but also detected, were Pont de Bir-Hakeim (the bridge) and Champs de Mars (the park in front of the Eiffel Tower).
Detect objects and label images
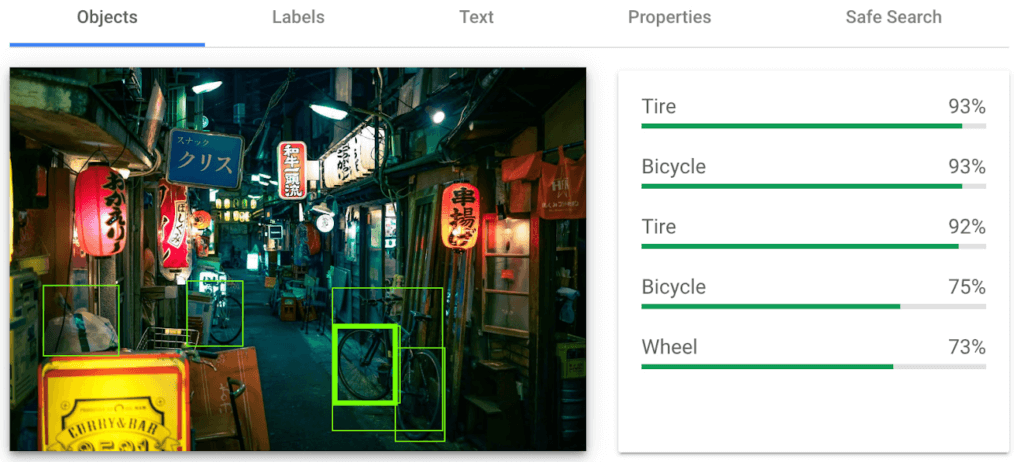
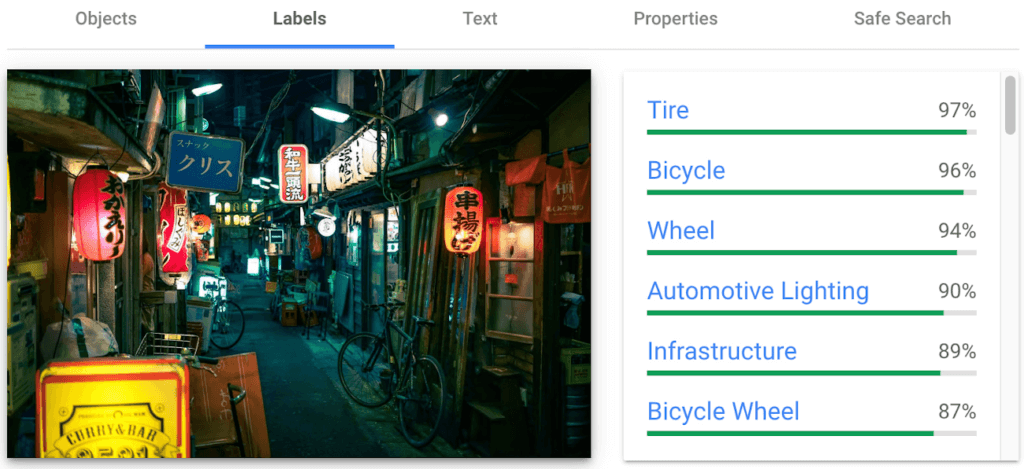
Object detection and labels are two related features that enable you to identify and classify objects within an image. Object detection detects and locates objects within an image, and provides information such as the position, size, and orientation of each object. Labels, on the other hand, provide a general classification of the content within an image.
Object detection has practical applications in many industries such as self-driving vehicles (where it’s critical), retail, manufacturing and more, while labels can be used to help classify and organize large collections of images, or to categorize and filter content.
You can see the similarities and differences in the responses provided by the object detection and labeling features in this image taken in Setagaya.
Detect text
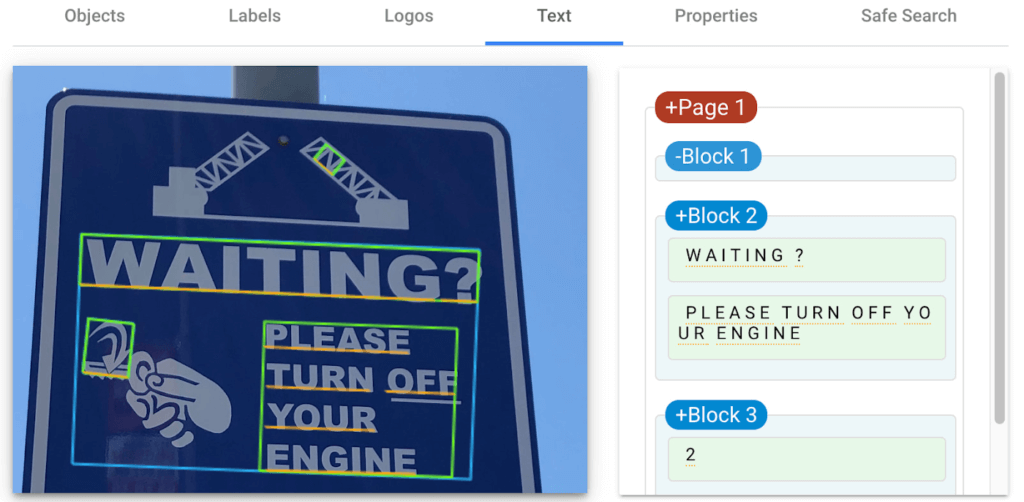
Cloud Vision API detects and extracts text from any image, even if it’s handwritten or in different languages. Once it detects text, the API can provide information about the position, orientation, and size of each text element, as well as individual words, and their bounding boxes.
In this image of a traffic sign, Cloud Vision API has detected the text and provided it in the response.
Detect explicit content
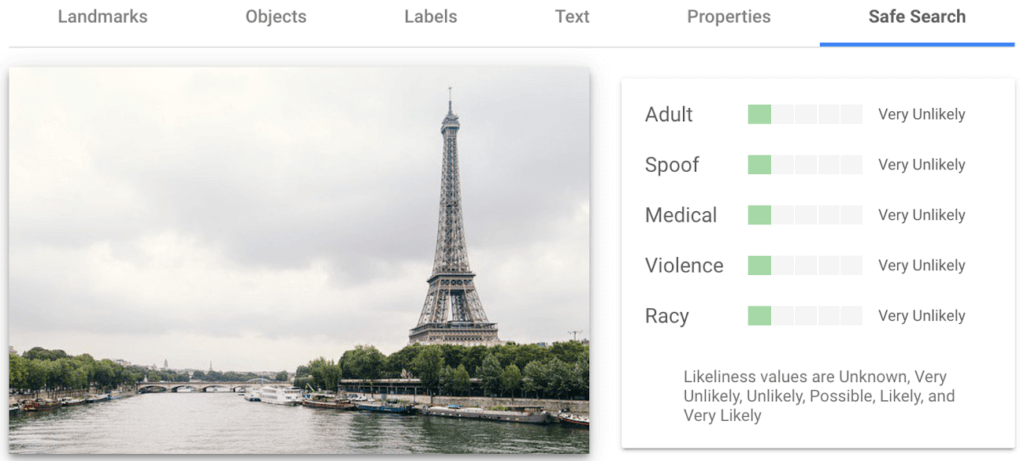
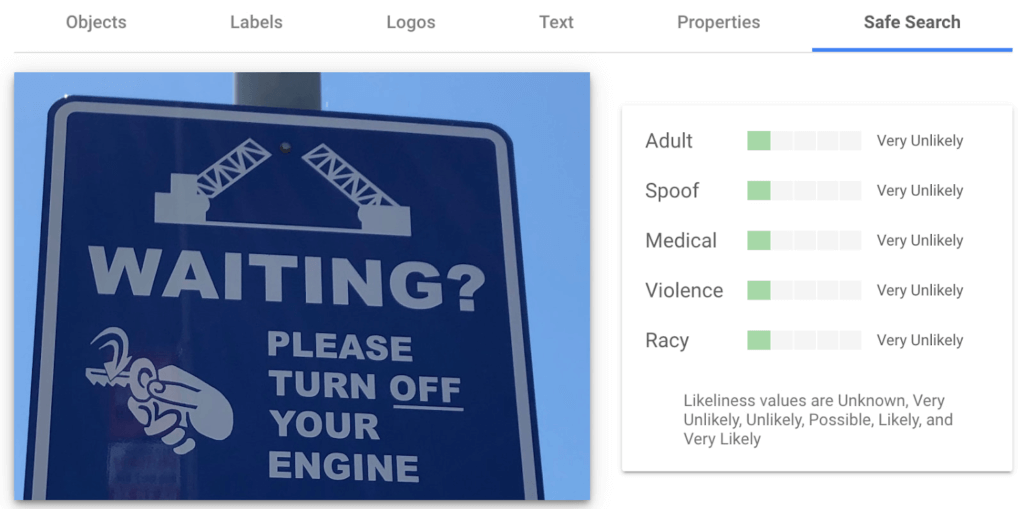
Cloud Vision API can automatically identify and flag explicit or inappropriate content within an image using five categories: adult, spoof, medical, violence, and racy. The API provides a score that indicates the likelihood for each category in the image, which you can use to set thresholds in your application and decide how to handle those that exceed them. This feature is particularly useful for filtering or moderating user-generated content.
Luckily for the images I shared here, each category has been deemed “very unlikely” to be present. Phew!

Next Steps
These are just a few features of the Cloud Vision API and how it can help your business with automating image analysis workflows and gaining valuable insights from your visual data.
Head to the interactive walkthrough tutorials in Python, Node.js, Go, and Java to see step-by-step how to access the API and learn more about all the features that you can integrate into your own applications! Again, this tutorial can be completed at no cost within the Google Cloud Free Tier.

5201
Of your peers have already downloaded this article
2:30 Minutes
The most insightful time you'll spend today!
For as long as business intelligence (BI) has been around, visualization tools have played an important role in helping analysts and decision-makers quickly get insights from data.
In our current era of big data analytics, that premise still holds. To provide an integrated platform for building BI dashboards on top of big data, GCP offers the combination of Google BigQuery, a cloud-native data warehouse that helps you analyze petabytes of data quickly, and Google Data Studio, a free tool that helps you quickly create beautiful reports.
First, imagine that you work for an online retailer that bases important decisions on customer interaction data in the form of large amounts (multiple TBs) of usage logs stored as date-partitioned tables in a BigQuery dataset called usage. To get business value out of that data as quickly as possible, you want to build a dashboard for analysts that will provide visualizations of trends and patterns in your data.
The good news is that a connector is available that lets you query data stored in BigQuery directly from Data Studio.
Learn how to build a BI dashboard with Data Studio as the front end, and powered by BigQuery on the back end (with some help from Google App Engine for added efficiency). Download this how-to now.
UKG Ready: Meeting the Needs of Complex Machine Learning Models and Distributed Data Sets

3978
Of your peers have already read this article.
2:30 Minutes
The most insightful time you'll spend today!
Business Problem
UKG Ready primarily operates in the Small and Medium Business (SMB) space, so inherently many customers are forced to operate and make key business decisions with less Workforce Management (WFM) / Human Capital Management (HCM) data. In addition to volume, SMB lacks the variety of data needed to create a dynamic and agile organization. This puts SMB at a major disadvantage compared to larger segments.
Project Goals
People Insights module is committed to surfacing insights to customers in the context of their day-to-day duties and aid in decision making. With the SMB customer data limitations mentioned above, the goal of this project was to create a global dataset that augments individual customer data to bring light to less obvious, yet important information.
Challenges
UKG Ready is a highly configurable application that gives customers the opportunity to build solutions on a platform that meets their specific business needs. High configurability gives high flexibility to customers in their usage of the software. However, it becomes nearly impossible to create a global dataset for machine learning and data insights. UKG Ready manages just under 4 million of the US workforce and some 30,000+ customers. Despite the large employee dataset size, machine learning models that are specific to customers are starved for data because the individual customers have a relatively small employee population. Does that mean we cannot support our SMB customers’ decision making with ML?
Result
Partnering with Google, we were able to develop an approach that allowed us to standardize various domain entities (pay categories, time off codes, job titles, etc.) so that we could build a global dataset to augment SMB customer data. Using machine learning we were able to build a common vocabulary across our customer base. This common vocabulary encapsulates the nuances of how our customers manage their business and yet is generalized and standardized such that the data can be aggregated over the variety of customer configurations. This allows us to serve up practical insights to customers through various use cases. Our partnership allowed us to leverage Google Cloud Services to meet the needs of our complex machine learning models, distributed data sets and CI/CD processes.
How
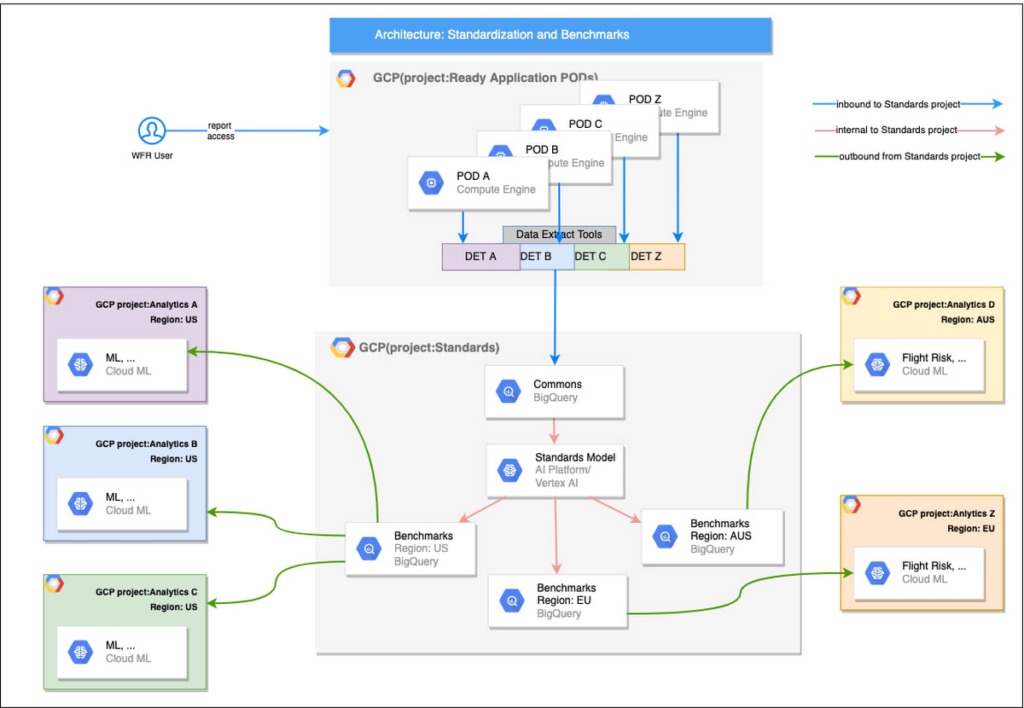
UKG Ready decided to partner with Google for an end-to-end solution for the analytics offering. This allowed us to focus on our core business logic without having to worry about the platform, environment configurations, performance and scalability of the entire solution. We make use of various Google Cloud services such as Cloud Triggers, Cloud Storage, Cloud Functions, Cloud Composer, Cloud Dataflow, Big Query, Vertex AI, Cloud Pub/Sub… to host our analytics solution. Jenkins manages the entire CI/CD pipelines and cloud environments are configured and deployed using Terraform.
The standardization of business entities problem was solved in three distinct steps:
Step 1: Collecting aggregated data
We needed an approach to collect aggregated data from our highly distributed, sharded, multi-tenant data sources. We developed a custom solution that allows us to extract data aggregated at source for PII and GDPR considerations and transfer to Google Cloud Storage in the fastest manner possible. Data is then transformed and stored in Big Query. Services used: GCS, Cloud Functions, DataFlow, Cloud Composer and Big Query. All processes are orchestrated using Cloud Composer and detailed logging is available in Cloud Logging (Stackdriver).
Step 2: Applying NLP (Natural Language Processing)
Once we had the variety of customer configurations or the business entities available, we then applied NLP algorithms to categorize and standardize these in buckets. This approach assumes that customers use natural language for configurations like job titles, pay codes etc.
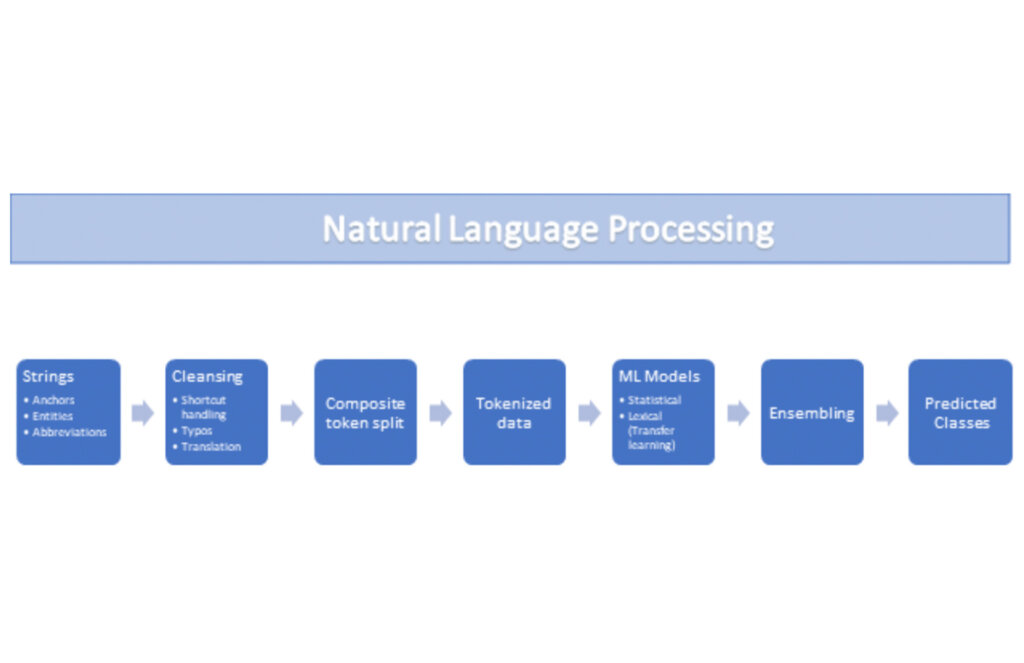
String Preparation
The input data for string preparation process is an entity string or several strings, that describe one entity object (like name-description pair or code-name pair). The output represents set of tokens that may be used to run a classification/clustering model. The process of string preparation tokenizes strings, replaces shortcuts, handles abbreviations, translates tokens, handles grammatical errors and mistypes
ML Models
Statistical
The idea of the model is to use defined target classes (clusters) and assign several tokens (anchors) to each of them an entity that has any of those tokens would be “attracted” to appropriate class. All other tokens are weighted according to frequencies of usage of theses tokens in the entities with anchor tokens:
Using anchor tokens, we are building kind-of Word2Vec - dimensionality of vector is equal to number of target classes. The higher the specific dimension (cluster) value, the higher the probability of entity to be included in appropriate cluster. Final prediction for entity tokens list for specific class is sum of weights of all the tokens included. Predicted cluster is a cluster that has maximal prediction score.
Lexical Model
We managed to generate reasonable amount of labeled data during statistical model implementation and testing. That opens a possibility to build “classical” NLP model that uses labeled data to train classification neural network using pretrained layers to produce token embeddings or even string embeddings. We started experimentation with pre-trained models like GloVe and got good results with single words and bi-grams but started getting issues in handling of n-grams. Our Google account team came to our rescue and recommended some white papers that helped formulate our strategy. We now use Tensorflow nnlm-en-dim128 model to produce string embeddings – it was trained on 200B records English Google News corpus and produces for each input string 128-dimensional vector. After that we use several Dense and Dropout layers to build a classification model.
Ensembling
To perform ensembling all the model results for each class are cast to probabilities using softmax transformation with scale normalization. Final predicted probability is maximal average score of both models among all the classes scores – appropriate class is predicted class.
The machine learning models are deployed on Vertex AI and are used in batch predictions. Model performance is captured at every prediction boundary and monitored for quality in production.
Step 3: Making available common vocabulary
Having the standardized vocabulary, we then needed a mechanism to have the results be available in UKG Ready reports and customer specific models like Flight Risk and Fatigue. For this we again used Google Services for orchestration, data transformation and data storage.
Once the modeling is complete, we made the customer specific models leveraging the above architecture be available in Reports. We utilized our proven existing technology choices in GCP for orchestration, data transformation and data storage
Results
We are able to build a common vocabulary of our customers’ business entities with good confidence. And be an expert advisor to our SMB customers in their decision-making using machine learning. With the advice of our Google account team and using Google services we can add value to our product in a relatively short amount of time. And we are not done! We continue to use this platform for new use cases, complex business problems and innovative machine learning solutions.
Sample result:
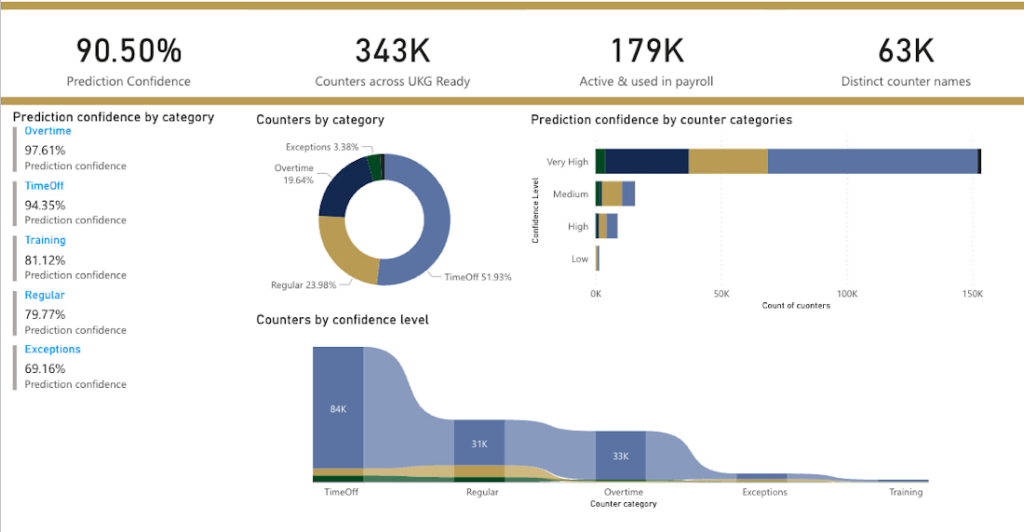
Special thanks to Kanchana Patlolla , AI Specialist, Google for the collaboration in bringing this to light
Data to Business Outcomes with Google’s Data Analytics Design Pattern

6743
Of your peers have already read this article.
1:30 Minutes
The most insightful time you'll spend today!
Companies today are inundated with vast amounts of data from various sources. This overwhelming amount of data is meant to benefit the company, but often leaves data teams feeling overwhelmed, which can create data bottlenecks and result in a slow time to value. In fact, only twenty seven percent of companies agree that data and analytics projects produce insights and recommendations that are highly actionable (Accenture). This means that nearly 3 in 4 companies are not unlocking value in their data, which poses a huge challenge for organizations trying to move the needle and drive real business results. We at Google Cloud, however, saw opportunity in this challenge, which is why we created Data Analytics Design Patterns: cross-product technical solutions designed to accelerate a customer’s path to value realization with their data. These industry solutions bring together product capabilities alongside design methodology, open source deployable code, data models, and reference architectures to accelerate your business outcomes.

With Data Analytics Design Patterns, you get access to more than 30 ready-to-deploy data analytics solutions. Design patterns leverage the best of Google and our rich partner ecosystem, including Technology Partners & System Integrators. In this blog, we will cover 3 examples on how a design pattern can be applied to unlock the value of data:
- Improve mobile app experience with Unified App Analytics
- Maximize digital shop’s revenue with Price Optimization
- Protect internal systems from security and malware threat with Anomaly Detection
Unified App Analytics
If mobile apps are part of your go-to-market strategy, you have several data sources that can provide invaluable customer insights. In addition to tools such as CRM (e.g. Salesforce) and customer care (e.g. Zendesk), you likely use Google Analytics to log app events and Firebase Crashlytics to gather data about app errors. But can you easily combine back-end server data with app front-end data to unlock customer insights?
The Unified App Analytics design pattern makes it easy to plug all the disparate data sources into a single warehouse (BigQuery) and start analyzing it with a Business Intelligence tool (Looker). Once you have a complete and real time view of your customer experience with your app, you can take action. For example, if you notice an increase in app errors, you can quickly combine your Crashlytics data with your CRM data to narrow down the crashes with the highest revenue impact and prioritize their resolution. Further, you can automate your issue resolution workflow by creating a rule for any future crash that impacts a subset of VIP customers.

With the Unified App Analytics design pattern, you’ll gain access to valuable insights about your user experience with your app so you can inform your future app strategy. For example, NPR, an American media company, increased user engagement by showing content that better mapped to listener interests and behaviors.
Price Optimization
In a competitive and hectic global marketplace, strategic pricing matters more than ever, but often projects are consumed by the tedium of standardizing, cleaning, and preparing data—from transactions, inventory, demand, among other sources.
Price Optimization solution allows retailers to build a data driven pricing model. The solution consists of three main components:
- Dataprep by Trifacta: integrates different data sources into a single Common Data Model (CDM). Dataprep is an intelligent data service for visually exploring, cleaning, and preparing structured and unstructured data for analysis, reporting, and machine learning.
- BigQuery: allows you to create and store pricing models in a consistent and scalable way as a serverless Cloud Data Warehouse service
- Looker dashboards: surface insights and enable business teams to take action with enterprise ready BI platform
With the Price Optimization design pattern from Google Cloud and our partner Trifacta, you’ll be able to rapidly unify multiple data sources and create a real-time and ML-powered analysis, leveraging predictive models to estimate future sales. For example, PDPAOLA, an online jewelry company, doubled sales with dynamic pricing adjustments enabled by a single data view.

Anomaly Detection
Organizations need to anticipate and act on risks and opportunities to stay competitive in a digitally transforming society. Anomaly detection helps organizations identify and respond to data points and data trends in high velocity, high volume data sets that deviate from historical standards and expected behaviors, allowing them to take action on changing user needs, mitigate malicious actors and behaviors, and prevent unnecessary costs and monetary losses.
The Anomaly Detection design pattern uses Google Pub/Sub, BigQuery, Dataflow, and Looker to:
- Stream events in real time
- Process the events, extract useful data points, train the detection algorithm of choice
- Apply the detection algorithm in near-real time to the events to detect anomalies
- Update dashboards and/or send alerts
The challenge of finding the important insights and anomalies in vast amounts of data applies to organizations across all industries and lines of business, but is especially important to protecting the security of an organization. For example, TELUS, a national communications company, modernized their security analytics platform leveraging this pattern, allowing them to detect anomalies in near real time to detect and mitigate suspicious activity.
Get started
Turn your data into business outcomes with Google Cloud and our broad partner ecosystem by deploying Data Analytics Design Patterns at your organization. There are more than 30 Data Analytics Design Patterns ready for you to use. We have more than 200+ more ideas in the pipeline, so be sure to check in regularly as new patterns will be added soon.
To dive deeper and find out more about how Data Analytics Design Patterns can help your organization accelerate use cases and create faster time to value, check out this video.
More Relevant Stories for Your Company

Use No-Cost Solutions To Bring ML Into Your Medical Research
There’s a lot we can learn from combining technology with science to help support the development of amazing discoveries. By using an AI system to predict protein shapes, we have the potential to accelerate research in every field of biology. Inside every cell in your body, billions of tiny molecular

Make Your Data Useful with Google Cloud Products and Services
While you likely know that data science is the practice of making data useful, you may not have a clear landscape around the tools that can aid each stage of the data science workflow as you use machine learning to tackle your challenges. Click to enlarge Read on to discover



An Indian Example of How to Really Up Your Customer Experience Game and Increase Conversion Rates With AI
How about selfie analysis of users to recommend them the right lipstick color? That’s just one of the many ideas folks at Purplle.com came up with to improve the buying experience of Indian consumers. And without the power of Google Cloud, it would probably have remained just that…an idea. But

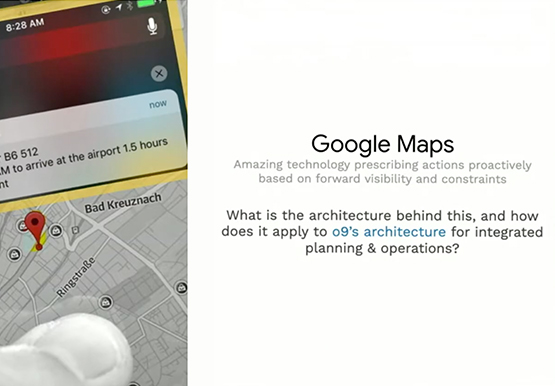
Becoming Future-Proof: AI-Powered Integrated Business Planning on Google Cloud
If there’s one thing that the pandemic will leave us with it’s this: A deep desire to be better prepared. Not prepared for the next possible catastrophe because that’s hard to do, but better prepared for the repercussions of such disaster. In this video, Stephan de Barse, Executive Vice President,
