





Cadbury Worldwide Hide: How the Chocolatier Made the Hiding Eggs Ritual Possible with Google Maps
3718
Of your peers have already read this article.
3:00 Minutes
The most insightful time you'll spend today!
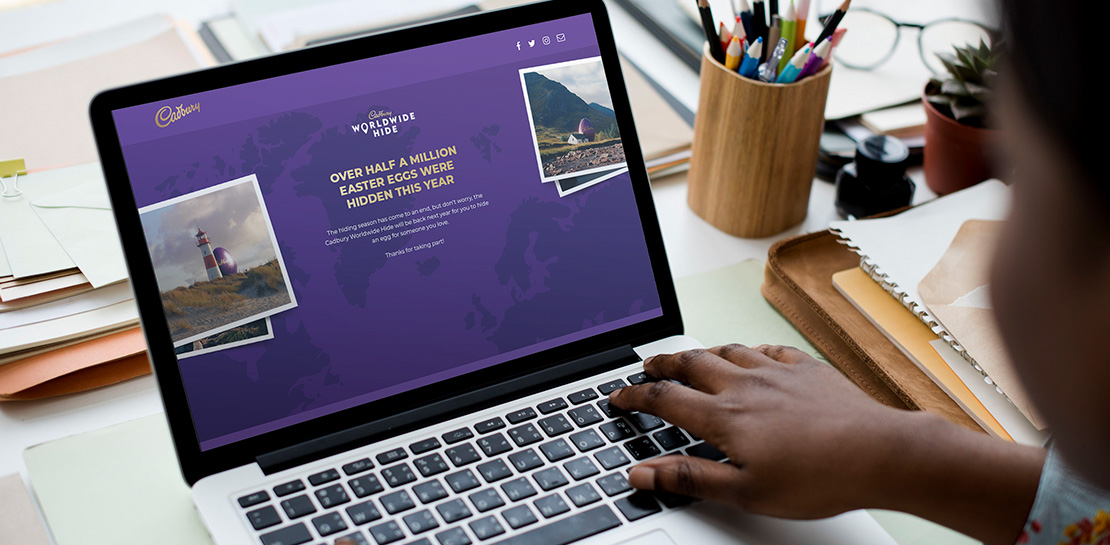
Editor’s note: Today’s post is a Q&A with the VCCP London and VCCP CX team. VCCP London conceived of and built the Cadbury Worldwide Hide platform using Google Maps Platform as a way to get consumers ‘hiding’ eggs and engaging with loved ones during a time when they could not be physically together.
How did the team come up with the idea for the ‘Cadbury Worldwide Hide’?
VCCP London is the agency of record for Cadbury both locally in the UK and centrally with the Global team. So, when Cadbury briefed us in May for their Easter 2021 campaign, they wanted us to come up with a creative way to encourage people to hide eggs and get consumers excited about interacting with loved ones. At the time, the pandemic was constantly changing, and it was looking like we were going to continue to be in lock-down for the foreseeable future, into the Easter season.
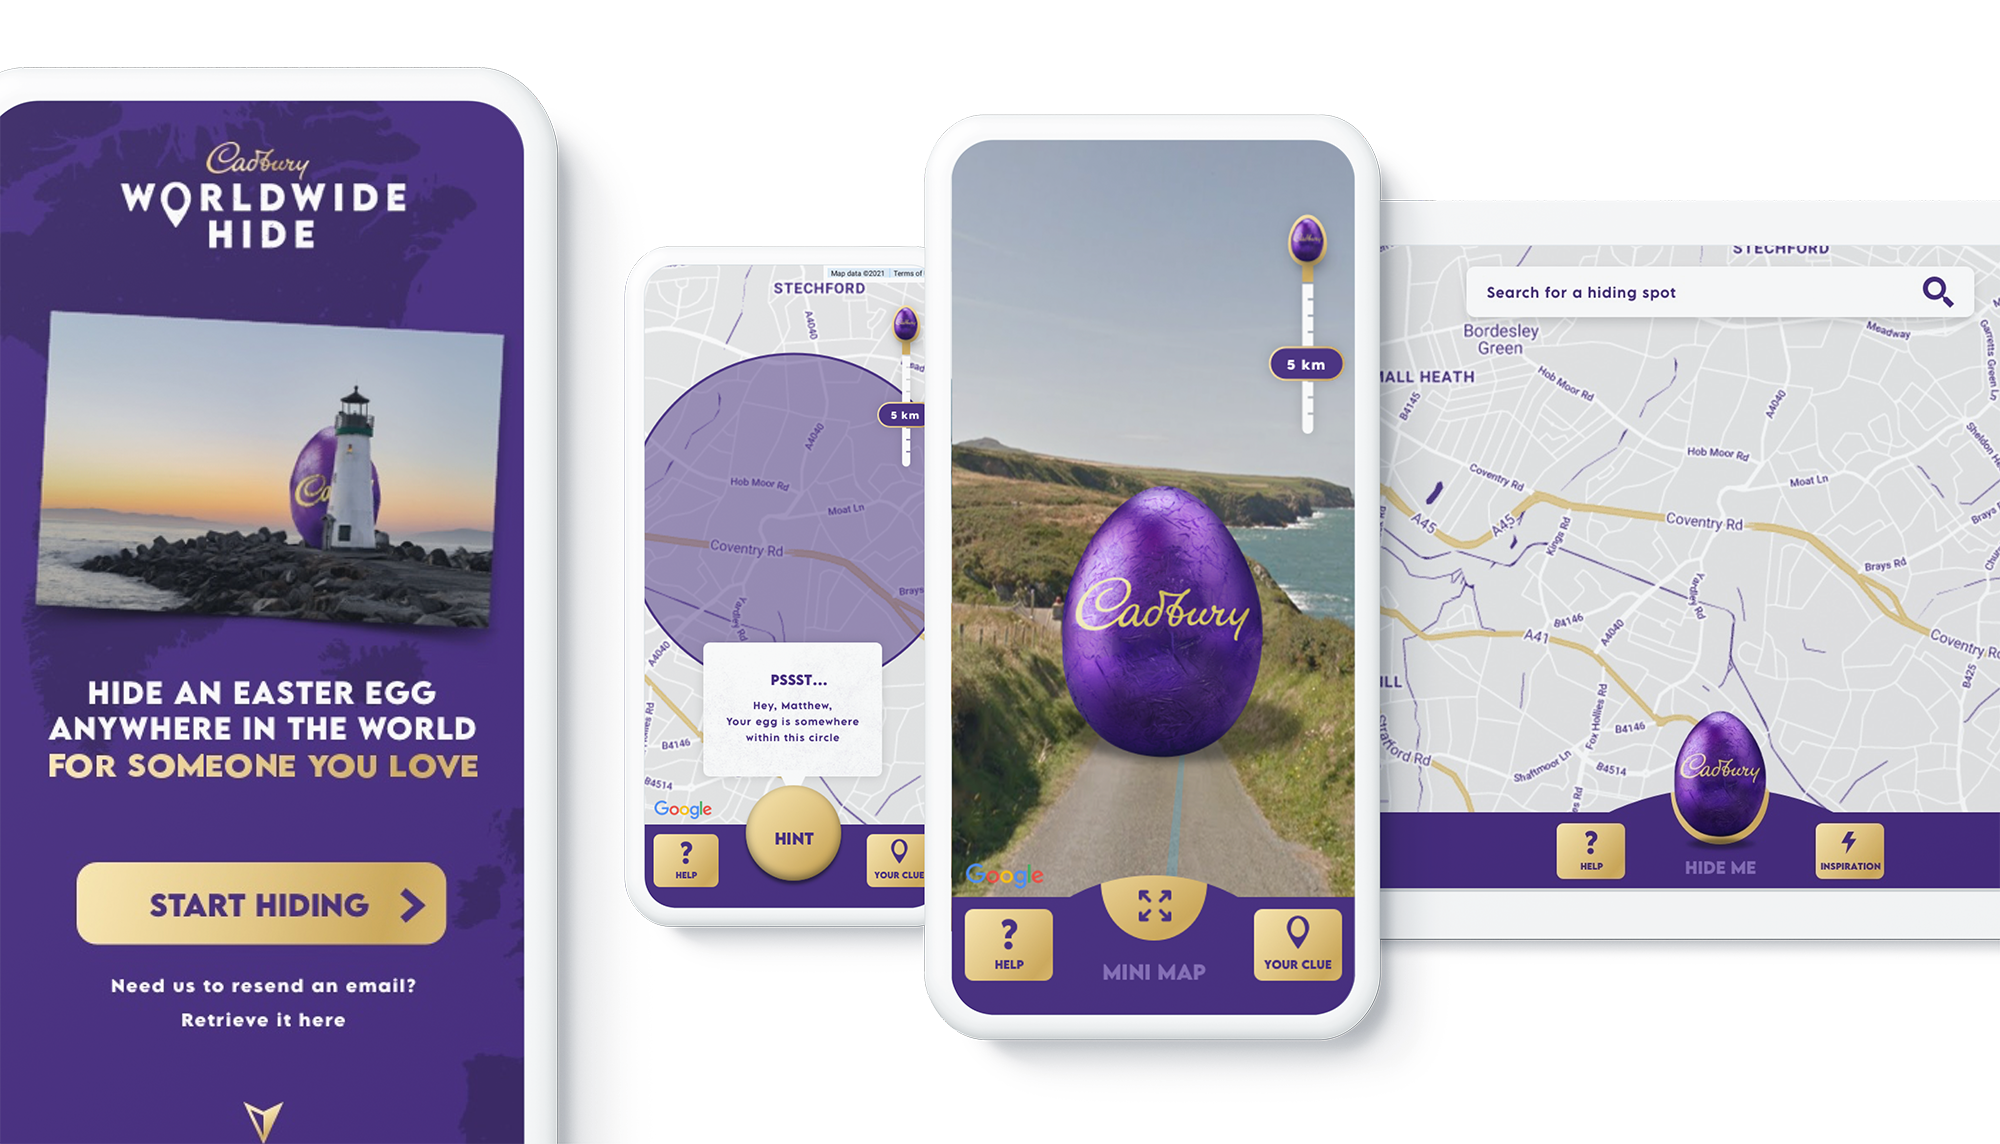
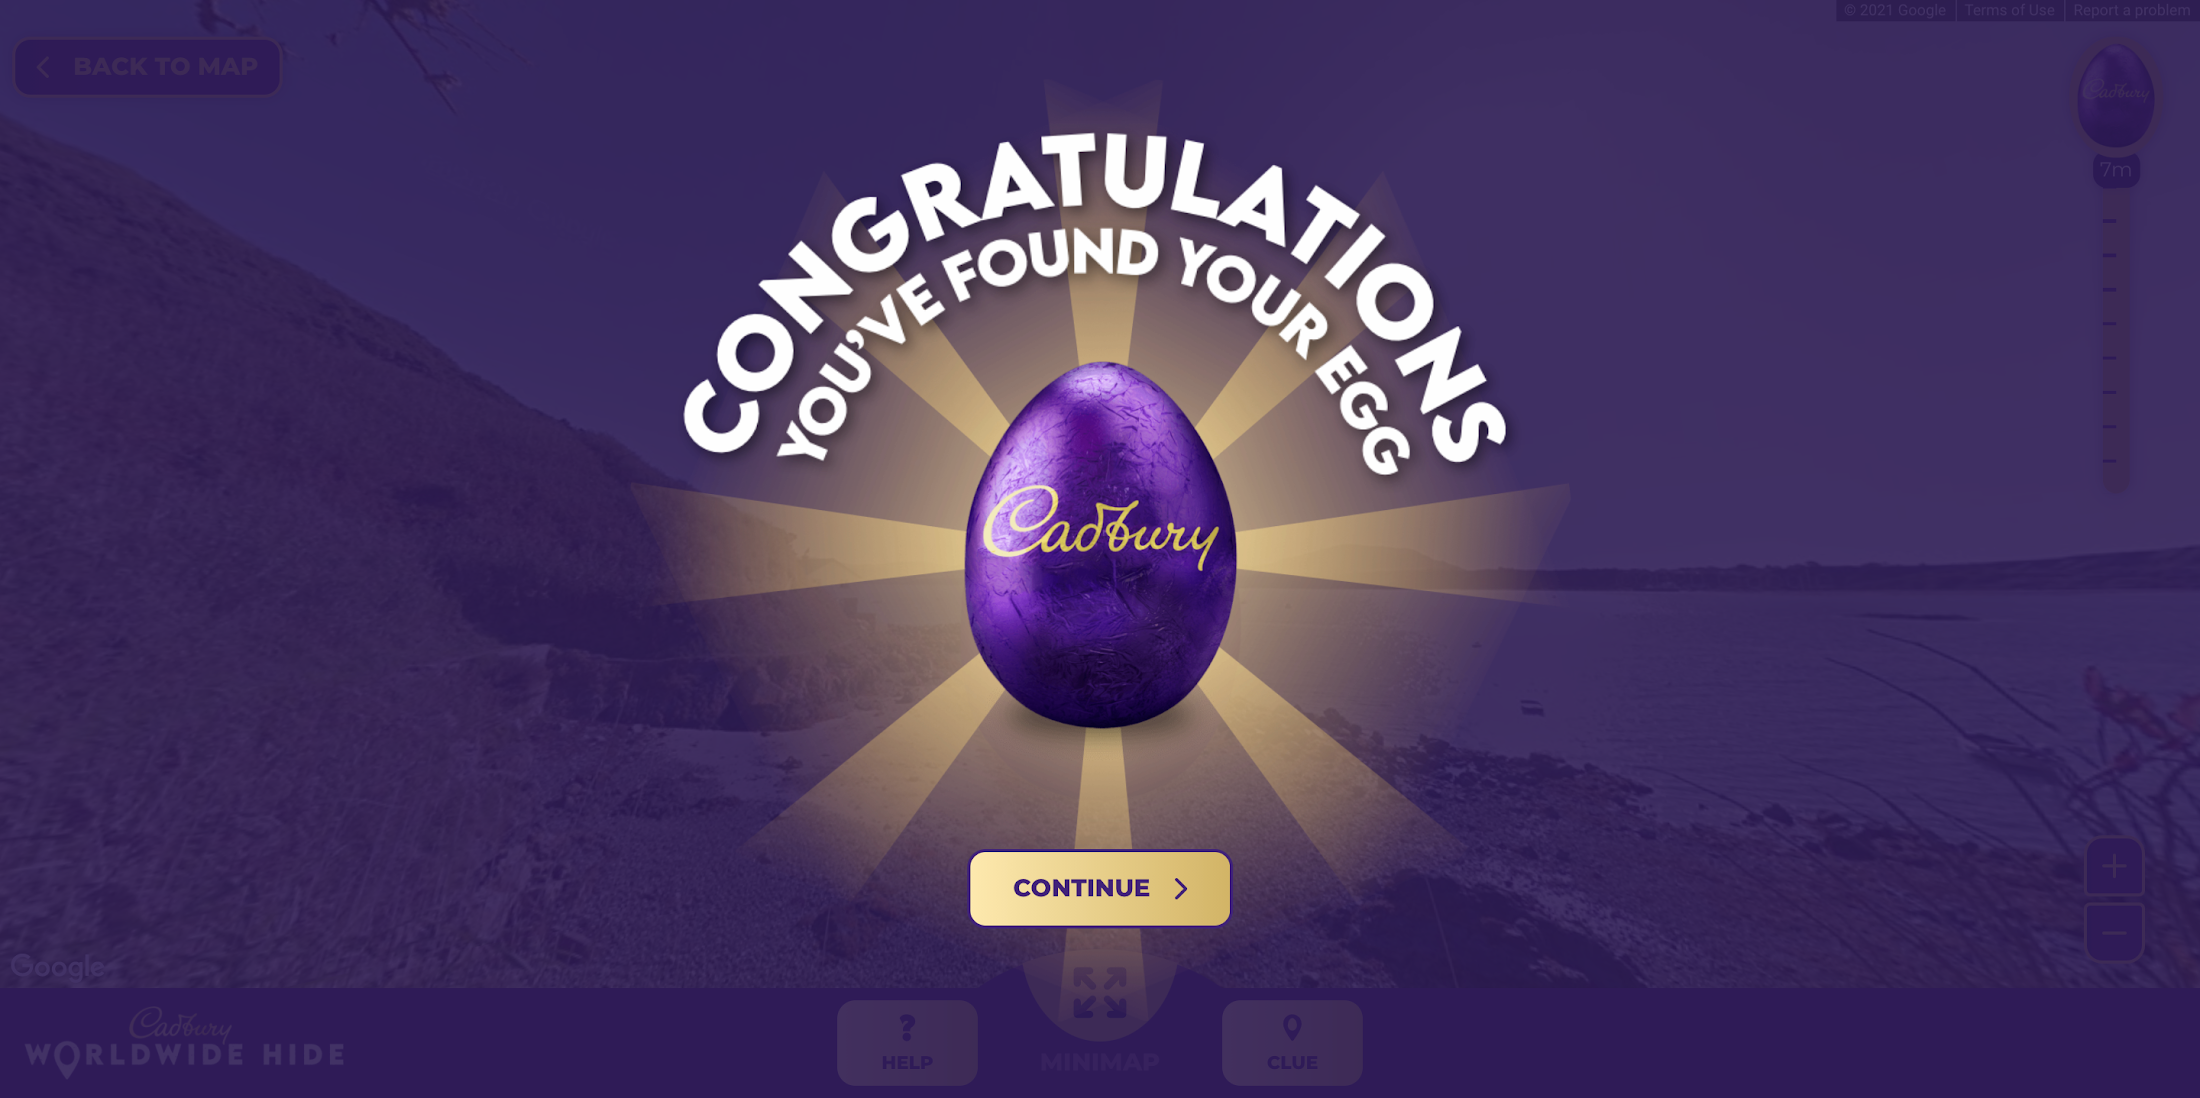
We then came up with an idea: wouldn’t it be really cool if somehow you could still hide a real Easter egg for someone you love, but do it virtually. And then once it’s found, that real egg could be delivered to the seeker’s home. With the use of some creativity and technology, we brought this idea to life. The experience we developed allowed our users to purchase a real Cadbury Easter Egg, hide it virtually on the map in a special location, then write the recipient a personalized clue for him to find the egg. Once the seeker found the egg, they would receive a real, physical egg the hider bought for her delivered to her home.
We wanted it to be a truly meaningful one-to-one connection, to bring back some lovely memories for people, and to allow a real chocolate egg to be hidden for a loved one no matter where they were.

Why was this important to Cadbury?
Generosity is at the heart of Cadbury’s brand, and Easter is our opportunity to show that ‘there’s a glass and a half in everyone’. As we enter the second year of our campaign ‘Show you care, hide it’, we are flipping the Easter ritual on its head and showing that the generous act is in hiding an egg for someone you love.
Physical connection has been restricted by the global pandemic and that’s why this year’s Easter campaign sets out to connect people across the UK through the power of generosity.
Tell us a little bit about the technical side of the project. Which Google Maps Platform products did you use to create the user experience?
The Cadbury Worldwide Hide launched across 4 markets (UK, IE, AU, NZ) simultaneously. Integration with regional e-commerce and CRM partners brought the activation into the real world with chocolate eggs being delivered throughout the campaign as seekers found them.
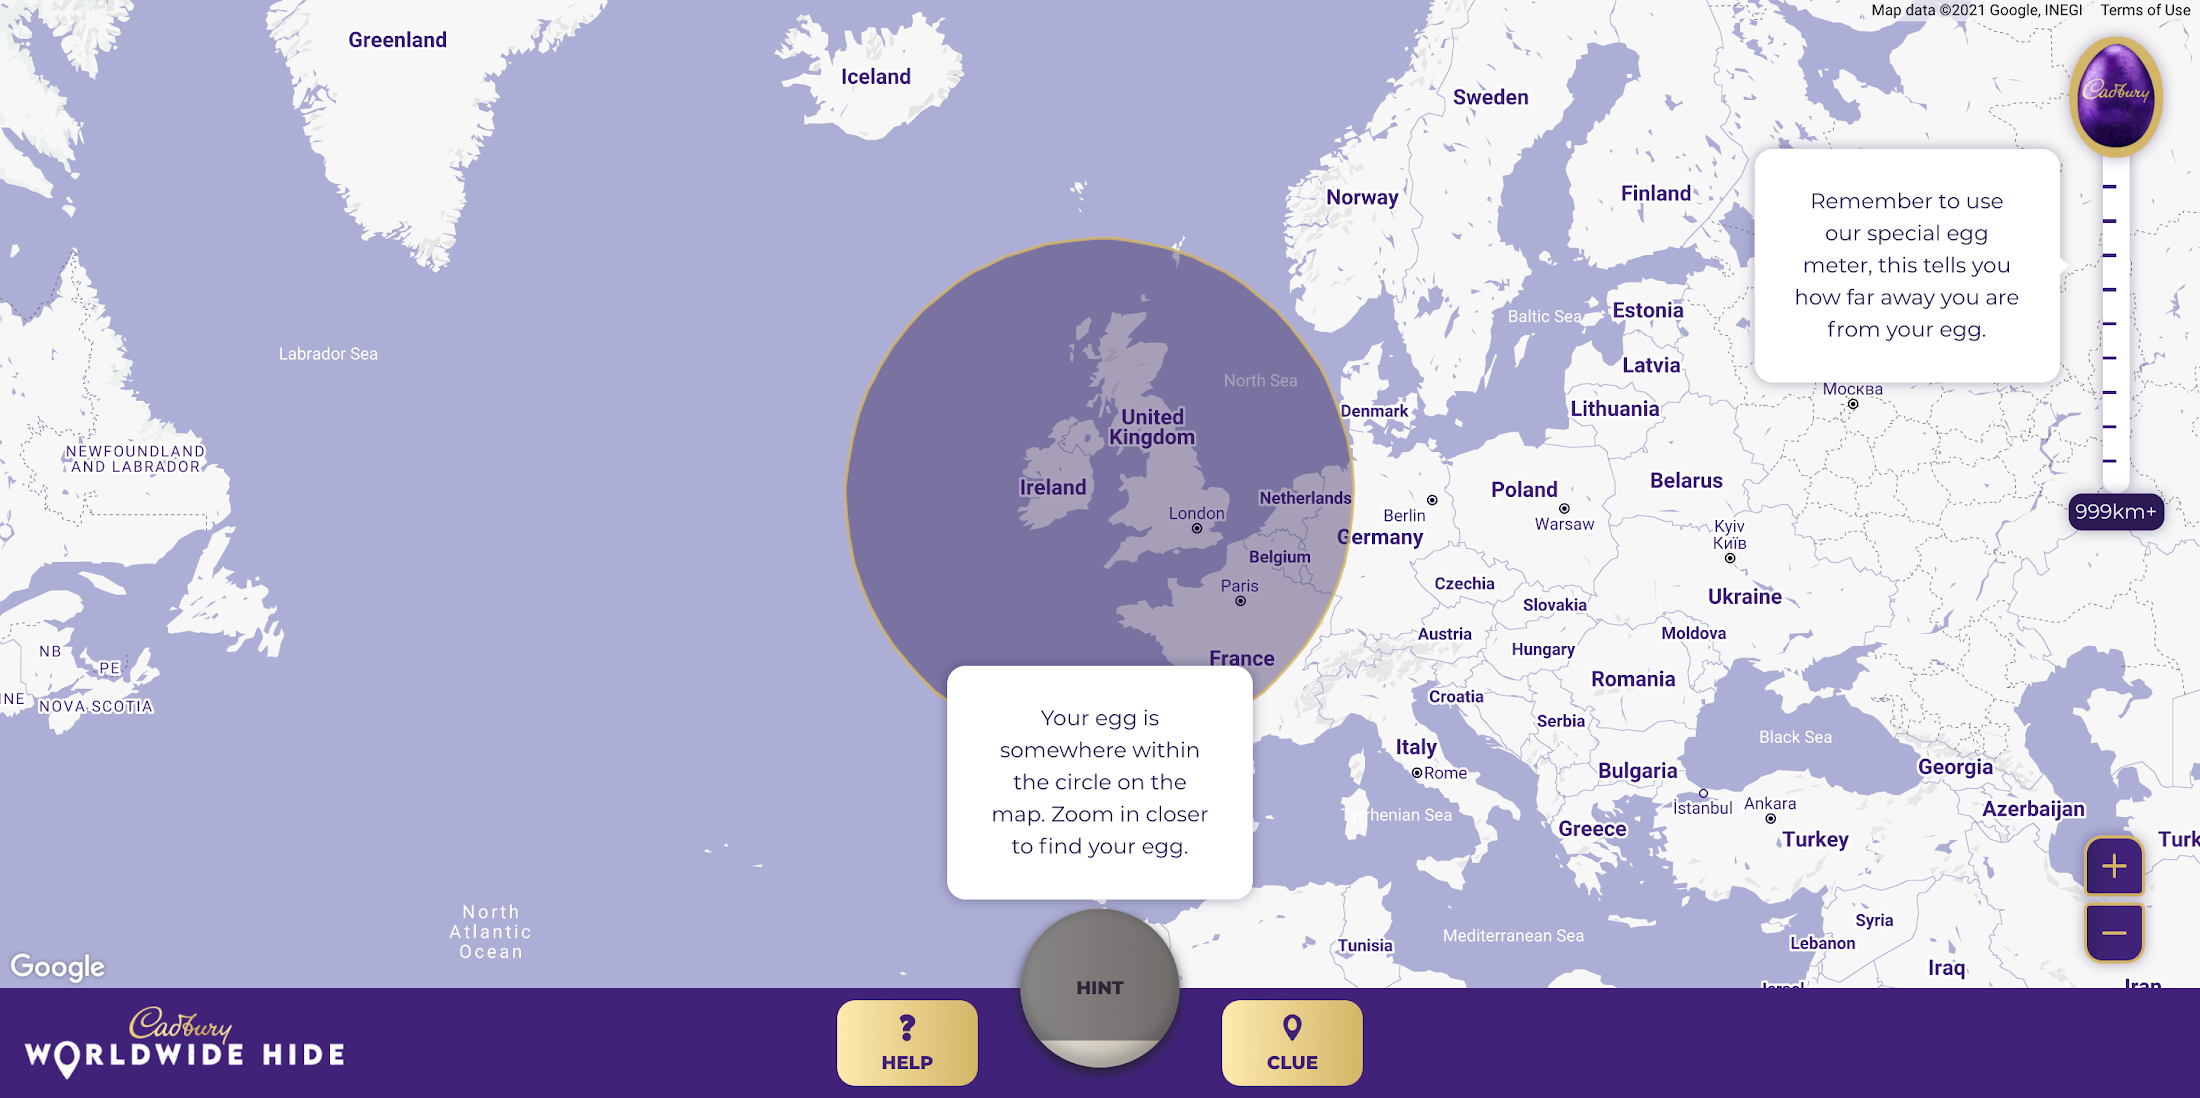
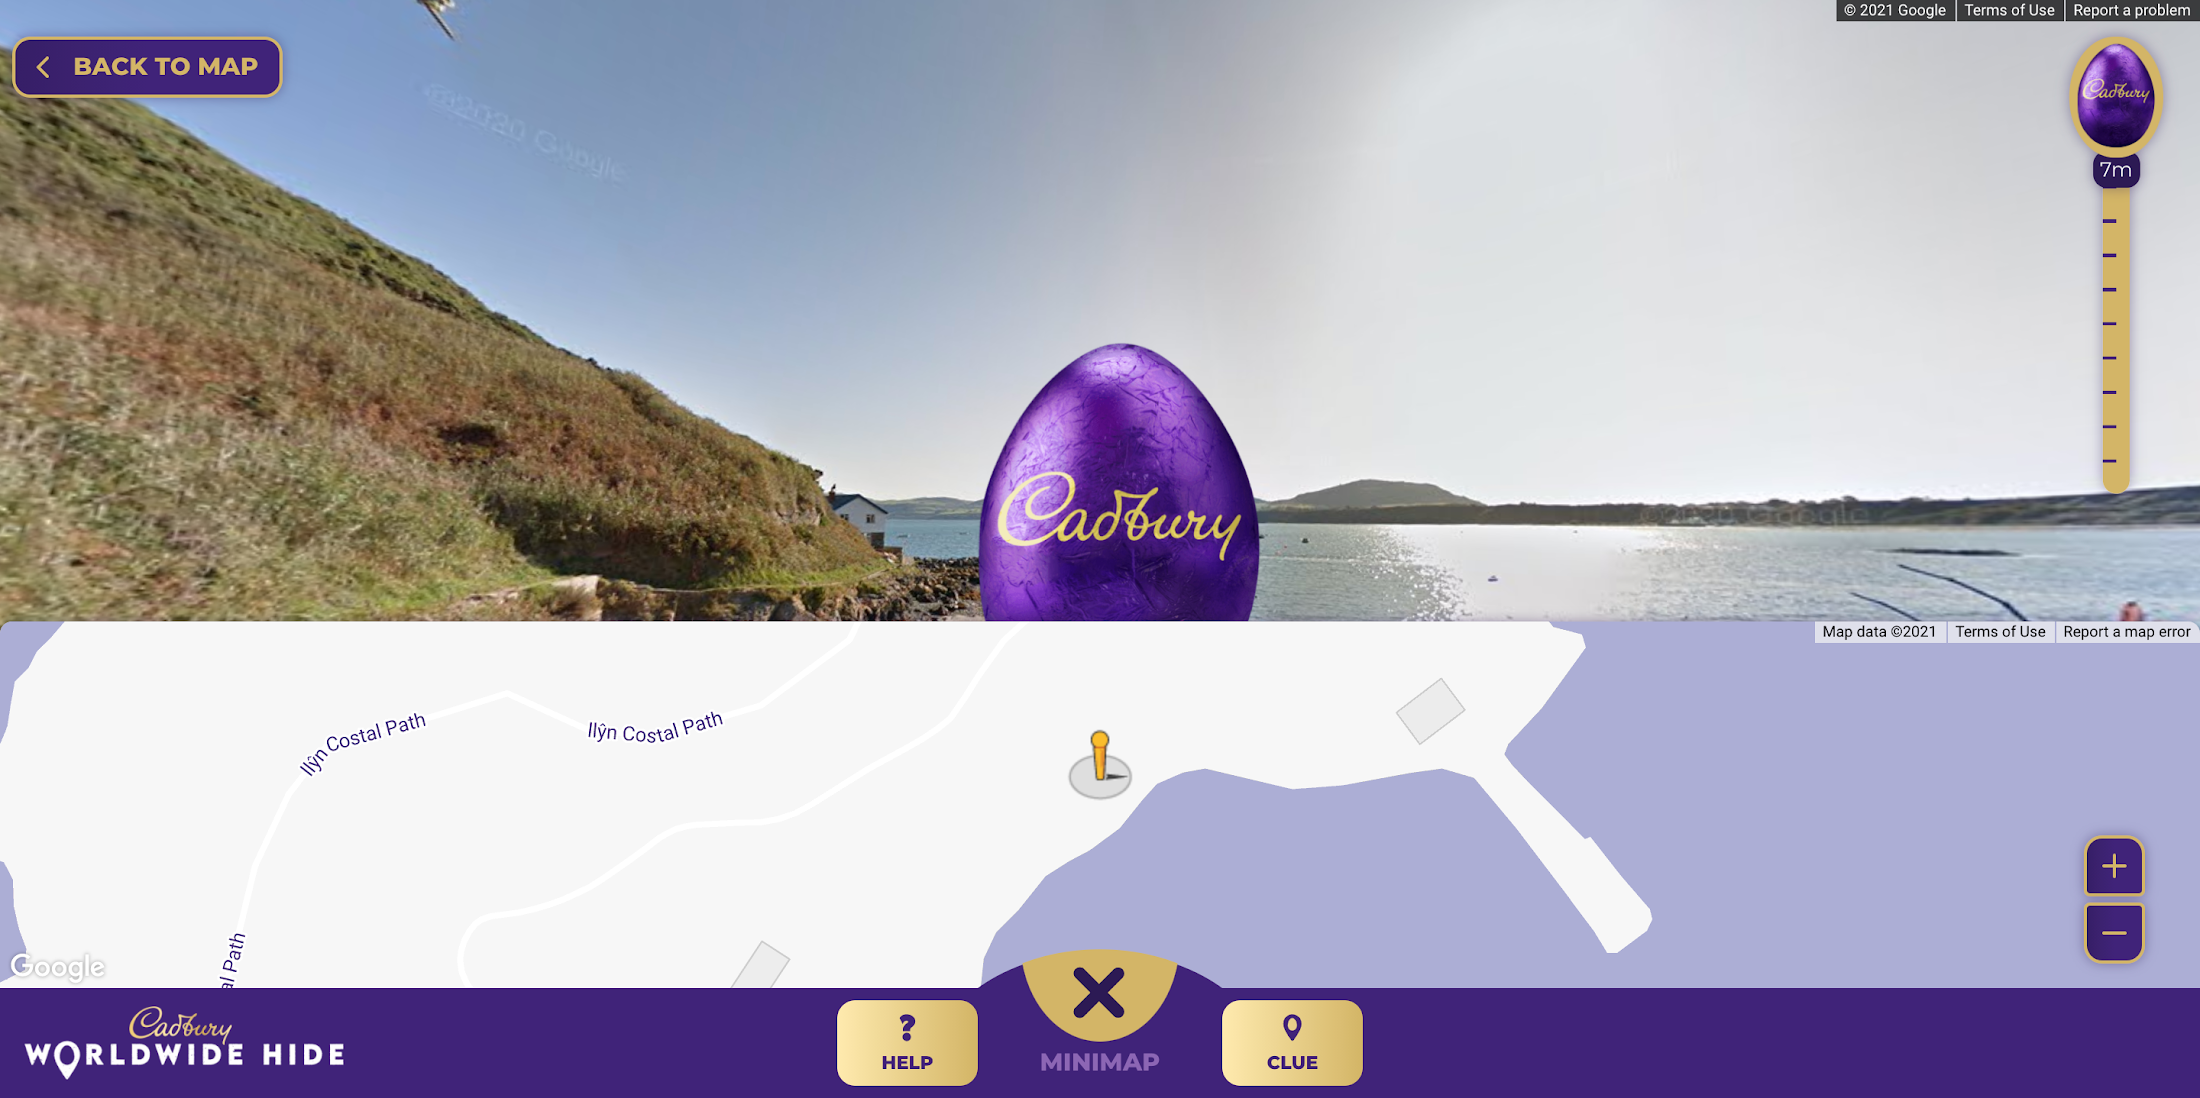
Providing an engaging map experience to our users was key to the execution and by leveraging the Google Maps interface consumers already use on a daily basis, we were able to focus on our core campaign message. We built the platform using both the Maps Javascript API to render the 2D maps and the Street View API, which allowed users to hide their egg anywhere in the world for their loved one to find. We also used Place Autocomplete powered search allowing users to search for their favorite location while contextual hints kept hiders on track. Seekers were aided with a distance meter and hints system if they got stuck. Our Design and Engineering team used Google Maps Platform Cloud-based maps styling to customize the map.
To get the campaign to as many people as possible we prioritized accessibility throughout the site, from screen-reader support and relevant tab indexes through to full keyboard shortcuts within the map experience – allowing users to hide (or find!) their egg without ever using a mouse. Real user testing was done throughout the UX, design and development process to ensure best practices were being followed.
How long did it take the VCCP team to build-out the solution?
Discovery to the roll-out of the solution took about 7 months. Our Design and Engineering team started with a 4-week discovery phase in September 2020 where we developed a service blueprint that set the foundations of the project. By visualizing the entire process of a service from start to finish, listing all the activities that happened at each stage, and the different roles, actions, processes and systems involved, the blueprint allowed all stakeholders to align on the solution.
We started iterative cycles of development in November 2020, beginning with UX (prototype for user testing), UI (look and feel and customization of Google Maps using Cloud-based Maps styling), and then kicked off front end and back end development in December. We launched the Cadbury Worldwide Hide platform in early March 2021—just in time for millions of users around the world to enjoy ahead of Easter.
Did you experience any challenges as you developed the experience?
The biggest challenge was actually around adapting to change in plans in response to the desire to launch the platform across more markets than originally intended. During the development phase, we rapidly scaled up to develop the platform for Ireland, Australia and New Zealand in addition to the UK within the same timeframe.
What results were you able to achieve and how did you measure the success of the project?
One week before Easter Sunday, we had sold out of Cadbury Worldwide Hide chocolate eggs. There were over 2.26 million site visits with an average time spent on the platform of almost five minutes. Over 809k virtual eggs were hidden in total and 14.5k real Cadbury Easter eggs bought. The Cadbury Worldwide Hide platform was the number one Mondelēz International website globally, and a couple even used the platform for a marriage proposal!
Would you recommend this type of campaign and user engagement to other B-to-C brands, if so, why?
Direct to consumer capabilities are increasingly important for brands, particularly in the FMCG (Fast Moving Consumer Goods) space. Local lockdowns and restrictions on physical retail have accelerated our adoption of ecommerce. Not only have brands had to adapt quickly, but consumers are beginning to expect direct-to-consumer capabilities from their favorite brands. Cadbury recognized this behavior shift early. What the Cadbury Worldwide Hide did well was to innovate beyond the traditional DTC and ecommerce experience by gamifying the platform and enabling moments of human connection at a time when physical connection was impossible.
What advice would you give to other agencies or brands thinking about creating user experiences with Google Maps Platform?
We learned a great deal taking on this project. Here are just a few highlights:
- Assume anything is possible.
- Our ‘Mobile First’ approach allowed consumers to access the platform from any device with consistent, engaging brand experience.
- Think big and beyond the traditional use of Google Maps and treat it as a foundation platform to build upon.
- Prototype and test early to validate your hypotheses. We created a technical proof of concept which enabled us to test using ‘real’ Google Maps and real people early in our design process.
- Don’t assume everything is accessible to everyone. You may need to build upon the ‘out the box’ functionality to ensure as many people as possible can use your solution.
For more information on Google Maps Platform, visit our website.
Earth Week: Google Cloud at the Heart of Sustainability

3483
Of your peers have already read this article.
1:30 Minutes
The most insightful time you'll spend today!
Today’s Google Doodle reminds us of the enormous changes our planet is experiencing due to climate change. Everyone, from businesses to governments to technologists, has the opportunity to meet this challenge — transforming themselves and their organizations to be more sustainable. For this Earth Day 2022, and indeed Earth Week, Google Cloud celebrates the organizations and individuals who are fighting climate change with innovative technology. We don’t want you to miss a thing, so here’s a recap of all our news in one handy location.
We asked global CEOs: what is it going to take to make progress on sustainability in your org?
In a survey of 1,500 CXOs across 16 countries, many executives say they are willing to do what it takes to have more sustainable practices. But despite their ambition, real measures of impact are lacking. To see what will change that, check out the blog.
We announced a new innovation challenge supporting climate science and research…
Our blog on Monday announced the Climate Innovation Challenge Research Credits program, to support researchers as they work to better understand climate change, increase climate resilience and develop new, promising solutions to urgent climate challenges. You can apply for research credits here.
…and shared stories of researchers making a difference
We interviewed Dr. Richard Fernandes from Natural Resources Canada, who built the LEAF toolbox that maps and assesses vegetation with satellite data from Google Earth Engine. You can read our Q&A here.
Canada has approximately 10 million square kilometers of land and the annual data volume of these maps is equivalent to streaming HD movies for over 750 hours non-stop. Cloud computing allows us to manage all this data in a useful and accessible way.Dr. Fernandes, Research Scientist
We also published a story about the U.S. Department of Agriculture’s Forest Service, and how they use Google Cloud processing and analysis tools to help sustainably manage 193 million acres of land.
We turned the lights on at new clean energy projects in four countries…
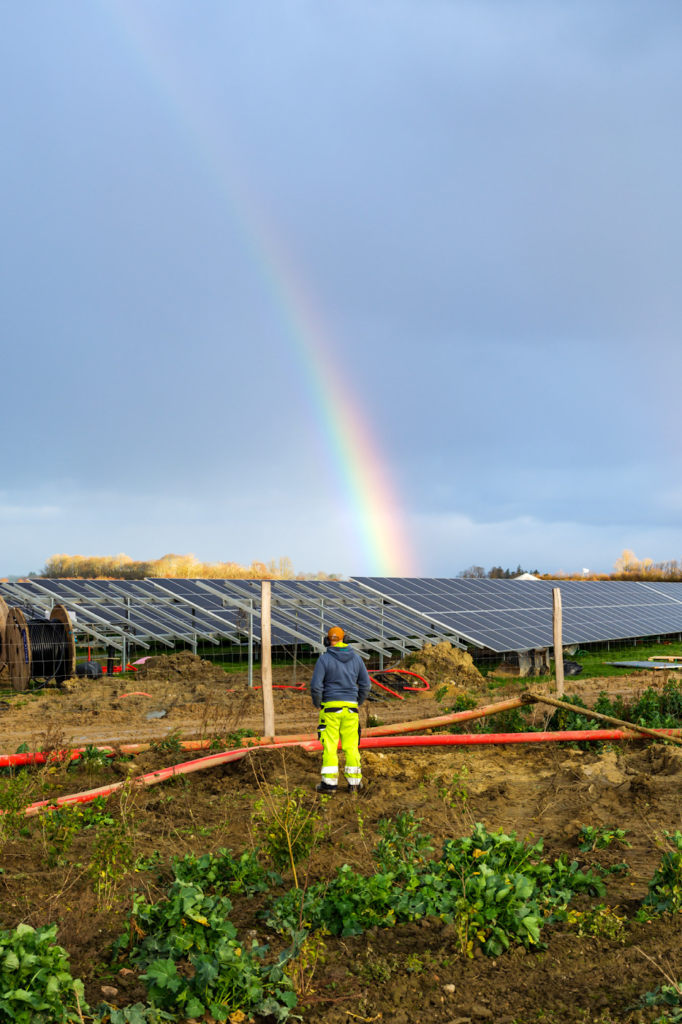
We shared details of our battery project in Belgium, solar projects in Denmark, and wind projects in Chile and Finland. Our battery project in Belgium is the first of its kind, enabling us to switch from diesel generators to a cleaner backup solution that will keep the internet up and running in the event of a power disruption. These will all help us continue to operate the cleanest cloud in the industry.
…and made it easier to learn how to build applications more sustainably
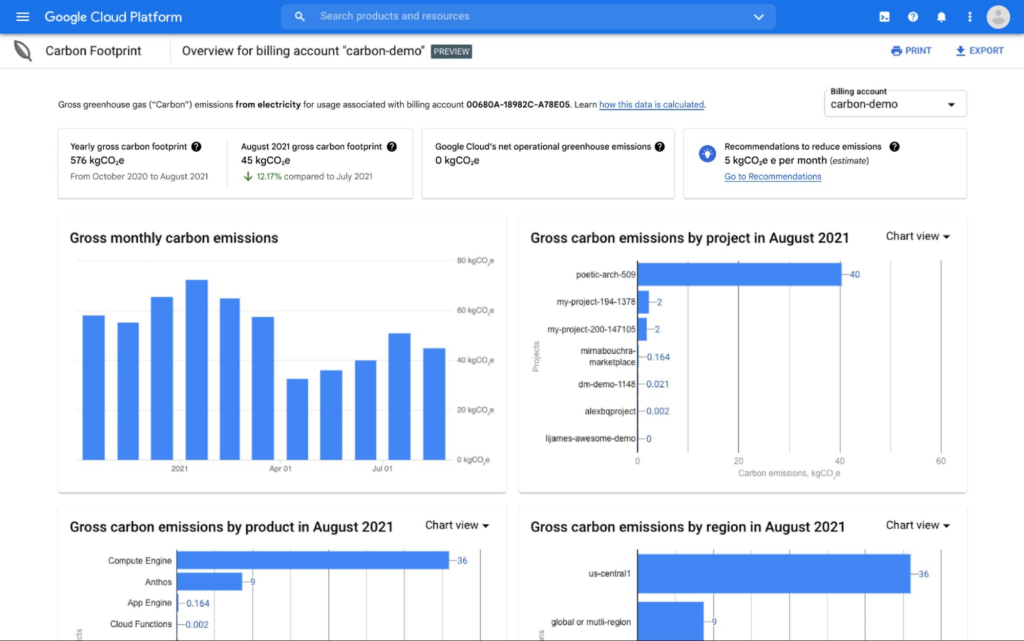
We launched a new lab that walks users through our Carbon Sense suite of products. From using our region picker app to make low-carbon architecture decisions, to analyzing the carbon footprint of your Google Cloud app with Carbon Footprint, we’re building sustainability into the tools you use every day. You can also find Carbon Footprint training in the new Data Warehouse Cloud On-Board.
We formed an ecosystem of partners to help accelerate sustainability projects…
The Google Cloud partner ecosystem is critical to helping our customers act sustainably today. A new whitepaper produced in partnership with Enterprise Strategy Group shares real-world solutions that could make an immediate impact — not in the next decade, but right now.
…and shared stories of innovative startups changing the game with Google Cloud.
Take Enexor and its partners, who are producing clean and sustainable energy from discarded plastics and agro-waste. The blog from Lee Jestings, Enexor Founder & CEO, shares how Google for Startups got them started, and which Google Cloud tools help them build predictive models. Check out their story.
Or Nuuly, the rental and resale business created by the URBN portfolio, which also includes Urban Outfitters, Anthropologie, and Free People. In the blog you can read how Nuuly is using technology to provide a sustainable experience to employees and customers — from upcycling clothing, to recyclable and reusable packaging.
Whether you’re a startup, scientist, executive or developer, at Google Cloud we’ll continue to work hard to help make your digital transformation a sustainable one.
Learn more about our sustainability work here, and don’t miss the inaugural Cloud Sustainability Summit this June. Register now.
3546
Of your peers have already watched this video.
1:30 Minutes
The most insightful time you'll spend today!
See How Rémy Cointreau Drives Customer Centricity with SAP on Google Cloud
Rémy Cointreau is a French, family-owned business group whose origins date back to 1724. Rémy Cointreau is working to be a more customer centric organization. In order to fulfill this goal and to modernize, they determined they needed to get away from infrastructure management and decided to move their SAP landscape to Google Cloud.
Additionally Rémy Cointreau wanted to become more data centric. Learn how operations that used to take five weeks now take five minutes. Learn how Rémy Cointreau is leveraging live data analysis and is preparing for the future with SAP on Google Cloud.
Payhawk Becomes a Unicorn with Google Cloud-Powered Automated Financing Software

2732
Of your peers have already read this article.
3:30 Minutes
The most insightful time you'll spend today!
For far too long, managing employee expenses has been a time-consuming process that requires manual data entry and reconciliation to bridge the gap between business bank accounts and ERP systems. In the absence of an integrated workflow, finance teams use multiple systems to manage credit card and cash payments, and finding receipts. In most cases, they also lack real-time visibility into company spending.
The complexity grows exponentially as businesses expand, especially into new regions. Extra administration required to manage new bank accounts, card issuers, and local accounting systems impedes decision making and negatively impacts revenues and growth. Businesses of all sizes struggle with this, but it can be especially challenging for medium to large enterprises.
Payhawk set out to help businesses overcome these challenges when we founded the company in 2018. We combine VISA company cards, reimbursable expenses, and accounts payable into a single product. Our customers can automate manual processes, maximize efficiency, and accelerate business expansion.

Setting up our first cloud cluster in less than a week
To support growth and attract investment we were keen to launch our solution on a scalable, future-proof IT architecture that didn’t require extensive technical support. This is where Google Cloud made a big impression, especially the user interface and documentation which massively reduces the resources required to set up clusters and put them into production.
I’m a CTO, not a DevOps specialist, but in less than a week I was able to set up a secure, reliable operating infrastructure. This enabled us to fast-track our application development and we were able to issue our first card in just eight months. Our Google Cloud partner, Cloud Office also gave us valuable assistance, guiding us through the deployment process and advising on Google Cloud’s extensive range of solutions.
Google Kubernetes Engine (GKE) played a critical role, accelerating the deployment and management of our cloud native applications. We use Cloud SQL as our database while other important tools include Cloud Memorystore, Vision AI, Cloud Storage and Artifact Registry for our wider data storage and application needs. With Firebase we’ve been able to build a notification system for mobile devices.
Another incentive is that most other cloud solutions require add-on services to build and keep your product live. With Google Cloud, all the services that Payhawk needs including logging, metrics, monitoring of resources, and utilization of CPU memory come as standard.
For instance, I was really impressed by Google Cloud’s operations suite, which includes Cloud Logging and Cloud Monitoring. If there are any anomalies in our cloud architecture, we can track and resolve them with minimal disruption to our operations. This also removes the need to invest in an additional observability solution.
Reliability that builds customer trust
Google Cloud also supports Payhawk’s mission to put customers at the center of our organization. Thanks to Google Cloud error reporting and tracking and Google Cloud single sign on, Payhawk’s engineering team can anticipate customer issues and correct them in less than one hour. Trust is everything, and Google Cloud gives us the tools to boost customer satisfaction and build long-term relationships.
As a young business, managing costs is also a priority. The Google for Startups Cloud Program, which includes credits for Google software and tools, enabled us to push the business forward without having to worry about financing our infrastructure, especially in the first year. This gave us breathing room to work through funding, application development, and the onboarding of our first customers.
In addition, Google Cloud gives us confidence that we can grow the business fast. In most months we have seen more than 10% growth — in some cases it’s been 20%. In the first half of 2022, the business doubled in size, but Google Cloud gave us the flexibility to scale our infrastructure, adding storage, memory, and processing power as we onboarded new customers. The pricing model is also generous so that we can grow our revenues while keeping control of operational expenditure.
Since launch we have acquired a valuable mix of customers from startups to large businesses that want to reduce the costs of their expenses programs and increase employee satisfaction. They include ATU, a German automobile servicing company, which has successfully digitized its entire procurement process, and Discordia, a Bulgarian logistics business with 10,000 trucks, which has issued Payhawk cards to all its drivers.
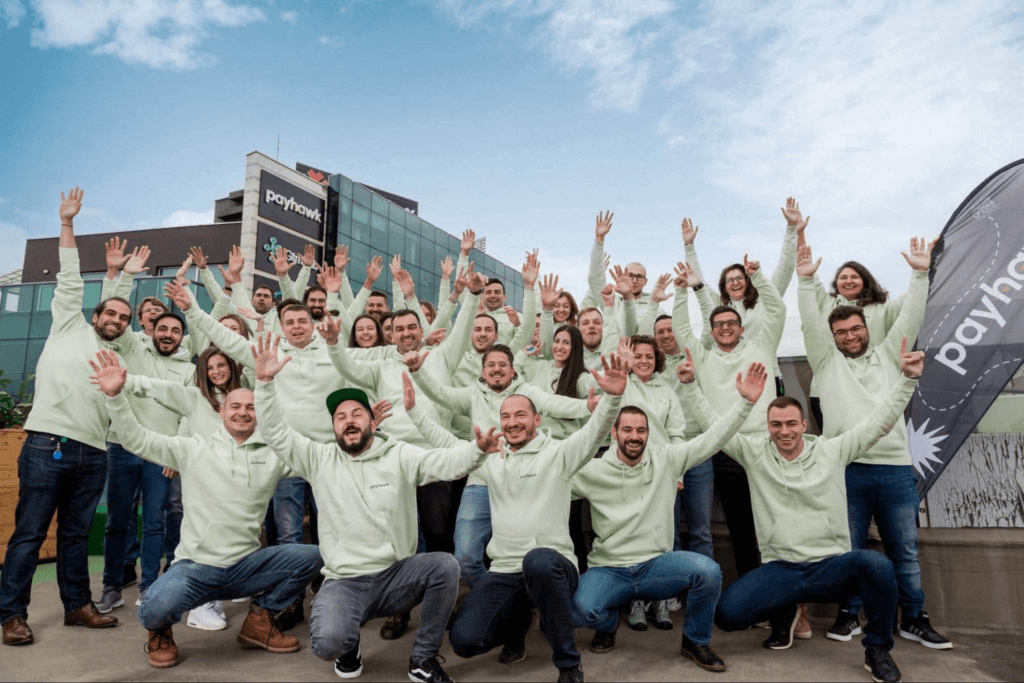
Looking to the future, it’s no exaggeration to say that Google Cloud is a foundation of our business and has given investors confidence in our operations. From a first seeding round of €3 million, early this year we closed a Series B extension of $100 million. This gives us a valuation of $1bn and makes Payhawk the first ever Bulgarian unicorn.
We now operate in 32 countries in Europe and the US, and plan to double our team by the end of the year. It feels like we’ve come a long way since we first started using Google Cloud, and I’m thrilled that we have Google Cloud as a global technology partner supporting our mission to transform expense management and financial operations worldwide.
If you want to learn more about how Google Cloud can help your startup, visit our page here to get more information about our program, and sign up for our communications to get a look at our community activities, digital events, special offers, and more.
Making Weather Predictions Easy with Weather Research and Forecasting (WRF) Models on Google Cloud!

3586
Of your peers have already read this article.
6:00 Minutes
The most insightful time you'll spend today!
Weather forecasting and climate modeling are two of the world’s most computationally complex and demanding tasks. Further, they’re extremely time-sensitive and in high demand — everyone from weekend travelers to large-scale industrial farming operators wants up-to-date weather predictions. To provide timely and meaningful predictions, weather forecasters usually rely on high performance computing (HPC) clusters hosted in an on-premises data center. These on-prem HPC systems require significant capital investment and have high long-term operational costs. They consume a lot of electricity, have largely fixed configurations, and the underlying computer hardware is replaced infrequently.
Using the cloud instead offers increased flexibility, constantly refreshed hardware, high reliability, geo-distributed compute and networking, and a “pay for what you use” pricing model. Ultimately, cloud computing allows forecasters and climate modelers to provide timely and accurate results on a flexible platform using the latest hardware and software systems, in a cost effective manner. This is a big shift compared with traditional approaches to weather forecasting, and can appear challenging. To help, weather forecasters can now run the Weather Research and Forecasting (WRF) modeling system easily on Google Cloud using the new WRF VM image from Fluid Numerics, and achieve the performance of an on-premises supercomputer for a fraction of the price. With this solution, weather forecasters can get a WRF simulation up and running on Google Cloud in less than an hour!
A closer look at WRF
Weather Research and Forecasting (WRF) is a popular open-source numerical weather prediction modeling system used by both researchers and operational organizations. While WRF is primarily used for weather and climate simulation, teams have extended it to support interactions with chemistry, forest fire modeling, and other use cases. WRF development began in the late 1990s through a collaboration between the National Center for Atmospheric Research (NCAR), National Oceanic and Atmospheric Administration (NOAA), U.S. Air Force, Naval Research Laboratory, University of Oklahoma, and the Federal Aviation Administration. The WRF community comprises more than 48,000 users spanning over 160 countries, with the shared goal of supporting atmospheric research and operational forecasting.
The Google Cloud WRF image is built using Google’s MPI best practices for HPC, with the exception that hyperthreading is not disabled by default, and is easily integrated with other HPC solutions on Google Cloud, including SchedMD’s Slurm-GCP. Normally, installing WRF and its dependencies is a time consuming process. With these new WRF VM images, deploying a scalable HPC cluster with WRF v4.2 pre-installed is quick and easy with our Codelab. OpenMPI 4.0.2 was used throughout this work. Google has had good success with Intel MPI, and we intend to study whether further performance gains can be achieved in this context.
Optimizing WRF
Determining the optimal architecture and build settings for performance and cost was a key part of the process in developing the WRF images. We evaluated how to select the ideal compiler, right CPU platform, and the best file system for handling file IO, so you don’t have to. As a test case for assessing performance, we used the CONUS 2.5km benchmark.
Below, the CONUS 2.5km runtime and cost figure shows the run time required for simulating WRF over a two-hour forecast using 480 MPI ranks (a way of numbering processes) for different machine types available on Google Cloud. For each machine type, we’re showing the lowest measured run time from a suite of tests that varied compiler, compiler optimizations, and task affinity.
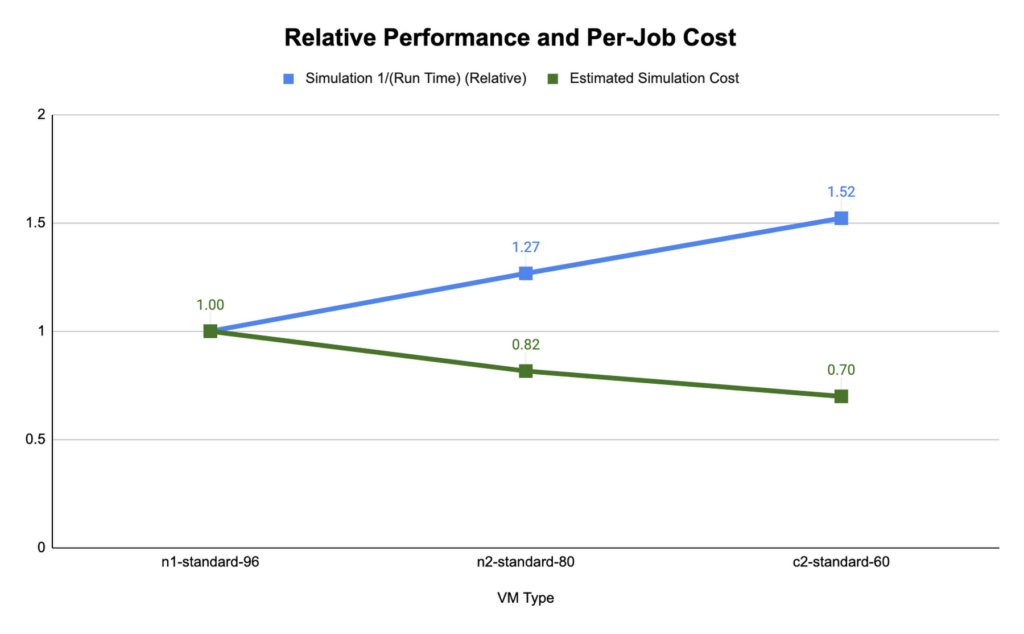
We found that compute-optimized c2 instances provided the shortest run time. The Slurm job scheduler allows you to map the MPI tasks to compute hardware using task affinity flags. When optimizing the runtime and cost for each machine type, we compared using srun –map-by core –bind-to core to launch WRF, which maps each MPI process to a physical core (two vCPU per MPI rank), and srun –map-by thread –bind-to thread, which maps each MPI process to a single vCPU. Mapping by core and binding MPI ranks to cores is akin to disabling hyperthreading.
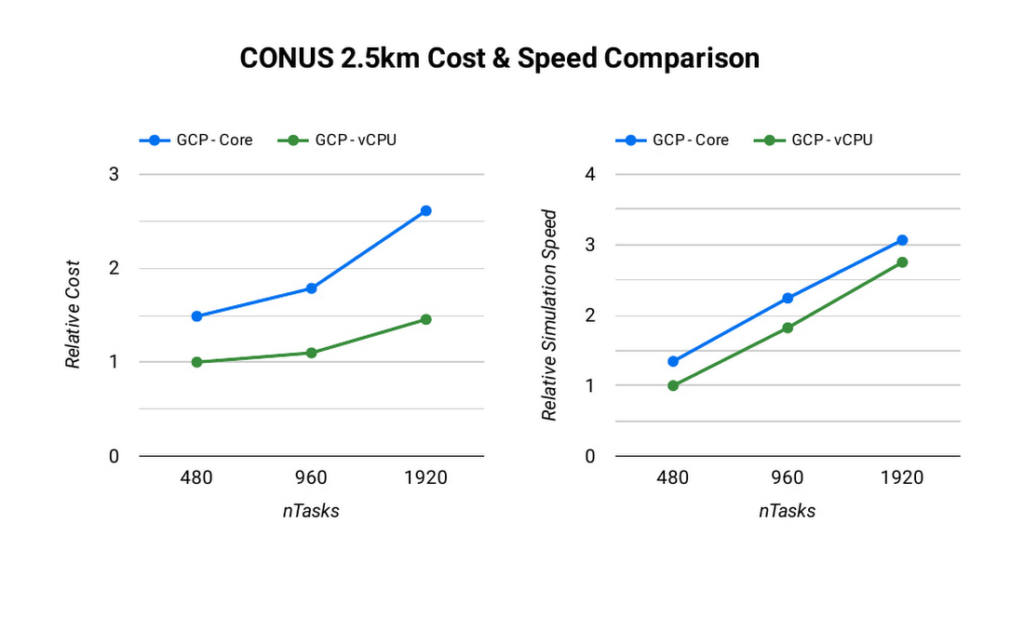
The ideal simulation cost and runtime for CONUS 2.5km for each platform is found when each MPI rank is subscribed to each vCPU. When binding to vCPUs, half as many compute resources are needed when compared to binding to physical cores lowering the per-second cost for the simulation. For CONUS 2.5km, we also found that although mapping MPI ranks to cores results in reduced runtime for the same number of MPI ranks, the performance gains are not significant enough to outweigh the cost savings. For this reason, the WRF-GCP solution does not disable hyperthreading by default.
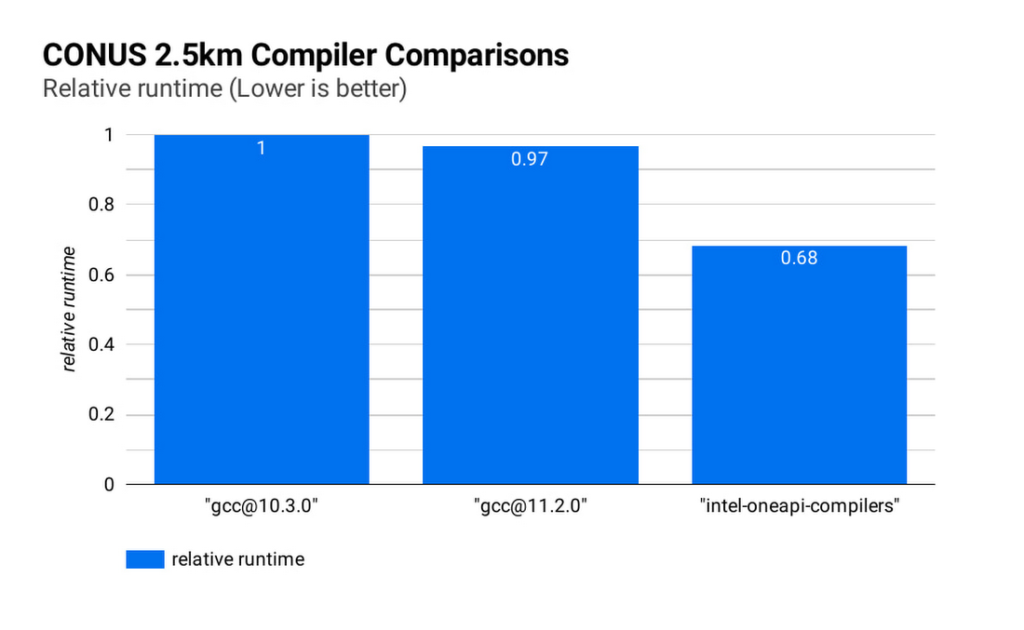
Runtime and simulation cost can be further reduced by selecting an ideal compiler: the figure below (CONUS 2.5km Compiler Comparisons) shows the simulation runtime for the WRF CONUS 2.5km benchmark on eight c2-standard-60 instances, using GCC 10.30, GCC 11.2.0 and the Intel® OneAPI® compilers (v2021.2.0). In all cases, WRF is built using level 3 compiler optimizations and Cascade Lake target architecture flags. By compiling WRF with the Intel® OneAPI® compilers, the WRF simulation runs about 47% faster than the GCC builds, and at about 68% of the cost, on the same hardware. We’ve used OpenMPI 4.0.2 with each of the compilers as the MPI implementation in this work. With other applications, Google has seen good performance with Intel MPI 2018, and we intend to investigate performance comparisons with this and other MPI implementations.
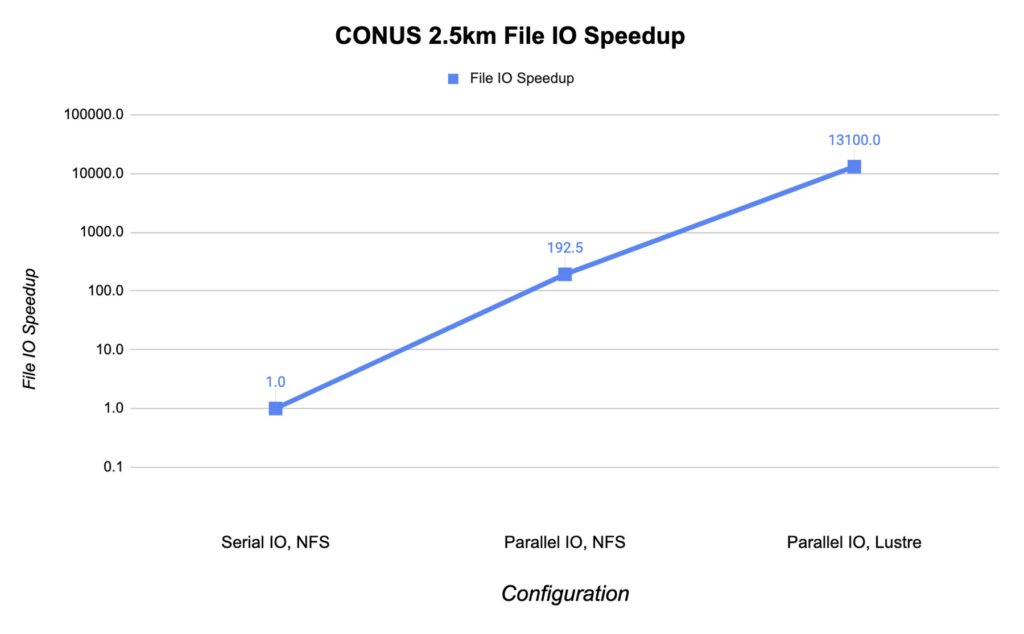
File IO in WRF can become a significant bottleneck as the number of MPI ranks increases. Obtaining the optimal file IO performance requires using parallel file IO in WRF and leveraging a parallel file system such as Lustre.
Below, we show the speedup in file IO activities relative to serial IO on an NFS file system. For this example, we are running the CONUS 2.5km benchmark on c2-standard-60 instances with 960 MPI ranks. By changing WRF’s file IO strategy to parallel IO, we accelerate file IO time by a factor of 60.
We further speed up IO and reduce simulation costs by using a Lustre parallel file system deployed from open-source Lustre Terraform infrastructure-as-code from Fluid Numerics. Lustre is also available with support from DDN’s EXAScaler solution in the Google Cloud Marketplace. In this case, we use four n2-standard-16 instances for the Lustre Object Storage Server (OSS) instances, each with 3TB of Local SSD. The Lustre Metadata Server (MDS) is an n2-standard-16 instance with a 1TB PD-SSD disk. After mounting the Lustre file system to the cluster, we set the Lustre stripe count to 4 so that file IO can be distributed across the four OSS instances. By switching to the Lustre file system for IO, we speed up file IO by an additional factor of 193, which is orders of magnitude faster than a single NFS server with serial IO.
Adding compute resources and increasing the number of MPI ranks reduces the simulation run time. Ideally, with perfect linear scaling, doubling the number of MPI ranks would cut the simulation time in half. However, adding MPI ranks also increases communication overhead, which can increase the cost per simulation. The communication overhead is due to the increased amount of communication necessitated by splitting the problem more finely across more machines.
To assess the scalability of WRF for the CONUS 2.5km benchmark, we can execute a series of model forecasts where we successively double the number of MPI ranks. Below, we show two- hour forecasts on the c2-standard-60 instances with the Lustre file system, varying the number of MPI ranks from 480 to 1920. In all of these runs, MPI ranks are bound to vCPUs so that the number of vCPUs dedicated to each simulation increases with the increase in MPI ranks. While many HPC workloads run best with simultaneous multithreading (SMT) disabled, we find the best performance for CONUS 2.5km with SMT enabled. Thus, the number of MPI ranks in our runs equals the total number of vCPUs.
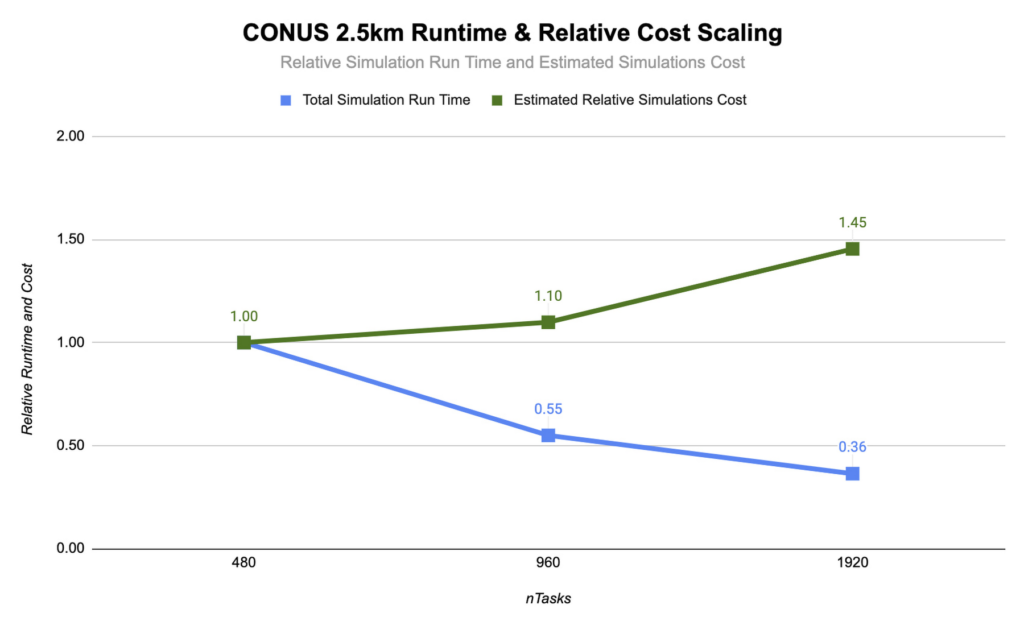
As you can see, the CONUS 2.5km Runtime & Cost Scaling figure shows that the run time (blue bars) decreases as the number of MPI ranks and the amount of compute resources increases, at least up to 1920 ranks. When transitioning from 480 to 960 MPI ranks, the run time drops, yielding a speedup of about 1.8x. Doubling again to 1920 MPI ranks, though, we obtained an additional speedup of just 1.5x. This declining trend in the speedup with increasing MPI ranks is a signature of MPI overhead, which increases with more MPI ranks.
Determining your best fit
Most tightly-coupled MPI applications such as WRF exhibit this kind of scaling behavior, where scaling efficiency decreases with increasing MPI ranks. This makes assessing cost-scaling alongside performance-scaling critical when considering Total Cost of Ownership (TCO). Thankfully, per-second billing on Google Cloud makes this kind of analysis a little bit easier. As shown above, a second doubling of the count from 960 cores to 1920 cores can provide an additional 1.5x speedup, but at a 32% higher cost. In some circumstances, this faster turnaround may be needed and worth the extra cost.
If you want to get started with WRF quickly and experiment with the CONUS 2.5km benchmark, we’ve encapsulated this deployment in Terraform scripts and prepared an accompanying codelab.
You can learn more about Google Cloud’s high performance computing offerings at https://cloud.google.com/hpc, and you can find out more about Google’s partner Fluid Numerics at https://www.fluidnumerics.com.
Qlik and Google Cloud Combo: Extending Integration of SAP Data on BigQuery
5480
Of your peers have already read this article.
2:00 Minutes
The most insightful time you'll spend today!
If your organization is one of the 52% of SAP customers whose top analytics pain point is data integration1, Google Cloud has got you covered. By working with partners like Qlik, we are expanding our integration options and bringing real-time replication capability for SAP to BigQuery.
Integrated data for accelerated insights
BigQuery—our fully managed, enterprise data warehouse that can scale up to petabytes on demand and execute queries in seconds—allows SAP customers to consolidate enterprise data silos and confidently derive more use and value from their data. Customers can accelerate and simplify the delivery of SAP data on BigQuery with the latest Qlik Data Integration platform offering for Google Cloud which allows data integration using an automated, near real-time data pipeline through Qlik Replicate, whether data originates from legacy SAP environments, SAP HANA, or SAP application servers. Additionally, Qlik Compose for Data Warehouses can be used to easily generate and automate logical data models from SAP directly in BigQuery freeing up more time for data analysts to leverage advanced built-in capabilities such as BigQuery ML to derive greater value and insights using standard SQL without the need for advanced programming expertise.
Delivering faster results with real-time
Traditional extract-transform-load (ETL) solutions operate on a batch basis, pulling data sets from SAP daily, hourly, or every minute. These tools often require manual mapping of multiple data fields so that data flows accurately. Given SAP’s highly complex table relationships, in which a single transaction can result in multiple changes, this can be a time consuming and tedious process. ETL can also increase the burden on your SAP systems.
Qlik Replicate simplifies this with its intuitive user interface where you can set up real-time data replication between SAP and BigQuery, eliminating the need for manual coding. And, to prevent system overhead, as soon as a new transaction is entered into SAP, the resulting data is replicated into BigQuery in a process known as change data capture (CDC) from SAP’s log layer. This means that data transfer can benefit from high performance with minimal impact on the source system’s resources. Read our latest white paper to learn how to extract SAP data into BigQuery leveraging Qlik Replicate.
Solution expertise for all core SAP workloads
It doesn’t matter what database your SAP system runs on, Qlik Replicate supports all core SAP systems. It automates real-time data replication and decodes SAP’s complex, application-specific data structures into formats that flow smoothly into BigQuery. This ensures that anyone who depends on data analytics has the most current and relevant SAP data they need. For its robust solution capabilities Qlik has received a new “SAP on Google Cloud Expertise” designation for supporting:
- Fast onboarding and accelerated replication of SAP data into Google Cloud
- Real-time and continuous data replication from SAP applications to BigQuery
- Support for all core SAP modules and a broad set of data sources
- Automated data integration, which cuts resource requirements for initial delivery and ongoing maintenance
Proven customer results
Many SAP customers have experienced the benefits of leveraging Qlik alongside BigQuery for data analytics and AI at scale, including German luxury department store chain Breuninger. In order to meet its customers’ growing and changing expectations,Breuninger needed to accelerate its time to insight from data sources across a highly dispersed landscape of on-premises databases and systems, including SAP. The company uses Qlik Replicate to feed corporate data from modules in its SAP system into BigQuery and integrate its varying on-premises databases with the Google Cloud environment. This has yielded game-changing, real-time customer insights for the retailer.
What could your business do with faster, more integrated insights? Learn more about BigQuery for SAP customers and also how Qlik and Google Cloud can help you modernize and automate data integration and analytics.
More Relevant Stories for Your Company
A Year of Going Carbon-free! Google’s Road to Sustainability Looks Promising
Last year, we announced our most ambitious sustainability goal yet: to operate everywhere on 24/7 carbon-free energy by 2030. We’ve set this goal to ensure that Google Cloud continues to be the cleanest cloud in the industry, and to show that full-scale decarbonization of electricity use is possible. Since setting our target,



The Transformative Journeys of Financial Firms on Google Cloud: Watch Video
The reliance on cloud-based architectures, high performance computing, big data and more are accelerating in the banking, capital, insurance and financial services industries. Google Cloud had a strong role in transforming many businesses especially in the pandemic to smoothly transition into the digital space and understand their customers. Two years

VM End-to-end: Series Transcript on Conversation on VMs and their Role to Cloud-native Future
VMs and their relevance to a cloud-native future: A conversation Last week, we published the first episode of VM End-to-End, a series of curated conversations between a “VM skeptic” and a “VM enthusiast”. Join Brian and Carter as they explore why VMs are some of Google’s most trusted and reliable offerings, and how
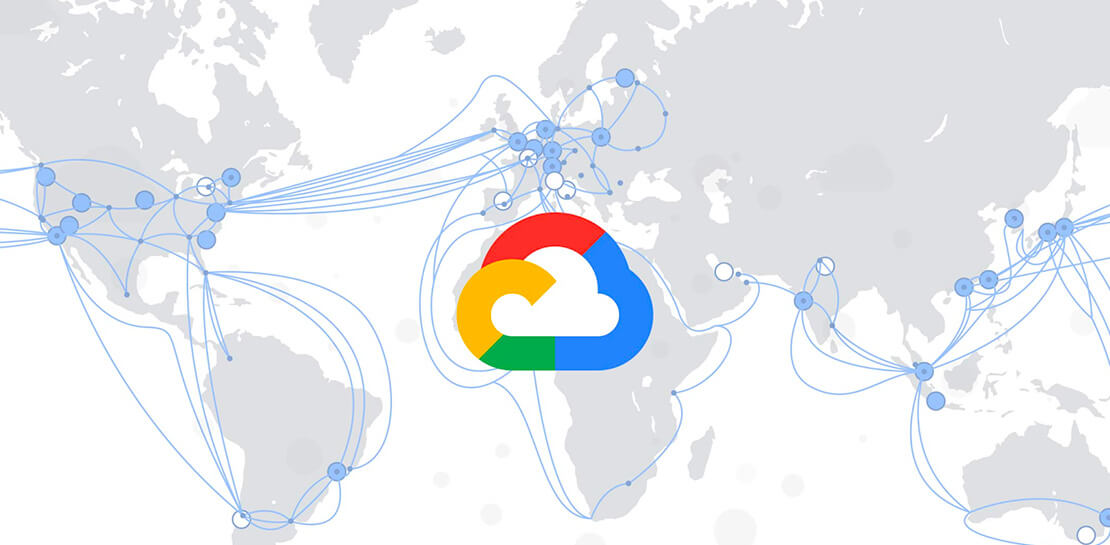
Linking the Middle East with Southern Europe and Asia: Google’s New Subsea Cables to Be Ready by 2024!
Today, we’re announcing that we are collaborating with Sparkle and others to build and operate two submarine cable systems linking the Middle East with southern Europe and Asia: the Blue Submarine Cable System connecting Italy, France, Greece, and Israel; and the Raman Submarine Cable System connecting Jordan, Saudi Arabia, Djibouti, Oman and
