





Budget-Friendly Log Management: Four Steps to Cost Optimization in Google Cloud

1221
Of your peers have already read this article.
4:30 Minutes
The most insightful time you'll spend today!
As part of our ongoing series on cost management for observability data in Google Cloud, we’re going to share four steps for getting the most out of your logs while on a budget. While we’ll focus on optimizing your costs within Google Cloud, we’ve found that this works with customers with infrastructure and logs on prem and in other clouds as well.
Step 1: Analyze your current spending on logging tools
To get started, create an itemized list of what volume of data is going where and what it costs. We’ll start with the billing report and the obvious line items including those under Operations Tools/Cloud Logging:
- Log Volume – the cost to write log data to disk once (see our previous blog post for an explanation)
- Log Storage Volume – the cost to retain logs for more than 30 days
If you’re using tools outside Cloud Logging, you’ll also need to include any costs related to these solutions. Here’s a list to get you started:
- Log vendor and hardware costs — what are you paying to observability vendors? If you’re running your own logging solution, you’ll want to include the cost of compute and disk.
- If you export logs within Google Cloud, include Cloud Storage and BigQuery costs
- Processing costs — consider the costs for Kafka, Pub/Sub or Dataflow to process logs. Network egress charges may apply if you’re moving logs outside Google Cloud.
- Engineering resources dedicated to managing your logging tools across your enterprise often are significant too!
Step 2: Eliminate waste — don’t pay for logs you don’t need
While not all costs scale directly with volume, optimizing your log volume is often the best way to reduce spend. Even if you are using a vendor with a contract that locks you into a fixed price for a period of time, you may still have costs in your pipeline that can be reduced by avoiding wasteful logs such as Kafka, Pub/Sub or Dataflow costs.
Finding chatty logs in Google Cloud
The easiest way to understand which sources are generating the highest volume of logs within Google Cloud is to start with our pre-built dashboards in Cloud Monitoring. To access the available dashboards:
- Go to Monitoring -> Dashboards
- Select “Sample Library” -> “Logging”
This blog post has some specific recommendations for optimizing logs for GKE and GCE using prebuilt dashboards.
As a second option, you can use Metrics Explorer and system metrics to analyze the volume of logs. For example, type “log bytes ingested” into the filter. This specific metric corresponds to the Cloud Logging “Log Volume” charge. There are many ways to filter this data. To get a big picture, we often start with grouping by both “resource_type” and “project_id”.
To narrow down the resource type in a particular project, add a “project_id” filter. Select “sum” under the Advanced Options -> Click on Aligner and select “sum”. Sort by volume to see the resources with the highest log volume.
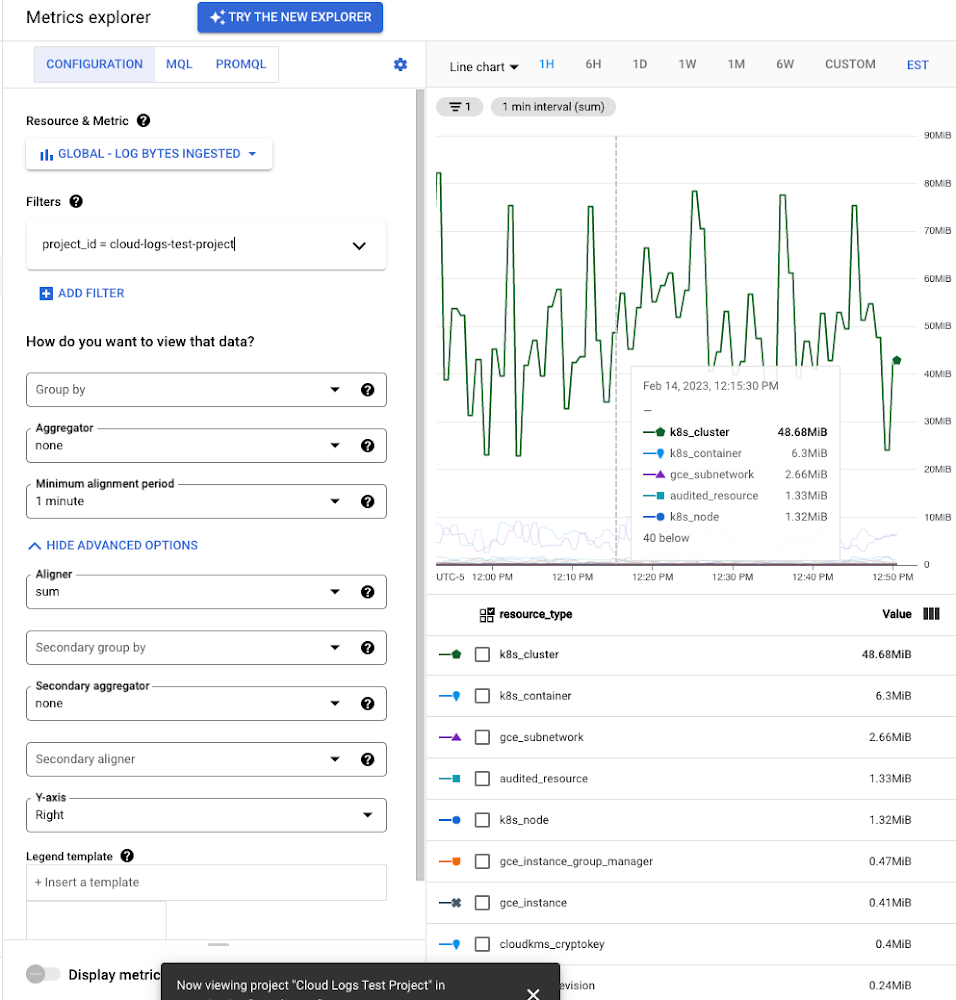
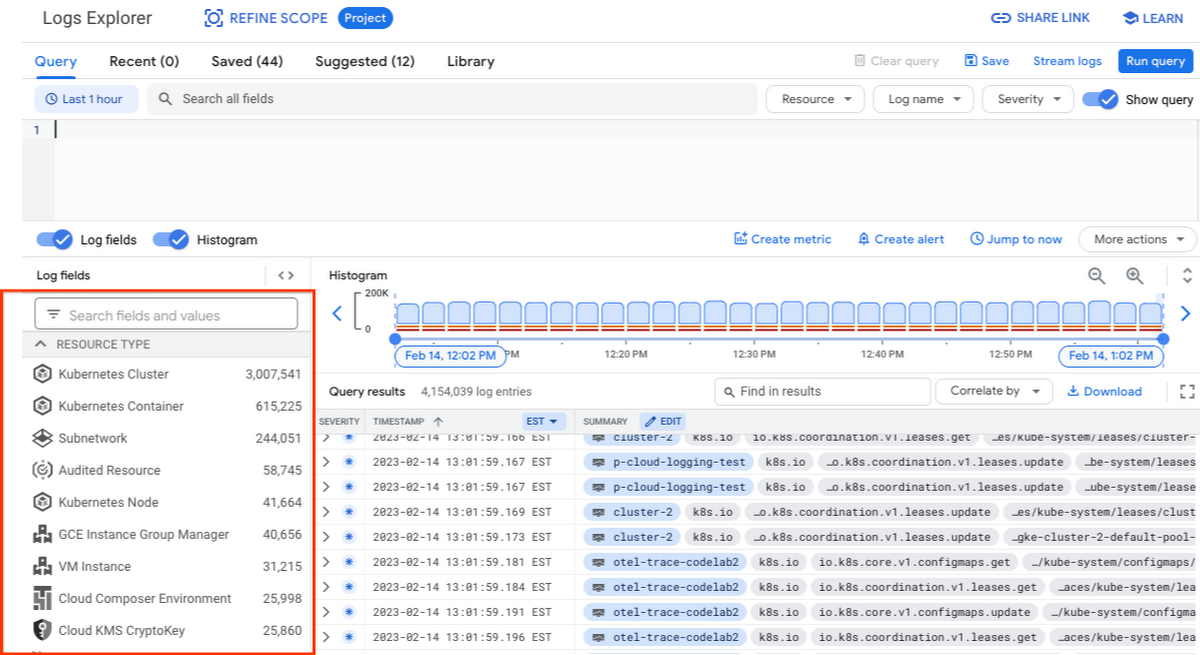
While these rich metrics are great for understanding volumes, you’ll probably want to eventually look at the logs to see whether they’re critical to your observability strategy. In Logs Explorer, the log fields on the left side help you understand volumes and filter logs from a resource type.
Reducing log volume with the Logs Router
Now that we understand what types of logs are expensive, we can use the Log Router and our sink definitions to reduce these volumes. Your strategy will depend on your observability goals, but here are some general tools we’ve found to work well.
The most obvious way to reduce your log volume is not to send the same logs to multiple storage destinations. One common example of this is when a central security team uses an aggregated log sink to centralize their audit logs but individual projects still ingest these logs. Instead, use exclusion filters on the _Default log sink and any other log sinks in each project to avoid these logs. Exclusion filters also work on log sinks to BigQuery, Pub/Sub, or Cloud Storage.
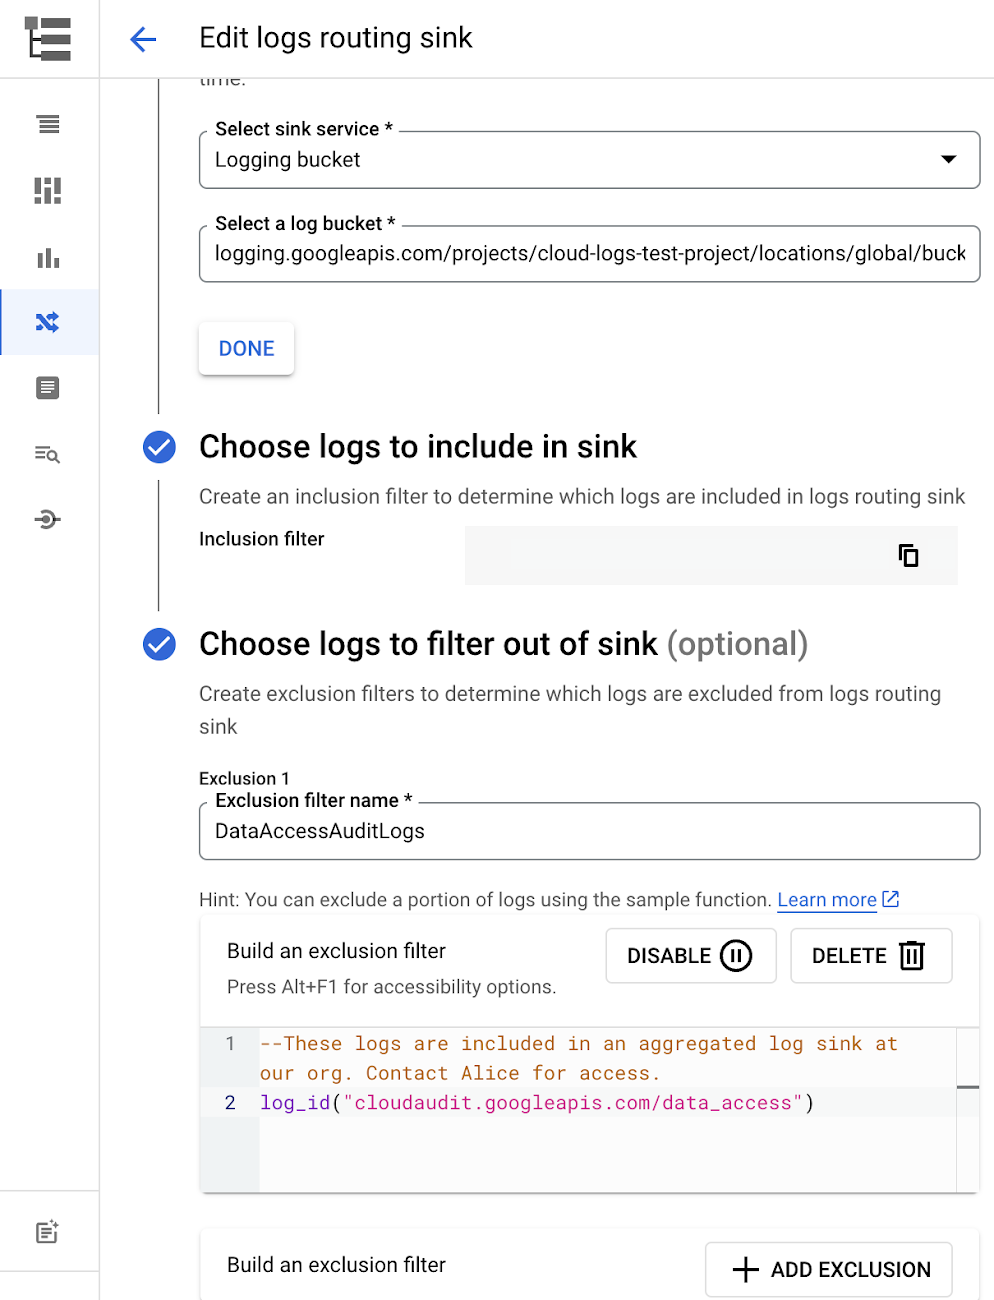
Similarly, if you’re paying to store logs in an external log management tool, you don’t have to save these same logs to Cloud Logging. We recommend keeping a small set of system logs from GCP services such as GKE in Cloud Logging in case you need assistance from GCP support but what you store is up to you, and you can still export them to the destination of your choice!
Another powerful tool to reduce log volume is to sample a percentage of chatty logs. This can be particularly useful with 2XX log balancer logs, for example. This can be a powerful tool, but we recommend you design a sampling strategy based on your usage, security and compliance requirements and document it clearly.
Step 3: Optimize costs over the lifecycle of your logs
Another option to reduce costs is to avoid storing logs for more time than you need them. Cloud Logging charges based on the monthly log volume retained per month. There’s no need to switch between hot and cold storage in Cloud Logging; doubling the default amount of retention only increases the cost by 2%. You can change your custom log retention at any time.
If you are storing your logs outside of Cloud Logging, it is a good idea to compare the cost to retain logs and make a decision.
Step 4: Setup alerts to avoid surprise bills
Once you are confident that the volume of logs being routed through log sinks fit in your budget, set up alerts so that you can detect any spikes before you get a large bill. To alert based on the volume of logs ingested into Cloud Logging:
- Go to the Logs-based metrics page. Scroll down to the bottom of the page and click the three dots on “billing/bytes_ingested” under System-defined metrics.
- Click “ Create alert from metric”
- Add filters (For example: use resource_id or project_id. This is optional).
- Select the logs based metric for the alert policy.
You can also set up similar alerts on the volume for log sinks to Pub/Sub, BigQuery or Cloud Storage.
Conclusion
One final way to stretch your observability budget is to use more Cloud Operations. We’re always working to bring our customers the most value possible for their budget such as our latest feature, Log Analytics, which adds querying capabilities but also makes the same data available for analytics, reducing the need for data silos. Many small customers can operate entirely on our free tier. Larger customers have expressed their appreciation for the scalable Log Router functionality available at no extra charge that would otherwise require an expensive event store to process data. So it’s no surprise that a 2022 IDC report showed that more than half of respondents surveyed stated that managing and monitoring tools from public cloud platforms provide more value compared to third-party tools. Get started with Cloud Logging and Monitoring today.
Bigbasket: Delivering Groceries Across 25 Cities in India

7329
Of your peers have already read this article.
1:30 Minutes
The most insightful time you'll spend today!
When Bigbasket was founded in December 2011, it guaranteed to deliver goods within a one-hour delivery slot of its customers’ choosing or it would refund them 10 percent of their orders. The company also introduced an express service, delivering groceries within 90 minutes of an order being placed.
Bigbasket needed a mapping platform that could help it meet its delivery times, and offer a familiar interface to customers. MediaAgility, a digital consulting company, recommended Google Maps Platform to Bigbasket.
When customers use the Bigbasket mobile app to place orders, they select their locations on a Google Map. The prices and availability of groceries varies according to location, so a customer’s location determines the cost of the order and what can be ordered.
Google Maps Platform Results
- Bigbasket handles more than one million orders per month, and delivers in more than two dozen cities in India
- Bigbasket now has more than four million customers
- Orders are delivered on time, increasing customer loyalty
It is also used to determine driver routes. Bigbasket used the Maps Javascript API to build a web-based app for the company’s backend that tracks all orders and delivery progress. Dispatchers use the Directions API to match drivers with orders and customers, and the Distance Matrix API to get estimate the time of arrival for deliveries. As dispatchers track the progress of deliveries on the map, they can tweak routes as necessary.
“We’ve built Bigbasket from the ground up using Google Maps Platform. It makes sure we have the right customer locations and deliver to them on time. We couldn’t have started Bigbasket without Google Maps. It helps us to be fast and efficient, and make sure our customers get what they’ve ordered quickly,” said Pramod Jajoo, Chief Technology Officer, Bigbasket
Groww’s Google Cloud-Powered Platform: The Key to Secure and Successful Investing

2945
Of your peers have already read this article.
4:00 Minutes
The most insightful time you'll spend today!
Groww makes investments simple and accessible, using Google Kubernetes Engine to ensure a reliable platform for customers, and makes data-backed decisions to grow its business with BigQuery.
About Groww
Headquartered in Bangalore, Groww is India’s fast-growing online investment platform that offers a simple and easy way to invest in stocks, direct mutual funds, IPOs, ETFs, and digital gold. Its mission is to make investing as intuitive and accessible as ecommerce.

Google Cloud results
- Reduces hardware costs with Preemptable Virtual Machines
- Enables a lean DevOps team with Google Cloud
- Analyzes data effectively and quickly for agile business growth
Investing is one way to ensure financial security. However, the thought of it can be a daunting one, especially for people without any prior experience. With a mission to make investment simple for digital natives in India, Groww was launched in 2016.
“We noticed that many people were on social media, booking cabs, and ordering food online, but the same people were not investing, despite having the means to do so,” says Singh. This observation led to a lightbulb moment for the team, and they realized that in order to appeal to the millennial, mobile-savvy generation, they had to create an investment platform that was as easy to use as an ecommerce platform.
Managing unpredictable spikes with Google Kubernetes Engine
As with any platform, there are bound to be peak and non-peak hours when it comes to traffic. For Groww, regular spikes take place in the early mornings, or in the evenings when people are more relaxed having come home from work. But the nature of the fintech industry is a volatile one. Investors are only human, and their investment decisions can be swayed quickly by the news. As such, spikes in traffic can happen at the most unpredictable times. To cope with this unpredictability, Groww uses Google Kubernetes Engine to scale up and down automatically to meet the required capacity around the clock. This also helps the company save costs, as it pays only for what is needed.
“No matter how much of an expert you are, you can never predict when traffic on the platform will be heavy,” says Singh. “Google Kubernetes Engine helps ensure that we never run out of capacity, without overspending on infrastructure cost.”
More recently, the investment company started using Preemptible Virtual Machines, which run at one third of its hardware cost. It also leverages Anthos to monitor and manage its backend infrastructure and to have better workload visibility. Singh shares, “We are very open to adopting new technologies, and our team is always eager to learn if we can do things better. We believe that technology is always evolving and it’s our responsibility to learn and make use of what’s available out there.”
Despite having so much running in the background, Singh explains that the company keeps a very lean DevOps team. “We’ve only got four or five people in DevOps, and that’s only possible because Google Cloud products are already able to run on their own.”
Making swift, data-backed business decisions
Infrastructure is only part of the equation for a successful business. Outside of operations, the ability to analyze data effectively is arguably the most important component for a startup to thrive. Groww leverages BigQuery to make decisions quickly and efficiently. “With BigQuery, we have a place where we can put all data, fire queries, and build dashboards almost instantly, allowing us to make business decisions quickly,” explains Singh.
The team also uses Looker Studio to clearly visualize the information generated through charts and graphs. The best part? Groww doesn’t need to spend additional time and resources setting up a large data team, since BigQuery does most of the work and in a shorter period of time. The resources saved also enables the team to focus on addressing functional requirements, rather than managing and sizing the data platform.
“From a startup perspective, BigQuery is really helpful because often setting up your own data lake can be very costly, and a distraction when the team is also busy focusing on setting up an infrastructure,” adds Singh.
Ensuring security and compliance with Google Cloud
As a fintech company, security and compliance continue to be top priorities for Groww. It chose Google Cloud as its preferred cloud provider because there are three data center replication zones in Mumbai, which means it adheres to financial regulations for keeping its user data within borders.
Moving forward, Groww plans to evolve its platform alongside its users. Singh says, “As we gain more users with different wants and needs, it will be a natural progression that the company evolves. I believe that with Google Cloud, we are well equipped to pave the way to the future.”
Vodafone Leverages Google Cloud to Aid COVID-19 Frontline with Anonymized Insights on Population Mobility

11221
Of your peers have already read this article.
1:30 Minutes
The most insightful time you'll spend today!
Editor’s note: When Europe’s largest mobile communications company, Vodafone, was asked by the European Commission to help understand population movement across the European Union and the UK to help fight COVID-19, it was able to provide anonymized mobile network-based insights to answer the call. Here’s how Vodafone, with the support of Google Cloud, rapidly mobilized the COVID-19 frontline, while respecting its customers’ privacy.
With the emergence of COVID-19 in early 2020, the European Commission—the executive branch of the European Union (EU)—knew that technology would be instrumental in its fight to control the pandemic. With various lockdowns imposed across its member states, the Commission was keen to predict and prevent the spread of COVID-19 and to manage the related social, political and financial impacts.
Mobile network data helps track COVID-19 across the EU
Mobile networks produce location data, which can be turned into useful anonymous insights to understand population movement within a geographic area. The European Commission, working with mobile industry association GSMA (Groupe Speciale Mobile Association), asked Europe’s major mobile phone operators for help in producing insights to support the fight against COVID-19. As the largest mobile network operator within the EU, Vodafone saw this as a critical opportunity to participate.
Vodafone had previous experience of using mobile network data to support pandemic research. For example, in 2019, Vodafone provided mobility pattern analysis to help track the spread of Malaria in Mozambique. And, during the early stages of the COVID-19 pandemic (prior to working with the European Commission), Vodafone assisted the Italian and Spanish governments in understanding their citizens’ mobility patterns. Vodafone had also previously offered anonymized and aggregated population mobility insights to support public transport and tourism authorities and retail organizations in a number of countries. Consequently, Vodafone was perfectly placed to play a greater role in supporting the European Commission’s response to the pandemic.
When asked to assist the European Commission, Vodafone first considered how it could safely share its data with the governing body without providing details on the individual movements of its customers. It realized it could achieve this through an elaborate set of anonymization and aggregation techniques. Insights are aggregated from a minimum of 50 users and Vodafone only shared these anonymous insights and never the actual raw data with the Commission. As specified by the EU, these insights are then presented onto a large geographical region, typically a city or a county with thousands of people living in that area.
These insights illustrate how people move, helping to determine how lockdowns and self-isolation measures were impacting behaviors.
Using Google Cloud to collate and store population mobility data
In April 2020, Vodafone began migrating its operations, including its mobile data, to Google Cloud on servers in Europe and the UK with elaborate security safeguards, including encryption, building on a previous partnership.
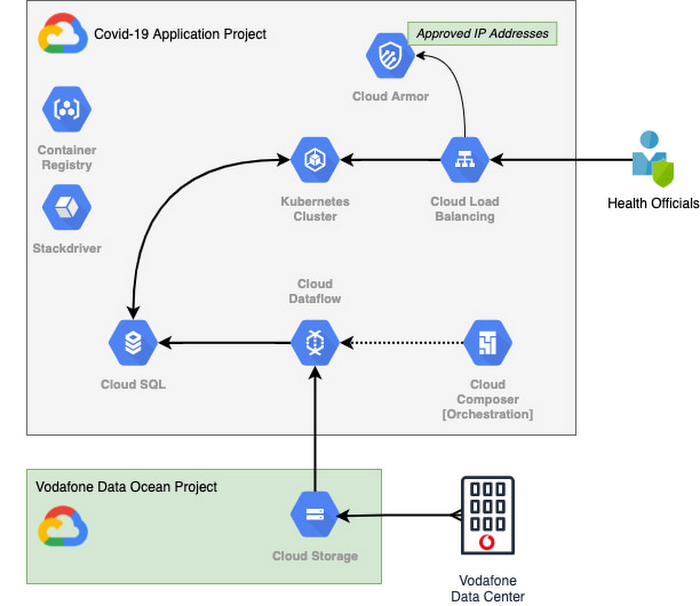
With the data residing in EU and UK data centers and not the United States, Vodafone could then retrieve anonymous insights from Google Cloud Storage instantaneously. Before supplying any information to the European Commission, however, Vodafone used Dataflow to validate the data and run a series of tests to ensure the database had accurate data, before ingesting and archiving the relevant metrics. For instant access, the data was then made available to the European Commission using a Redis database on Google Kubernetes Engine.
To ensure aggregate Vodafone customer data was always safe, secure, and anonymous, all entry points to the front-end were protected behind Google Cloud Armor, where only specific IP addresses were allowed. Using these tools, seamless data pipelines fed in predefined key performance indicators from each specified European market. While data quality measures ensured the definitions for metrics across markets were consistent and could be accurately compared.
The architecture (pictured below) shows how Vodafone integrated and anonymized its data on Google Cloud.
Live interactive dashboard shows population mobility in real-time
With its data integrated on Google Cloud, Vodafone created a live, interactive dashboard to track mobility patterns and share relevant information with the European Commission in real-time.
The European Commission Joint Research Center (JRC) was able to gather valuable information from these insights, which enabled them to see where population mobility was aiding the spread of the disease, when cross-referenced with health data. It could also assess the implications of lockdowns on different populations and forecast cross-country spreading.
Mobile data aids disease modeling for multiple stakeholders
The Vodafone data became instrumental in modeling the likely course of the disease too. For example, the University of Southampton in the UK used it to predict the outcome of different coordinated COVID-19 exit strategies across Europe. This research was published in Science Magazine in September 2020.
The Vodafone data dashboard continues to be used by individual governments, NGOs and organizations to further investigate the impacts of the pandemic and to measure the effectiveness of response strategies alongside the rollout of vaccination programs. The project also helped Vodafone win a DataIQ award for most effective stakeholder engagement.
Using the learnings from this project, Vodafone has been able to adapt its own B2B solution, called Vodafone Analytics, by adaptIng and migrating the code to work in Google Cloud Platform. This solution has been rolled out across Germany, Greece, Portugal and South Africa, and new countries are being onboarded every day. Vodafone Analytics already has more than 100 customers leveraging it for a variety of use cases—Italian fashion retailer OVS, uses it for its smart retail operation, while global real estate company, JLL, uses it to understand the footfall passing through its properties.
Working together, Vodafone and Google Cloud continue to help a range of organizations, governments, and NGOs navigate through the ongoing pandemic, optimize their operations, and help the greater good, without infringing individuals’ fundamental rights to privacy.
To learn more about Google Cloud and Vodafone, watch our full interview here.
Amadeus: Shaping the Future of Travel with Apigee

3995
Of your peers have already read this article.
3:25 Minutes
The most insightful time you'll spend today!
If you’ve taken a trip in the past 30 years, then you’ve probably used Amadeus technology. Our solutions connect over 1.5 billion travellers every year to the journeys they want, linking them via travel agents, search engines, and tour operators to over 700 airlines, 110 airports, 580,000 hotel properties, 40 car rental companies, 90 railways, and more.
In 2016, over 595 million total travel agency bookings were processed using the Amadeus distribution platform. In addition, over 175 Amadeus airline customers processed over 1.3 billion passengers using Amadeus’ Passenger Service Systems. We combine an understanding of how people travel with the development of the most complex, trusted, critical systems our customers need.
A platform for scalability and speed
In today’s crowded travel marketplace, our customers want IT solutions that can scale up to match their complex needs—whether this includes solving the challenge of ever increasing flight search volumes, delivering flight search results in milliseconds, or enabling “pop-up” check-in and bag drop from anywhere.
Amadeus operates at large scale with hundreds of thousands of transactions processed per second to deliver mission-critical services in travel. Having a scalable and secure platform is essential to continue driving solutions for our customers, and Apigee’s API management platform fulfills this objective.
At the same time, our customers also want solutions that can adapt quickly with new features and upgrades. We’re talking days, not weeks or months. Apigee provides on-premise gateways to securely expose our APIs to our customers. These can be scaled to deliver our APIs according to our business needs. Apigee’s great capacity to create rock-solid API infrastructure gives us more freedom to focus on the architectural details of the technology we create for the travel industry.
A platform for collaboration
In the fast-paced and competitive travel industry, our customers hunger for new ways of doing things. This hunger can only be met with an open and collaborative approach across the sector.
That’s why we use an open systems architecture that offers SOAP/XML and REST/JSON formatting to be entirely platform neutral. It is totally independent of language and application frameworks, making implementation fast and efficient.
But as the number of customers using our APIs grows, so does the need to shorten the time to deploy our applications to market and evolve our API strategy.
The Apigee platform is key here. For one thing, it’s always up to date with constantly evolving industry standards, in particular with security standards like OAuth.
The platform also forms the backbone for the web app development cycle for Amadeus and our customers to jointly build applications and release them in production. Ultimately, by integrating Apigee’s control plane seamlessly with our APIs, we are able to foster fully automated operations.
A platform for visibility
Understanding how our APIs are consumed is also key for us and our customers. With Apigee we are able to see this and provide them with a detailed view of API analytics. In this big data era, knowing the number of transactions, response times on APIs, or the page travellers are spending the most time on with a mobile app could be invaluable to make the informed decisions that help us maintain an edge over competitors. This also serves as a great feedback tool to closely monitor where the industry is heading.
As a leader in travel technology, we’re committed to open systems. That’s why Amadeus also works with Kubernetes. We have a strong partnership with Red Hat through its OpenShift platform, which is based on Kubernetes. Amadeus Cloud Services works with this open-source system and enables us to use automated cloud methods to deploy our services in a flexible mix of private and public clouds.
We’re excited to collaborate with players like Google and Apigee, because together we can pave the way for technology that makes better journeys and creates value for our customers, travelers, and society.
Olivier Richaud is senior manager, API management & web services, technology platforms & engineering, at Amadeus. Xavier Gardien is head of portfolio and product management, technology platforms & engineering, at Amadeus.
How Recommendation AI Helps Retailers Optimize Click-through and Conversion Rates

7084
Of your peers have already read this article.
3:00 Minutes
The most insightful time you'll spend today!
Time to go outside again, I guess. I’ll need a sun hat. Sunscreen. Maybe some new sandals? What else?
With the Recommendations AI service, I might be reminded to grab a reusable water bottle and a swimsuit. Or some after-sun aloe lotion. Good thing, cause I’ll need it.

Recommendations AI is a solution that uses machine learning to bring product recommendations to their shoppers across any catalog or client list. This service is part of our full suite of Retail solutions. When you integrate with the Retail API, you get the benefit of Google’s Product Discovery. Integrating once to reap the benefits over and over. Recommendations is the starting point, and you can easily extend into Retail Search and Vision Product Search in the upcoming future.
The Recommendations solution is fully managed, global-scale and powered by deep learning, so you can focus on a great shopping experience and let someone else worry about the infrastructure.
Compared to baseline recommendation systems used by customers, Recommendations AI showed double digit uplift in conversion and clickthrough rates in A/B experiments controlled by the customers. You can optimize for click-through, conversion or session revenue, and fine tune the models to make sure you omit out-of-stock items or duplicates, for example.

So how does it work, and how do you get started? Read on, and we’ll walk you through the pipeline, starting with the data you already have to placement in your online store.
Formula: Data -> Model -> Placement
You start with your catalog, the list of all the things (postcards, movies, pie recipes) that you want to show your customers. Then you ingest your PII-redacted user events -this is the historic event data like home page views, add to cart events and more along with real time user events. This user event is joined with the product catalog and items that allows us to construct the sequence of shoppers’ activity, thus being able to predict what the shopper has a high propensity to purchase next. The user events can come from both online activity across devices or offline store purchases
The recommendation model will return a list of products, which are the recommendations. The brains of the operation, if you will. This model is trained using all the data that you ingest, using the latest neural network models and techniques that Google has built expertise over the years in flagship products like Youtube and News, that allows us to uncover shopper intent, so it can best predict the right recommendations to show to the right people.
Every model outputs a list of product identifiers, but where do they go? They go into placements, the spots, panels, carousels on your customer’s journey interacting with your brand that you’ve set aside to highlight recommendations. A model can send recommendations to one or more placements, but each placement only receives information from one recommendation model. Your pages will then need to render the products with the right images, text or other metadata, using the product ID that is returned by the model.
What do recommendations look like?
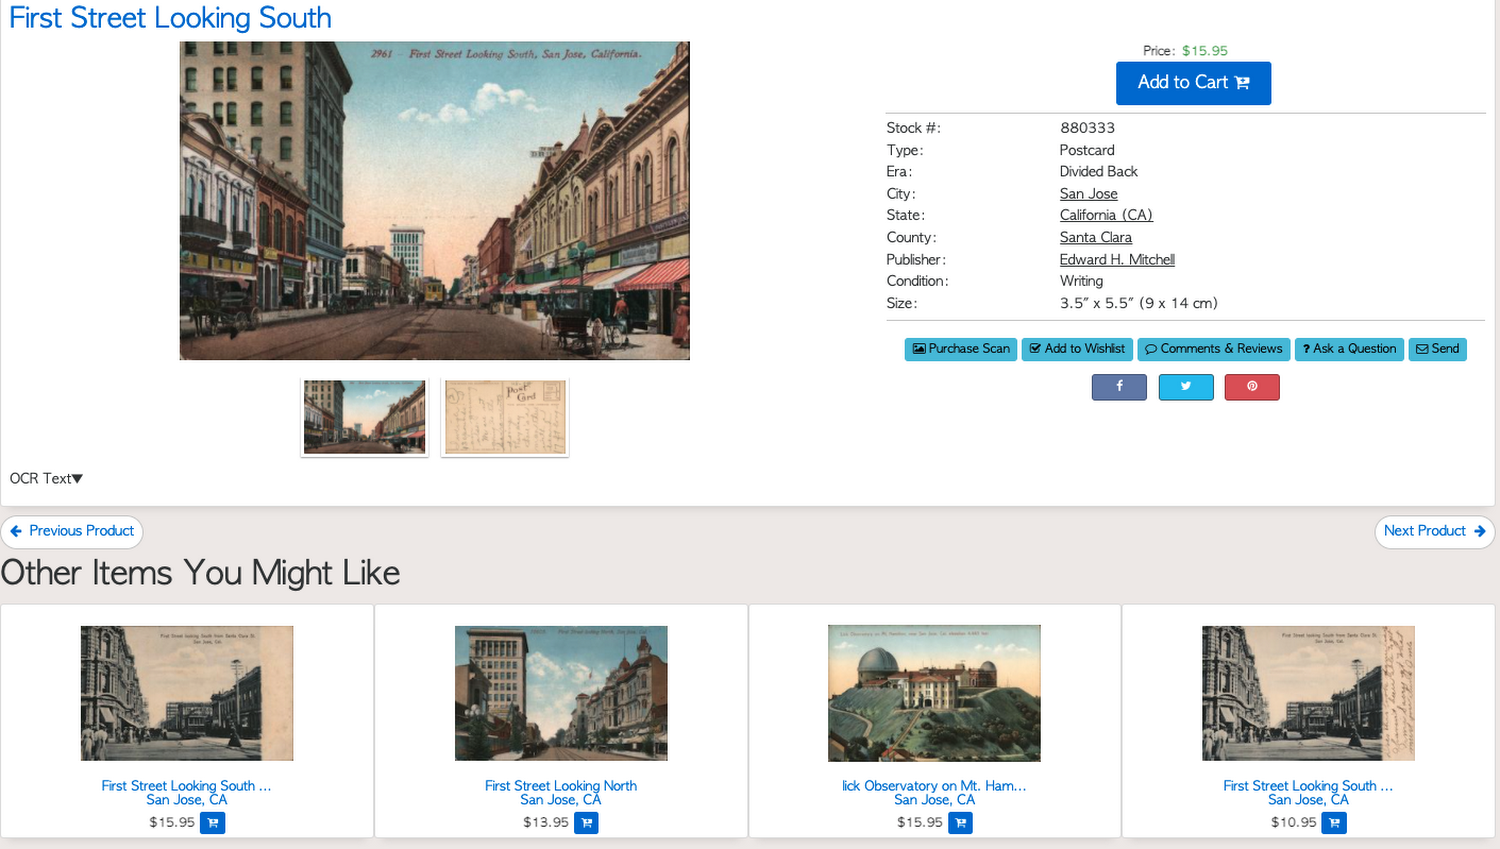
Let’s start by browsing our postcard-selling website, where I’ve been buying some vintage California postcards already. The recommendations algorithm has caught on to my interest, showing me other potential cards to purchase based on my history:
Put your data to work
To get started we need to bring your data into the recommendation model, so it can understand your customers, your inventory, and your sales patterns.
The model takes in the product catalog you use, and metadata about those products to better understand nuances in assortment, pricing and variables like size and style. You might already have this data stored in BigQuery or Merchant Center, and hence we provide easy integrations that you can leverage to get started even faster.
As for the user events, don’t worry if you already have systems in place to capture web and mobile activity. We make it easy to bring in your real time event logs by providing seamless integrations with Google Tag Manager, Javascript pixel, or even historic events from Cloud Storage, BigQuery or using inline API or JSON, so you can immediately train the models on this imported data. All this allows you to kickstart integrating with Recommendations AI in a matter of days.
The models then construct a sequence of activities that the user went through and joins with the products that the user engaged with. Once your data is ready to go, it takes a few days to train the model. Next onto making the data work for you.
Quickly customize your model
Setting up your own recommendations project in the console gives you the ability to choose what sort of model to train (based on what recommendations you want to generate) and your objective. Are you optimizing for click-through rate–more people click on the recommendation links or products–or for conversion rate–more people choose or buy what was suggested or revenue ?
Different models can be optimized for different optimization goals.; the GCP console explains what each one can do and how you can choose to optimize it.
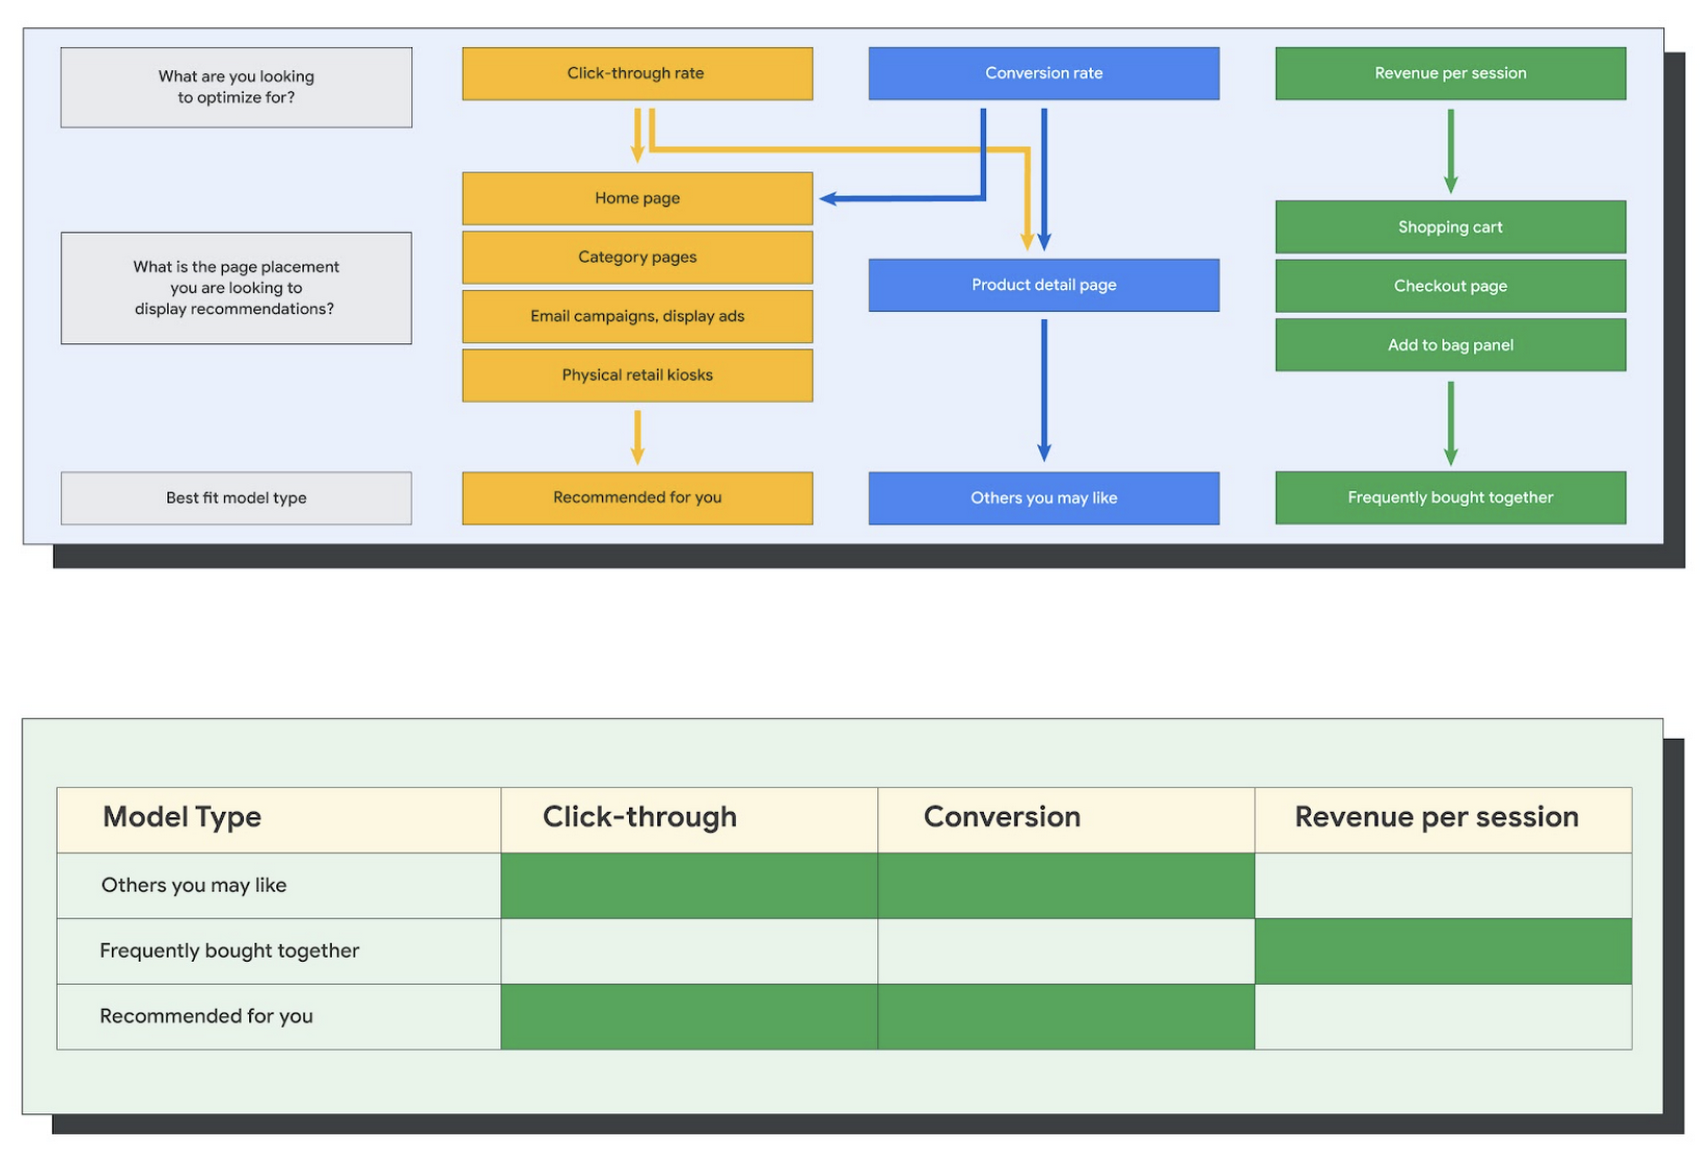
Let’s unpack some of this terminology real quick.
We’ve got three model types:
- Recommended for you – Means we think these are items you’ll want to buy, based on your history; this is usually used on a home page to showcase items.
- Others you may like – Means if you’re browsing the page of a water bottle, we will recommend alternative brands of water bottles that you may like as well as a backpack, based on your engagement history.
- Frequently bought together – Means that when anyone buys sunscreen, we notice that they often also buy aloe lotion, so we will surface those items when someone adds any one of them to their cart.
And then we have three business objectives that the models optimize for:
- Click-through rate – How frequently did somebody click on a recommended item?
- Conversion rate– How frequently did somebody add a recommended item to their cart?
- Revenue per session – How much money did the recommendations generate for you?
Deliver anywhere along the journey
Now that you’re all set up in the Retail AI console, you can test out the recommendations in the console, even before you deploy to production.
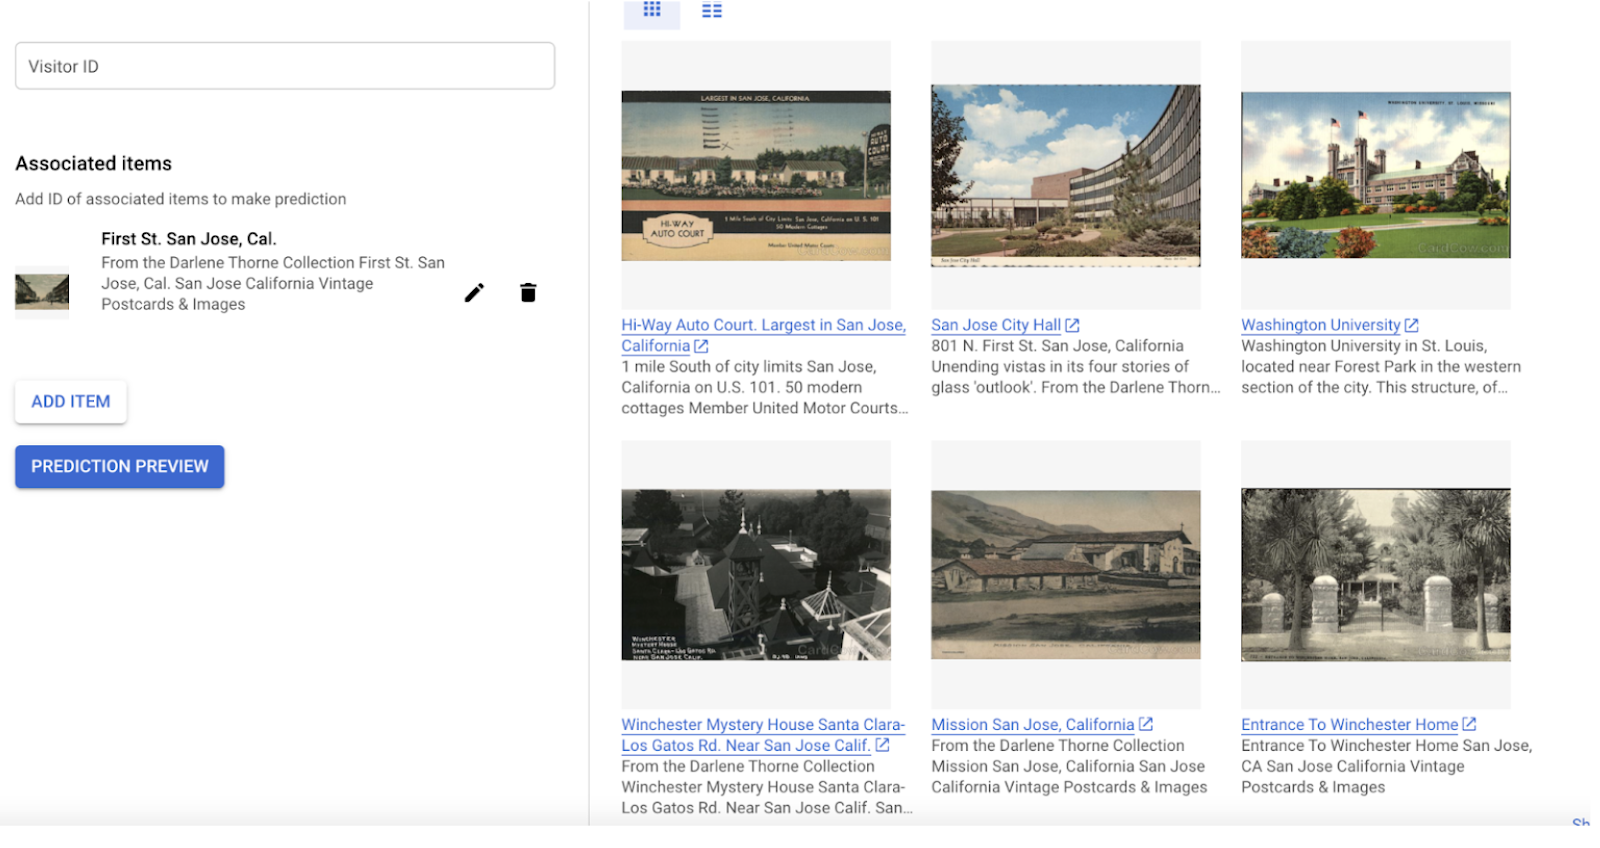
You can integrate Recommendations into your frontend by calling the Predict APIt. The placements of recommendations will report data back into the dashboard and you can analyze and measure success for future iterations.
On top of that you can use the recommendations for other parts of your customer’s journey. Email promotions, storefront kiosks, display ads or follow-up notifications can include recommendations based on past activity and cart contents. The model gives you useful product recommendations for a wide variety of touchpoints and steps in the purchasing process.
More best practices, and guides, are available inside our documentation.
How to get started
Training your own models can be tedious, time-consuming, and expensive. On top of that it requires deeper data science expertise to set up. Let us do it instead!
You can see how IKEA Retail uses Recommendations AI in this recent talk and blog from the Google Cloud Retail Summit..
To get started today you’ll need to make a Cloud project and enable the Retail API, which then allows you to access all the recommendation tools in one menu. Bring in your catalog and purchasing data, define a placement or two, and you can start putting recommendations on your site in a matter of days.
More Relevant Stories for Your Company

Meet the 8 Sponsors of 2021 State of DevOps Reports
Google Cloud and the DORA research team are excited to announce our eight sponsors for the 2021 State of DevOps report. We recently launched the 2021 State of DevOps survey, a 25-min survey for the DevOps community to share how they are using DevOps to improve software delivery performance. So if you haven’t

Cadbury Worldwide Hide: How the Chocolatier Made the Hiding Eggs Ritual Possible with Google Maps
Editor’s note: Today’s post is a Q&A with the VCCP London and VCCP CX team. VCCP London conceived of and built the Cadbury Worldwide Hide platform using Google Maps Platform as a way to get consumers ‘hiding’ eggs and engaging with loved ones during a time when they could not

Take a Look at 30 Eventrac Locations!
New locations in Eventarc Back in August, we announced more Eventarc locations (17 new regions, as well as 6 new dual-region and multi-region locations to be precise). This takes the total number of locations in Eventarc to more than 30. You can see the full list in the Eventarc locations page or by running gcloud

Google Maps Platform Helps BungkusIT Fulfil its Promise of Deliveries in One Hour!
Editor’s note: Today's post is written by Hatim M, Chief Commercial Officer at BungkusIT. The on-demand delivery service delivers packages within the hour for one million customers across Malaysia and uses Google Maps Platform to create a seamless end-to-end delivery experience for its customers. Imagine it's the end of a
