





BigQuery Admin Reference Guide Series: How to Optimize Data in Your Native Storage

3736
Of your peers have already read this article.
4:00 Minutes
The most insightful time you'll spend today!
So far on the BigQuery Admin Reference Guide series, we’ve talked about the different logical resources available inside of BigQuery. Now, we’re going to begin talking about BigQuery’s architecture. In this post we’re diving into how BigQuery stores your data in native storage, and what levers you can pull to optimize how your data is stored.
Columnar storage format
BigQuery offers fully managed storage, meaning you don’t have to provision servers. Sizing is done automatically and you only pay for what you use. Because BigQuery was designed for large scale data analytics data is stored in columnar format.
Traditional relational databases, like Postgres and MySQL, store data row-by-row in record-oriented storage. This makes them great for transactional updates and OLTP (Online Transaction Processing) use cases because they only need to open up a single row to read or write data. However, if you want to perform an aggregation like a sum of an entire column, you would need to read the entire table into memory.
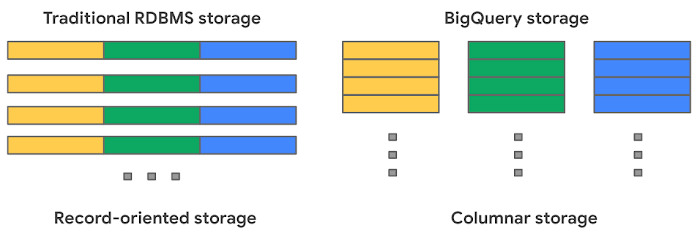
BigQuery uses columnar storage where each column is stored in a separate file block. This makes BigQuery an ideal solution for OLAP (Online Analytical Processing) use cases. When you want to perform aggregations you only need to read the column that you are aggregating over.
Optimized storage format
Internally, BigQuery stores data in a proprietary columnar format called Capacitor. We know Capacitor is a column-oriented format as discussed above. This means that the values of each field, or column, are stored separately so the overhead of reading the file is proportional to the number of fields you actually read. This doesn’t necessarily mean that each column is in its own file, it just means that each column is stored in a file block, which is actually compressed independently for increased optimization.
What’s really cool is that Capacitor builds an approximation model that takes in relevant factors like the type of data (e.g. a really long string vs. an integer) and usage of the data (e.g. some columns are more likely to be used as filters in WHERE clauses) in order to reshuffle rows and encode columns. While every column is being encoded, BigQuery also collects various statistics about the data — which are persisted and used later during query execution.
If you want to learn more about Capacitor, check out this blog post from Google’s own Chief BigQuery Officer.
Encryption and managed durability
Now that we understand how the data is saved in specific files, we can talk about where these files actually live. BigQuery’s persistence layer is provided by Google’s distributed file system, Colossus, where data is automatically compressed, encrypted, replicated, and distributed.
There are many levels of defense against unauthorized access in Google Cloud Platform, one of them being that 100% of data is encrypted at rest. Plus, if you want to control encryption yourself, you can use customer-managed encryption keys.
Colossus also ensures durability by using something called erasure encoding – which breaks data into fragments and saves redundant pieces across a set of different disks. However, to ensure the data is both durable and available, the data is also replicated to another availability zone within the same region that was designated when you created your dataset.
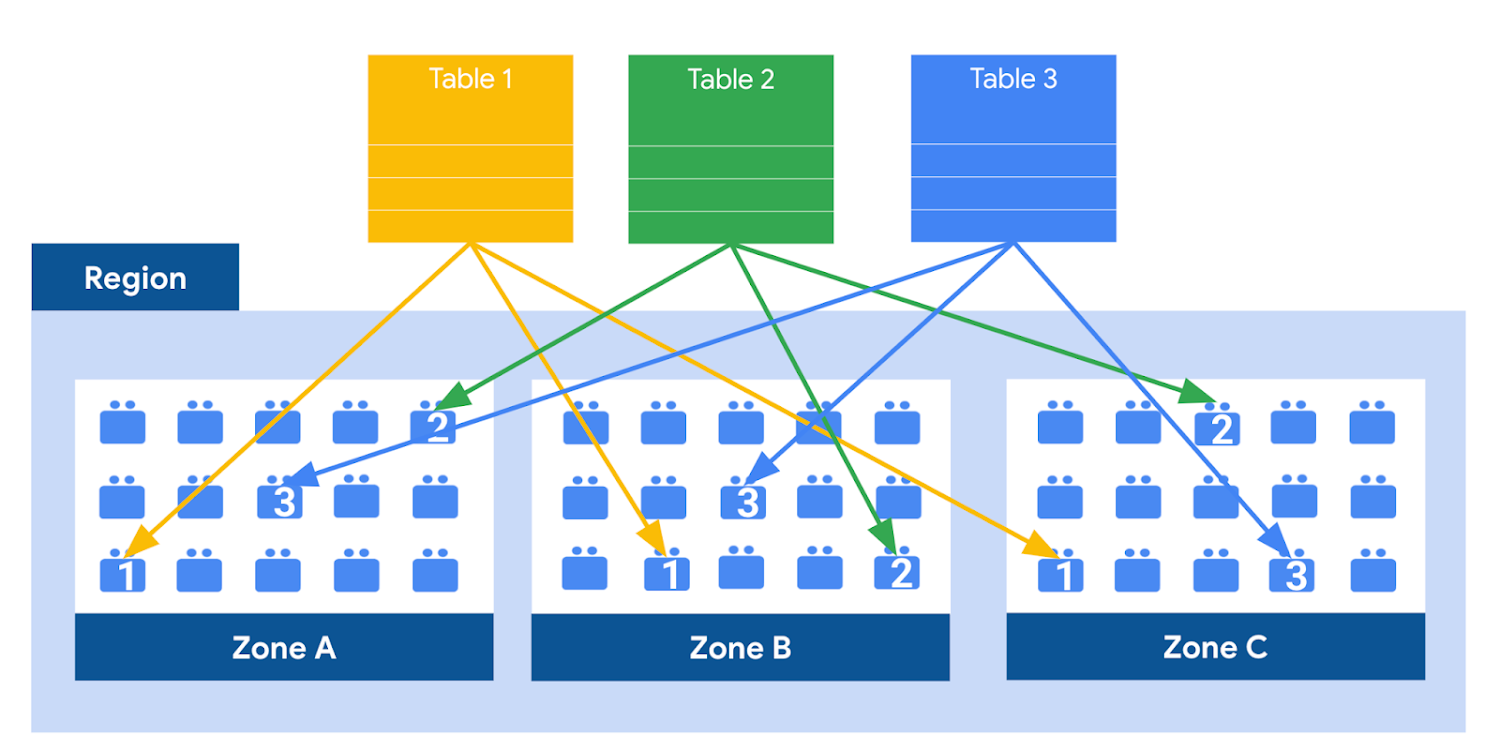
This means data is saved in a different building that has a different power system and network. The chances of multiple availability zones going offline at once is very small. But if you use “Multi-Region” locations – like the US or EU – BigQuery stores another copy of the data in an off-region replica. That way, the data is recoverable in the event of a major disaster.
This is all accomplished without impacting the compute resources available for your queries. Plus encoding, encryption and replication are included in the price of BigQuery storage – no hidden costs!
Optimizing storage for query performance
BigQuery has a built-in storage optimizer that helps arrange data into the optimal shape for querying, by periodically rewriting files. Files may be written first in a format that is fast to write but later BigQuery will format them in a way that is fast to query. Aside from the optimization happening behind the scenes, there are also a few things you can do to further enhance storage.
Partitioning
A partitioned table is a special table that is divided into segments, called partitions. BigQuery leverages partitioning to minimize the amount of data that workers read from disk. Queries that contain filters on the partitioning column can dramatically reduce the overall data scanned, which can yield improved performance and reduced query cost for on-demand queries. New data written to a partitioned table is automatically delivered to the appropriate partition.
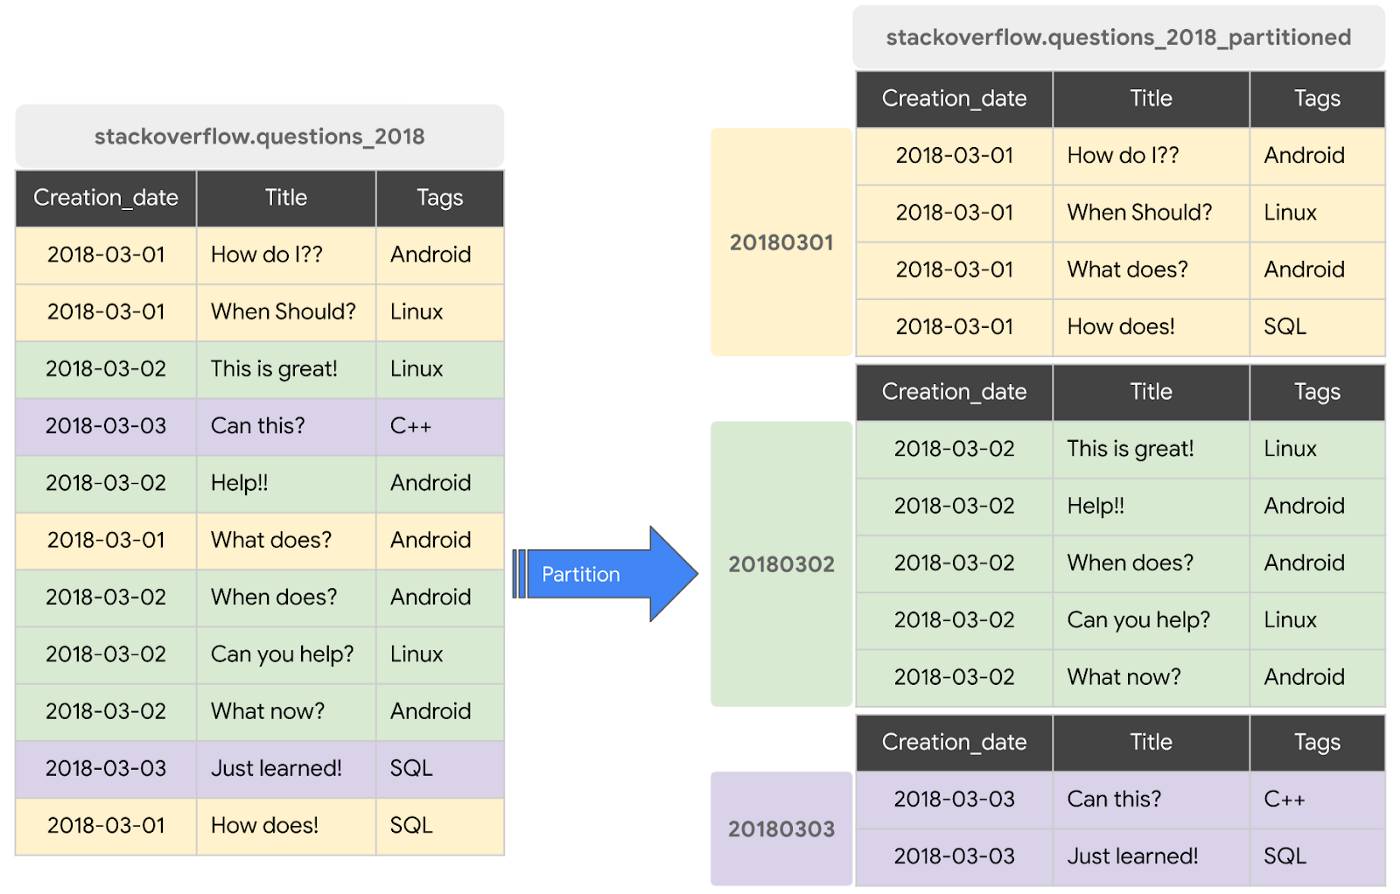
BigQuery supports the following ways to create partitioned tables:
- Ingestion time partitioned tables: daily partitions reflecting the time the data was ingested into BigQuery. This option is useful if you’ll be filtering data based on when new data was added. For example, the new Google Trends Dataset is refreshed each day, you might only be interested in the latest trends.
- Time-unit column partitioned tables: BigQuery routes data to the appropriate partition based on date value in the partitioning column. You can create partitions with granularity starting from hourly partitioning. This option is useful if you’ll be filtering data based on the date value in the table, for example looking at the most recent transactions by including a WHERE clause for transaction_created_date
- INTEGER range partitioned tables: Partitioned based on an integer column that can be bucketed. This option is useful if you’ll be filtering data based on an integer column in the table, for example focusing on specific customers using customer_id. You can bucket the integer values to create appropriately sized partitions, like having all customers with IDs from 0-100 in the same partition.
Partitioning is a great way to optimize query performance, especially for large tables that are often filtered down during analytics. When deciding on the appropriate partition key, make sure to consider how everyone in your organization is leveraging the table. For large tables that could cause some expensive queries, you might want to require partitions to be used.
Partitions are designed for places where there is a large amount of data and a low number of distinct values. A good rule of thumb is making sure partitions are greater than 1 GB. If you over partition your tables, you’ll create a lot of metadata – which means that reading in lots of partitions may actually slow down your query.
Clustering
When a table is clustered in BigQuery, the data is automatically sorted based on the contents of one or more columns (up to 4, that you specify). Usually high cardinality and non-temporal columns are preferred for clustering, as opposed to partitioning which is better for fields with lower cardinality. You’re not limited to choosing just one, you can have a single table that is both partitioned and clustered!
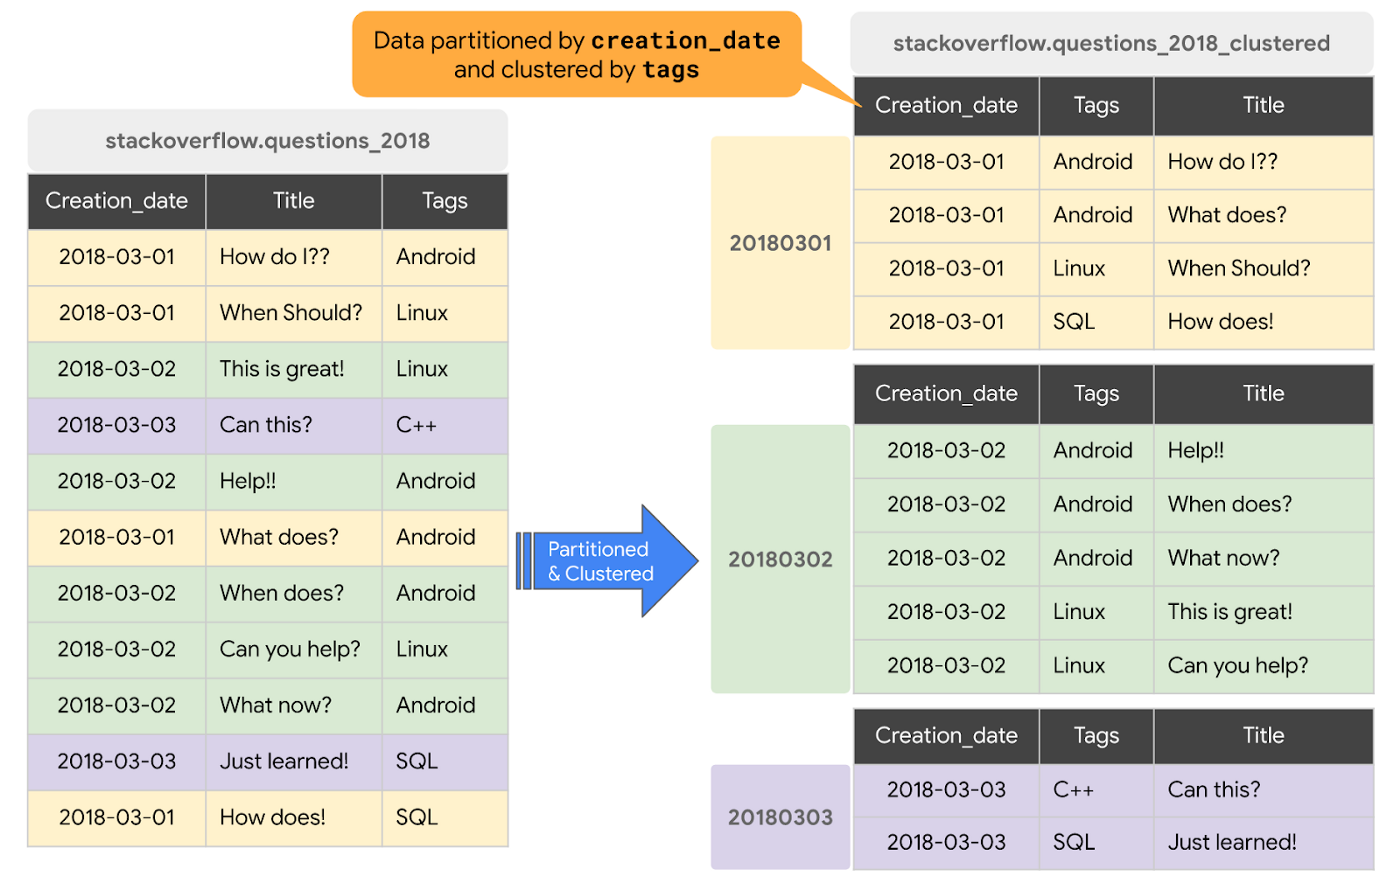
The order of clustered columns determines the sort order of the data. When new data is added to a table or a specific partition, BigQuery performs free, automatic re-clustering in the background. Specifically, clustering can improve the performance for queries:
- Containing where clauses with a clustered column: BigQuery uses the sorted blocks to eliminate scans of unnecessary data. The order of the filters in the where clause matters, so use filters that leverage clustering first
- That aggregate data based on values in a clustered column: performance is improved because the sorted blocks collocate rows with similar values
- With joins where the join key is used to cluster the table: less data is scanned, for some queries this offers a performance boost over partitioning!
Looking for some more information and example queries? Check out this blog post!
Denormalizing
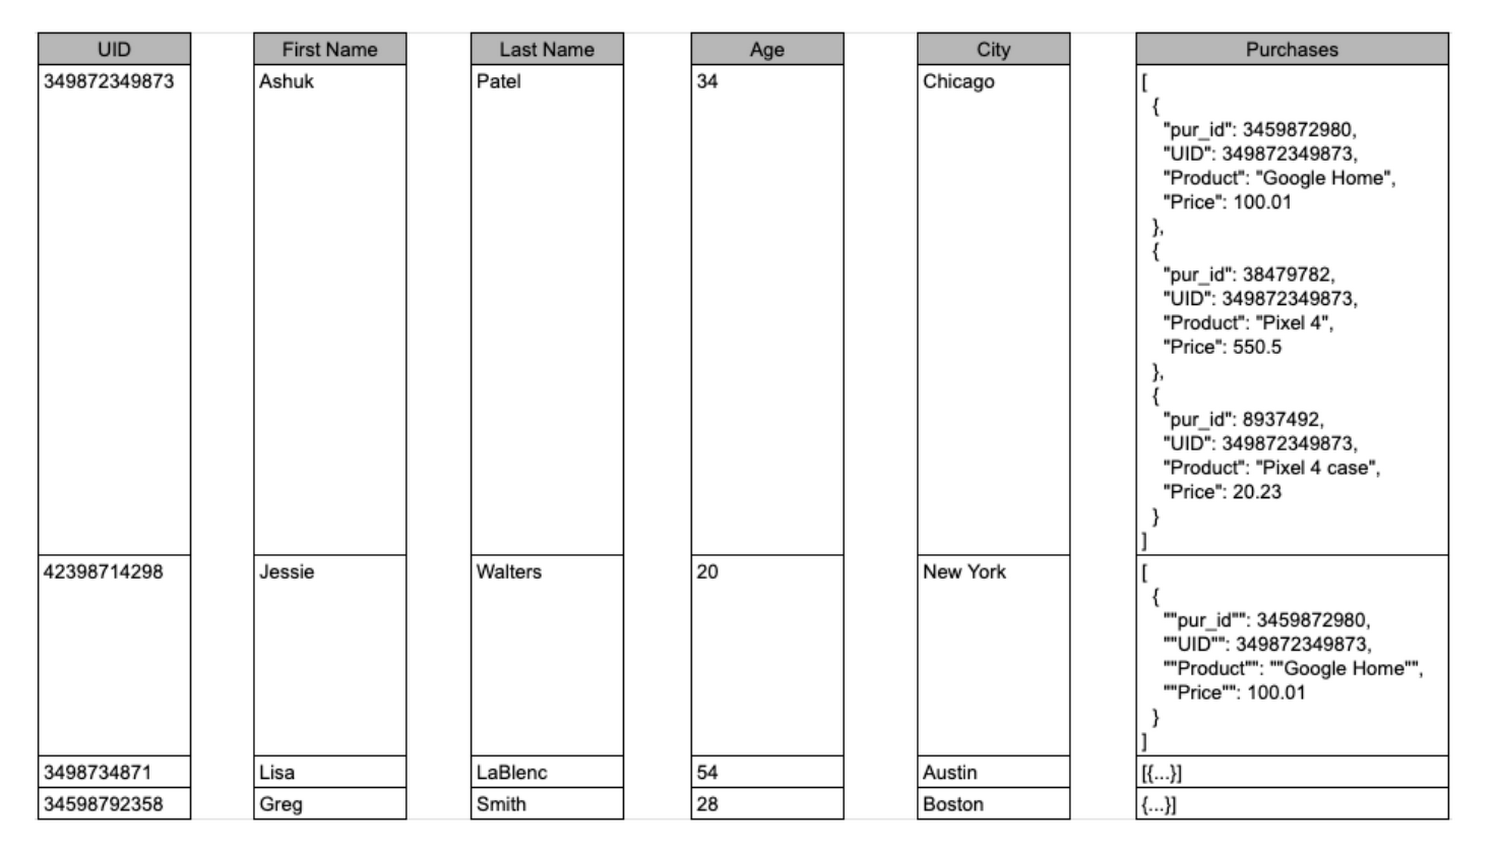
If you come from a traditional database background, you’re probably used to creating normalized schemas – where you optimize your structure so that data is not repeated. This is important for OLTP workloads (as we discussed earlier) because you’re often making updates to the data. If your customer’s address is stored every place they have made a purchase, then it might be cumbersome to update their address if it changes.
However, when performing analytical operations on normalized schemas, usually multiple tables need to be joined together. If we instead denormalize our data, so that information (like the customer address) is repeated and stored in the same table, then we can eliminate the need to have a JOIN in our query. For BigQuery specifically, we can also take advantage of support for nested and repeated structures. Expressing records using STRUCTs and ARRAYs can not only provide a more natural representation of the underlying data, but in some cases it can also eliminate the need to use a GROUP BY statement. For example, using ARRAY_LENGTH instead of COUNT.
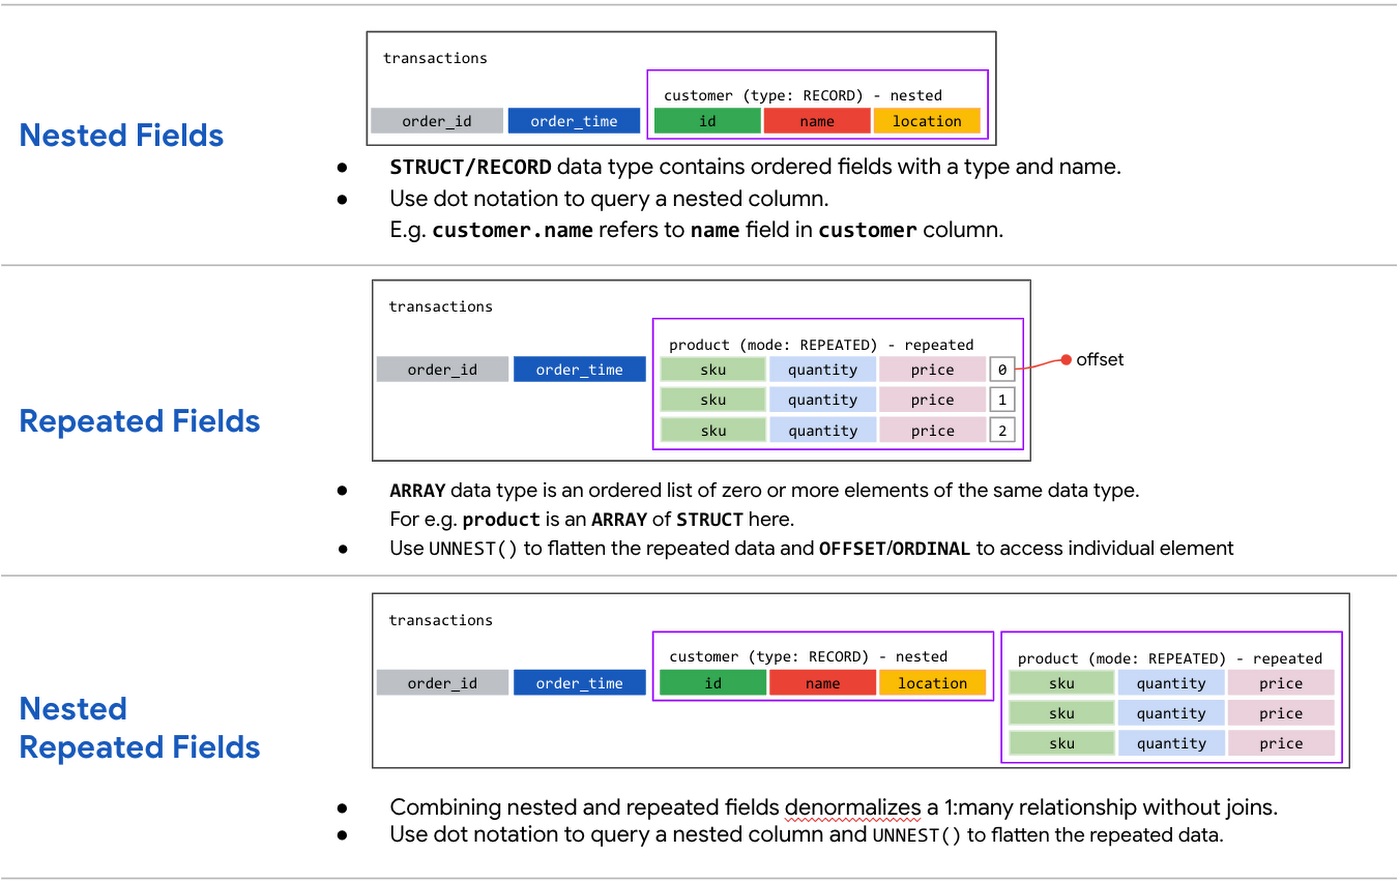
Keep in mind that denormalization has some disadvantages. First off, they aren’t storage-optimal. Although, many times the low cost of BigQuery storage addresses this concern. Second, maintaining data integrity can require increased machine time and sometimes human time for testing and verification. We recommend that you prioritize partitioning and clustering before denormalization, and then focus on data that rarely requires updates.
Optimizing for storage costs
When it comes to optimizing storage costs in BigQuery, you may want to focus on removing unneeded tables and partitions. You can configure the default table expiration for your datasets, configure the expiration time for your tables, and configure the partition expiration for partitioned tables. This can be especially useful if you’re creating materialized views or tables for ad-hoc workflows, or if you only need access to the most recent data.
Additionally, you can take advantage of BigQuery’s long term storage. If you have a table that is not used for 90 consecutive days, the price of storage for that table automatically drops by 50 percent to $0.01 per GB, per month. This is the same cost as Cloud Storage Nearline, so it might make sense to keep older, unused data in BigQuery as opposed to exporting it to Cloud Storage.Thanks for tuning in this week! Next week, we’re talking about query processing – a precursor to some query optimization techniques that will help you troubleshoot and cut costs. Be sure to stay up-to-date on this series by following me on LinkedIn and Twitter!
2022 Healthcare Trends: Healthcare Data, M&As, Better Patient Care, AI in Drug Development & Strategic Partnerships

6625
Of your peers have already read this article.
3:00 Minutes
The most insightful time you'll spend today!
The COVID-19 pandemic continues to push the healthcare and life sciences industry in entirely new ways. In record time, we’ve witnessed public health officials, vaccine developers, equipment manufacturers, and essential workers take life saving actions—regularly putting their own lives at risk—to respond to the exceptional challenges of our time.
Yet after all the turmoil and uncertainty of the pandemic, record breaking levels of investment continue to come into the market to fuel innovations.
Vaccine development is now measured in weeks rather than years; providers are leveraging telehealth technologies to improve the physician and patient experience; and individuals have embraced a variety of devices to assume greater ownership and control of their personal health.
With that in mind, here are five of the many innovations I see driving healthcare and life sciences for at least the next 12 months:
1. Unleashing the power of healthcare and life sciences data
People have arguably never had as much access and understanding to their personal health data than they can in 2022. They have the ability to understand their genetic makeup, medical history, family history, and activity levels to ensure they are living a healthy lifestyle. Taken together, this longitudinal profile can become the basis for more personalized medicine. Add wearable devices to the mix and patients gain real- or near-real-time updates on their health status.
Further, global regulatory agencies have continued to mandate the need for providers to maintain a longitudinal health record that provides a holistic view of the patient across all the encounters they have had with a health system. Physician surveys conducted by the The Harris Poll and Google Cloud show that a 360-degree view of the patient, across all provider encounters, leads to faster, more accurate diagnosis, and better outcomes.
If secure data access and interoperability can begin to include insurers, researchers, public health officials, and others in the field, the powerful network effects benefiting patients will only grow. When combined with those longitudinal phenome profiles, the opportunities for personalized and preventative medicine enter a whole new era.
2. Healthcare and life sciences M&A boom continues
Although the pandemic initially slowed activity on mergers and acquisitions in the early part of 2020, the healthcare and life sciences industry has seen a rapid rebound and acceleration of deals ever since. The success of COVID-19 vaccines, the importance of telehealth, and the focus on molecular modeling and genomic-based drug development have all boosted investment as organizations look to enter new markets, develop new therapies, and leverage low interest rates while they last.
In 2021, the total funding of US digital health startups surpassed $29 billion across 729 deals, according to advisory Rock Health. That’s almost double the levels of 2020, which itself set records. Analysts at PWC meanwhile estimate M&A investments in biopharmaceutical and life sciences could approach $400 billion this year across all sub-sectors
Clearly, the pandemic has been a primary driver of investment as the focus on healthcare has dramatically increased. Yet the increased activity also reflects changing business models and emerging technologies that are now required to compete in the rapidly evolving space. For organizations to capitalize on these investments, it will take not only great vision and intellectual property but also the right technologies—like cloud—and the right data interoperability models, to make partnerships and acquisitions more scalable, feasible, and seamless.
3. Transforming the patient experience at a new rate
The pandemic has shined a spotlight on the inefficiencies and complexities that exist in healthcare markets across the globe. As wave after wave has surged, global healthcare systems remain overwhelmed on most every aspect of patients’ treatment journeys. Even before COVID-19, healthcare was already one of the largest spend areas for governments around the world. The pandemic has only exacerbated the known issues.
Clearly, administrators, regulators, physicians, nurses, and patients would agree that the processes and models need to change. There’s a need to maintain this momentum and even increase the tempo to achieve lasting change.
Take telehealth. Within months of the start of the pandemic, providers moved to provide more remote capabilities so physicians could still meet with patients virtually to ensure health and safety on all sides. Payers recognized the importance of telehealth and began to update reimbursement rules. And organizations are now reimagining policies in areas such as prior authorization, submission, and adjudication to reduce complexity and bureaucracy while improving responsiveness.
Looking beyond the system, organizations are also recognizing and deepening their understanding of the structural and social determinants of health that impact patient care and health outcomes, especially for historically underserved communities. Private and public sectors are learning from, and increasingly partnering with, the social sciences, public health, biomedical informatics, computer science, public policy and community groups around how to build a mI’ore equitable and inclusive consumer products and Health IT strategies.
The newfound levels of transparency, visibility, and accountability that patients, caregivers, and organizations are achieving will ultimately increase competition and provide a more effective, equitable, efficient and, above all, healthier marketplace for all patients. As we move past the worst of the pandemic, regulators and organizations should keep fighting for progress over business as usual.
4. AI is now a core competency for Drug Development
The ability of organizations like Pfizer, Moderna, Johnson & Johnson, and Astrazeneca to develop COVID-19 vaccines has been a remarkable accomplishment—particularly the historic speed with which they were created and deployed. This innovation acceleration was largely enabled by the use of new drug development platforms that allow researchers to use artificial intelligence and machine learning to model protein and cellular interactions to rapidly advance the science.
No longer must researchers rely on traditional laboratory testing (and retesting). With their improved understanding of the molecular and genetic structure of a patient and, for example, their tumor, researchers can use AI to enable simulations on computers rather than testing in live conditions. This technology can process thousands, even millions of simulations to help identify high-potential candidates for treatment consideration and subsequent analysis.
AI-enabled drug discovery models can eliminate months and years from the research process, which can reduce the time to develop a drug and accelerate the time to treatment for an individual patient. As just one example, consider the work on AlphaFold2 by Google’s DeepMind unit who leverages AI to predict effective protein shapes for new drugs. Healthcare and life sciences organizations already recognize the potential of AI. Now comes the investments to leverage this rapidly evolving technology to support their efforts now and in the future.
5. Ecosystem partnerships tackle complexity and spur innovation
As the importance and growth of the healthcare and life sciences industry continues, we will see even more new players and partnerships emerging to address old problems in new ways. This trend will touch all aspects of the healthcare value chain and will, increasingly, see three- and four-player partnerships emerge to address the complex challenges of today’s healthcare marketplace.
Technology will continue to play a key role as capabilities and platforms will transform all aspects of the marketplace. Cell phones, wearable devices, and other technologies will provide real-time updates and notifications to patients on everything from glucose levels to payments for healthcare services. Voice recognition software will document physician and patient discussions to reduce the burden of record keeping. Real-world data will be used to simplify and confidentially recruit patients for participation in clinical trials.
New players will continue to enter the market to improve health outcomes and reduce costs. Major retailers are among the companies extending their pharmacies to provide additional diagnostic and concierge services, saving patients from additional appointments while boosting prevention. Community organizations are emerging to help identify and care for underserved communities whose health outcomes are significantly lower than the average patient.
For all the exhausting and heart-wrenching challenges of the past two years, the opportunities the pandemic has laid bare cannot be overlooked. We owe it to those who have worked and fought so hard for every life to forge even more new partnerships—and make it easier to do so—so that the next crisis, when it does arise, will never be as bad as the one we’re now conquering. Technology can be the enabler in this effort and help bring us together to continue to conquer the challenges that lie ahead.
BigQuery ML for Sentiment Analysis: How to Make the Most of Your Data

1822
Of your peers have already read this article.
4:30 Minutes
The most insightful time you'll spend today!
Introduction
We recently announced BigQuery support for sparse features which help users to store and process the sparse features efficiently while working with them. That functionality enables users to represent sparse tensors and train machine learning models directly in the BigQuery environment. Being able to represent sparse tensors is a useful feature because sparse tensors are used extensively in encoding schemes like TF-IDF as part of data pre-processing in NLP applications and for pre-processing images with a lot of dark pixels in computer vision applications.
There are numerous applications of sparse features such as text generation and sentiment analysis. In this blog, we’ll demonstrate how to perform sentiment analysis with the space features in BigQuery ML by training and inferencing machine learning models using a public dataset. This blog also highlights how easy it is to work with unstructured text data on BigQuery, an environment traditionally used for structured data.
Using sample IMDb dataset
Let’s say you want to conduct a sentiment analysis on movie reviews from the IMDb website. For the benefit of readers who want to follow along, we will be using the IMDb reviews dataset from BigQuery public datasets. Let’s look at the top 2 rows of the dataset.
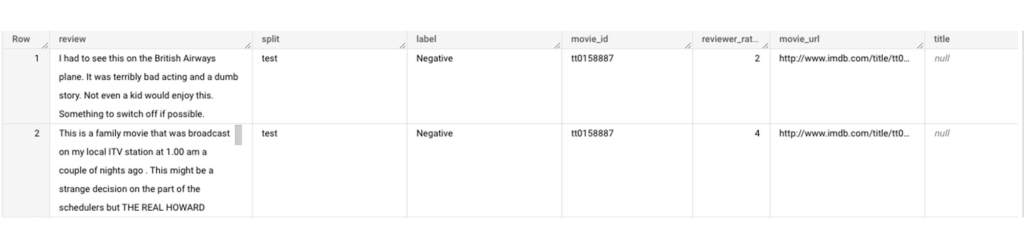
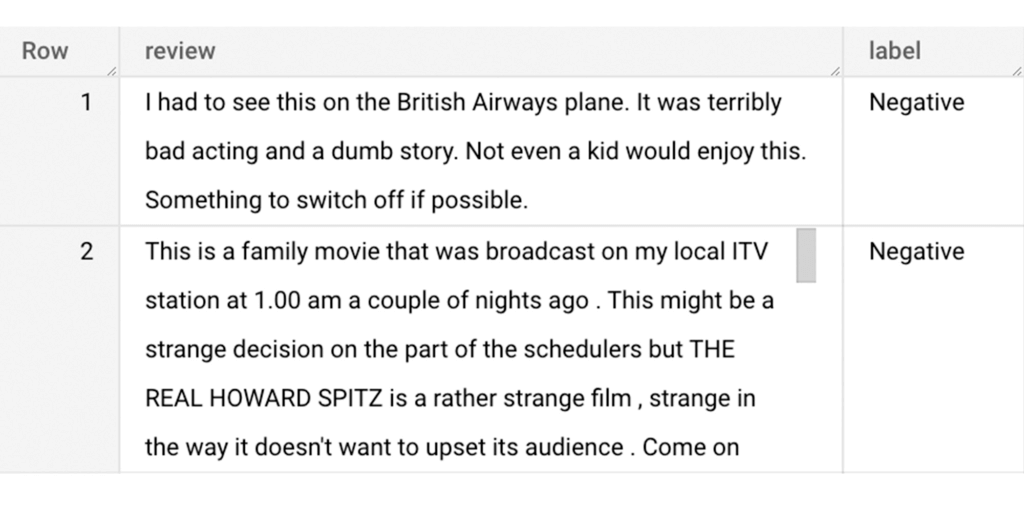
Although the reviews table has 7 columns, we only use reviews and label columns to perform sentiment analysis for this case. Also, we are only considering negative and positive values in the label columns. The following query can be used to select only the required information from the dataset.
SELECT
 review,
 label,
FROM
 `bigquery-public-data.imdb.reviews`
WHERE
 label IN ('Negative', 'Positive')
The top 2 rows of the result is as follows:
Methodology
Based on the dataset that we have, the following steps will be carried out:
- Build a vocabulary list using the review column
- Convert the review column into sparse tensors
- Train a classification model using the sparse tensors to predict the label (“positive” or “negative”)
- Make predictions on new test data to classify reviews as positive or negative.
Feature engineering
In this section, we will convert the text from the reviews column to numerical features so that we can feed them into a machine learning model. One of the ways is the bag-of-words approach where we build a vocabulary using the words from the reviews and select the most common words to build numerical features for model training. But first, we must extract the words from each review. The following code creates a dataset and a table with row numbers and extracted words from reviews.
-- Create a dataset named `sparse_features_demo` if doesn’t exist
CREATE SCHEMA IF NOT EXISTS sparse_features_demo;


-- Select unique reviews with only negative and positive labels
CREATE OR REPLACE TABLE sparse_features_demo.processed_reviews AS (
 SELECT
   ROW_NUMBER() OVER () AS review_number,
   review,
   REGEXP_EXTRACT_ALL(LOWER(review), '[a-z]{2,}') AS words,
   label,
   split
 FROM (
   SELECT
     DISTINCT review,
     label,
     split
   FROM
     `bigquery-public-data.imdb.reviews`
   WHERE
     label IN ('Negative', 'Positive')
 )
);
The output table from the query above should look like this:
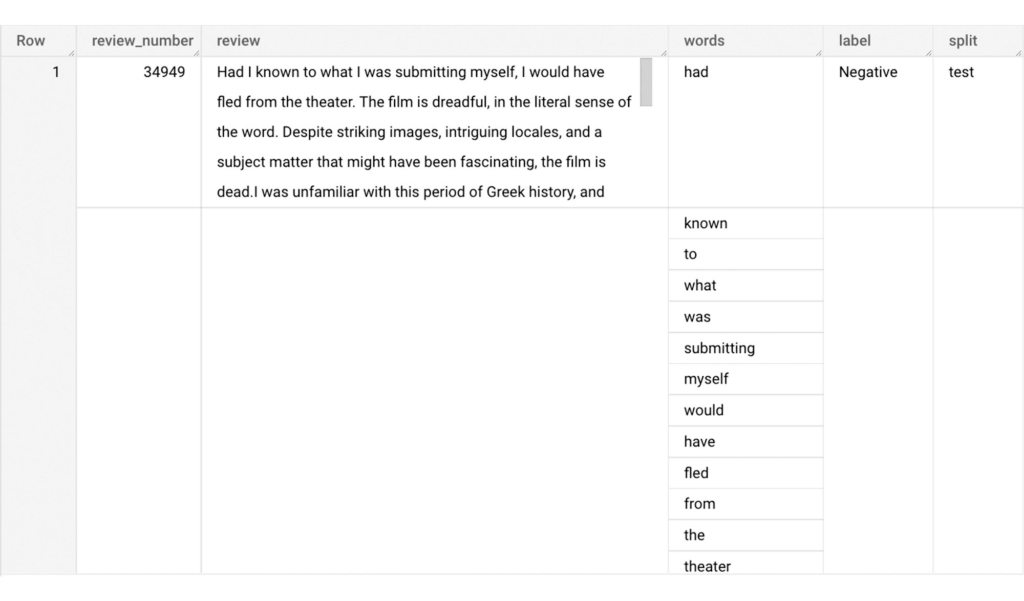
The next step is to build a vocabulary using the extracted words. The following code creates a vocabulary including word frequency and word index from reviews. For this case, we are going to select only the top 20,000 words to reduce the computation time.
-- Create a vocabulary using train dataset and select only top 20,000 words based on frequency
CREATE OR REPLACE TABLE sparse_features_demo.vocabulary AS (
 SELECT
   word,
   word_frequency,
   word_index
 FROM (
   SELECT
     word,
     word_frequency,
     ROW_NUMBER() OVER (ORDER BY word_frequency DESC) - 1 AS word_index
   FROM (
     SELECT
       word,
       COUNT(word) AS word_frequency
     FROM
       sparse_features_demo.processed_reviews,
       UNNEST(words) AS word
     WHERE
       split = "train"
     GROUP BY
       word
   )
 )
 WHERE
   word_index < 20000 # Select top 20,000 words based on word count
);
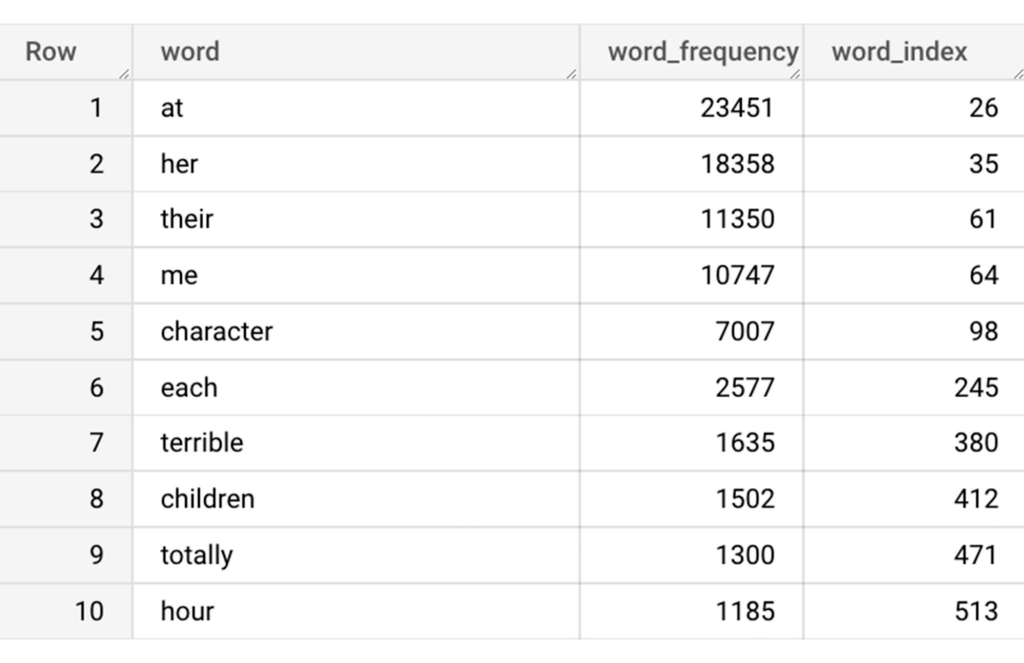
The following shows the top 10 words based on frequency and their respective index from the resulting table of the query above.
Creating a sparse feature
Now we will use the newly added feature to create a sparse feature in BigQuery. For this case, we aggregate word_index and word_frequency in each review, which generates a column as ARRAY[STRUCT] type. Now, each review is represented as ARRAY[(word_index, word_frequency)].
-- Generate a sparse feature by aggregating word_index and word_frequency in each review.
CREATE OR REPLACE TABLE sparse_features_demo.sparse_feature AS (
 SELECT
   review_number,
   review,
   ARRAY_AGG(STRUCT(word_index, word_frequency)) AS feature,
   label,
   split
 FROM (
   SELECT
     DISTINCT review_number,
     review,
     word,
     label,
     split
   FROM
     sparse_features_demo.processed_reviews,
     UNNEST(words) AS word
   WHERE
     word IN (SELECT word FROM sparse_features_demo.vocabulary)
 ) AS word_list
 LEFT JOIN
   sparse_features_demo.vocabulary AS topk_words
   ON
     word_list.word = topk_words.word
 GROUP BY
   review_number,
   review,
   label,
   split
);
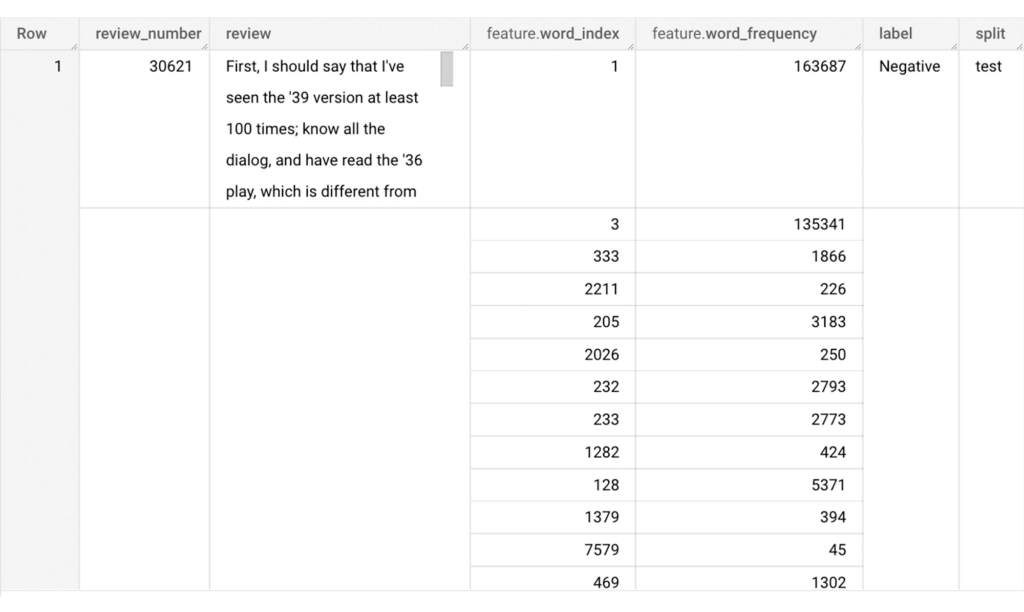
Once the query is executed, a sparse feature named `feature` will be created. That `feature` column is an `ARRAY of STRUCT` column which is made of `word_index` and `word_frequency` columns. The picture below displays the resulting table at a glance.
Training a BigQuery ML model
We just created a dataset with a sparse feature in BigQuery. Let’s see how we can use that dataset to train with a machine learning model with BigQuery ML. In the following query, we will train a logistic regression model using the review_number, review, and feature to predict the label:
-- Train a logistic regression classifier using the data with sparse feature
CREATE OR REPLACE MODEL sparse_features_demo.logistic_reg_classifier
 TRANSFORM (
   * EXCEPT (
       review_number,
       review
     )
 )
 OPTIONS(
   MODEL_TYPE='LOGISTIC_REG',
   INPUT_LABEL_COLS = ['label']
 ) AS
 SELECT
   review_number,
   review,
   feature,
   label
 FROM
    sparse_features_demo.sparse_feature
 WHERE
   split = "train"
;
Now that we have trained a BigQuery ML Model using a sparse feature, we evaluate the model and tune it as needed.
-- Evaluate the trained logistic regression classifier
SELECT * FROM ML.EVALUATE(MODEL sparse_features_demo.logistic_reg_classifier);
The score looks like a decent starting point, so let’s go ahead and test the model with the test dataset.

-- Evaluate the trained logistic regression classifier using test data
SELECT * FROM ML.EVALUATE(MODEL sparse_features_demo.logistic_reg_classifier,
 (
   SELECT
     review_number,
     review,
     feature,
     label
   FROM
     sparse_features_demo.sparse_feature
   WHERE
     split = "test"
 )
);
The model performance for the test dataset looks satisfactory and it can now be used for inference. One thing to note here is that since the model is trained on the numerical features, the model will only accept numeral features as input. Hence, the new reviews have to go through the same transformation steps before they can be used for inference. The next step shows how the transformation can be applied to a user-defined dataset.
Sentiment predictions from the BigQuery ML model
All we have left to do now is to create a user-defined dataset, apply the same transformations to the reviews, and use the user-defined sparse features to perform model inference. It can be achieved using a WITH statement as shown below.
WITH
 -- Create a user defined reviews
 user_defined_reviews AS (
   SELECT
     ROW_NUMBER() OVER () AS review_number,
     review,
     REGEXP_EXTRACT_ALL(LOWER(review), '[a-z]{2,}') AS words
   FROM (
     SELECT "What a boring movie" AS review UNION ALL
     SELECT "I don't like this movie" AS review UNION ALL
     SELECT "The best movie ever" AS review
   )
 ),


 -- Create a sparse feature from user defined reviews
 user_defined_sparse_feature AS (
   SELECT
     review_number,
     review,
     ARRAY_AGG(STRUCT(word_index, word_frequency)) AS feature
   FROM (
     SELECT
       DISTINCT review_number,
       review,
       word
     FROM
       user_defined_reviews,
       UNNEST(words) as word
     WHERE
       word IN (SELECT word FROM sparse_features_demo.vocabulary)
   ) AS word_list
   LEFT JOIN
     sparse_features_demo.vocabulary AS topk_words
     ON
       word_list.word = topk_words.word
   GROUP BY
     review_number,
     review
 )


-- Evaluate the trained model using user defined data
SELECT review, predicted_label FROM ML.PREDICT(MODEL sparse_features_demo.logistic_reg_classifier,
 (
   SELECT
     *
   FROM
     user_defined_sparse_feature
 )
);
Here is what you would get for executing the query above:
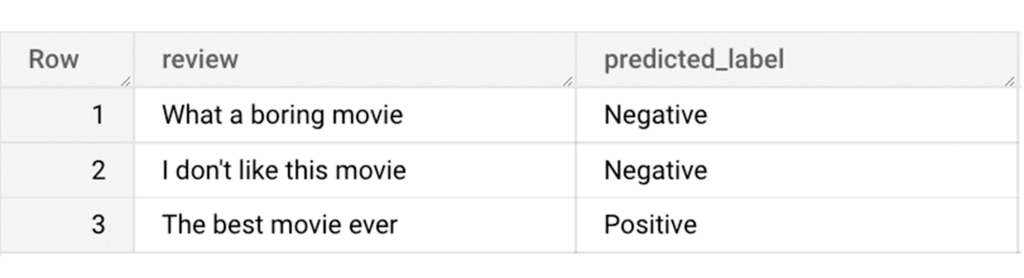
And that’s it! We just performed a sentiment analysis on the IMDb dataset from a BigQuery Public Dataset using only SQL statements and BigQuery ML. Now that we have demonstrated how sparse features can be used with BigQuery ML models, we can’t wait to see all the amazing projects that you would create by harnessing this functionality.
If you’re just getting started with BigQuery, check out our interactive tutorial to begin exploring.
Wayfair Writes its Success Story with BigQuery for Internal Analytics

4947
Of your peers have already read this article.
4:00 Minutes
The most insightful time you'll spend today!
Editor’s note: Home-goods and furniture giant Wayfair first partnered up with Google Cloud to transform and scale its storefront—work that proved its value many times over during the unprecedented surge in ecommerce traffic during 2020. Today, we hear how BigQuery’s performance and cost optimization have transformed the company’s internal analytics to create an environment of “yes”.
At Wayfair, we have several unique challenges relating to the scale of our product catalog, our global delivery network, and our position in a multi-sided marketplace that supports both our customers and suppliers. To give you a sense of our scale we have a team of more than 3,000 engineers with tens of millions of customers. We supply more than 20 Million items using more than 16,000 supplier partners.
Serving those constituents generates a lot of analytics work. Wayfair runs over a billion ‘analytic’ database queries a year, from both humans and systems, against multi-petabyte datasets. Scaling our previous environment to meet these challenges required us to maintain dozens of copies of data for different use cases and manage complex data synchronization routines to move trillions of records each day, resulting in long development times and high support costs for our analytics projects.
Centralizing our data using Cloud Storage and BigQuery enabled us to break down existing silos and build unified pipelines for our batch and real-time operations. BigQuery shines by letting us decouple our compute and storage resources and flexibly ingest structured data in streaming and batch modes. We also benefit from the same decoupling for more complicated machine learning (ML) workflows in Dataproc and Cloud Storage. In particular, BigQuery is extremely low maintenance. From ML and easy data integrations to the integrated query cache, many out-of-the-box features have proven valuable for multiple use cases.
Beyond storage and compute, Google Cloud offers multiple tools to maximize the value of our data. For example, we can easily connect Data Studio to BigQuery for lightning-fast dashboarding of enterprise KPI reporting. When we need to dive deeper into a metric, Looker provides an interface and semantic model that empowers more business users to answer important questions — without understanding SQL or our vast dataset and table structure.
The combination of all of Google Cloud’s tools enables every Wayfairian the opportunity to self-serve their data visualization and analysis needs. We are able to support all of the requirements of our internal and external users, from descriptive analytics to alerting and ML, in a platform that blends Google’s proprietary technology with open-source standards.we have seen a greater than 90% reduction in the number of analytic queries in production that take more than one minute to run
As a result, we have seen a greater than 90% reduction in the number of analytic queries in production that take more than one minute to run, which delights our users and increases adoption of our analytics tools across the business.
Higher performance means saying “Yes” more often
We went into the BigQuery experience expecting very strong performance on large, aggregate queries and excellent scalability — the kind of performance that could enable consistent 5-15 minute processing queries and 5-10 second response times for large analytics queries.
We weren’t disappointed — we saw slightly better than linear performance profiles as record counts went up from millions to trillions for a flat resource allocation. BigQuery had the expected high performance for aggregate queries. This made our large data processing pipelines predictable and straightforward to maintain and optimize.
Below is a plot of gigabytes processed by a query against query run time in seconds; outliers are filtered and the axes are pruned to ranges where we had a large sample size. This focuses on longer-duration queries. As an example of the linear performance, a 2 terabyte query averages 5 minutes — 2.5min/terabyte — and an 18 terabyte query (9 times as much data) averages 25s — only 1.4min/terabyte. This is despite the fact that complex queries [sorting and analytic functions are particularly problematic] are more common with large data sizes. We do see increasing variability at large sizes as slot limits and other resource constraints come into play, but these factors are controllable and ultimately a business optimization decision.
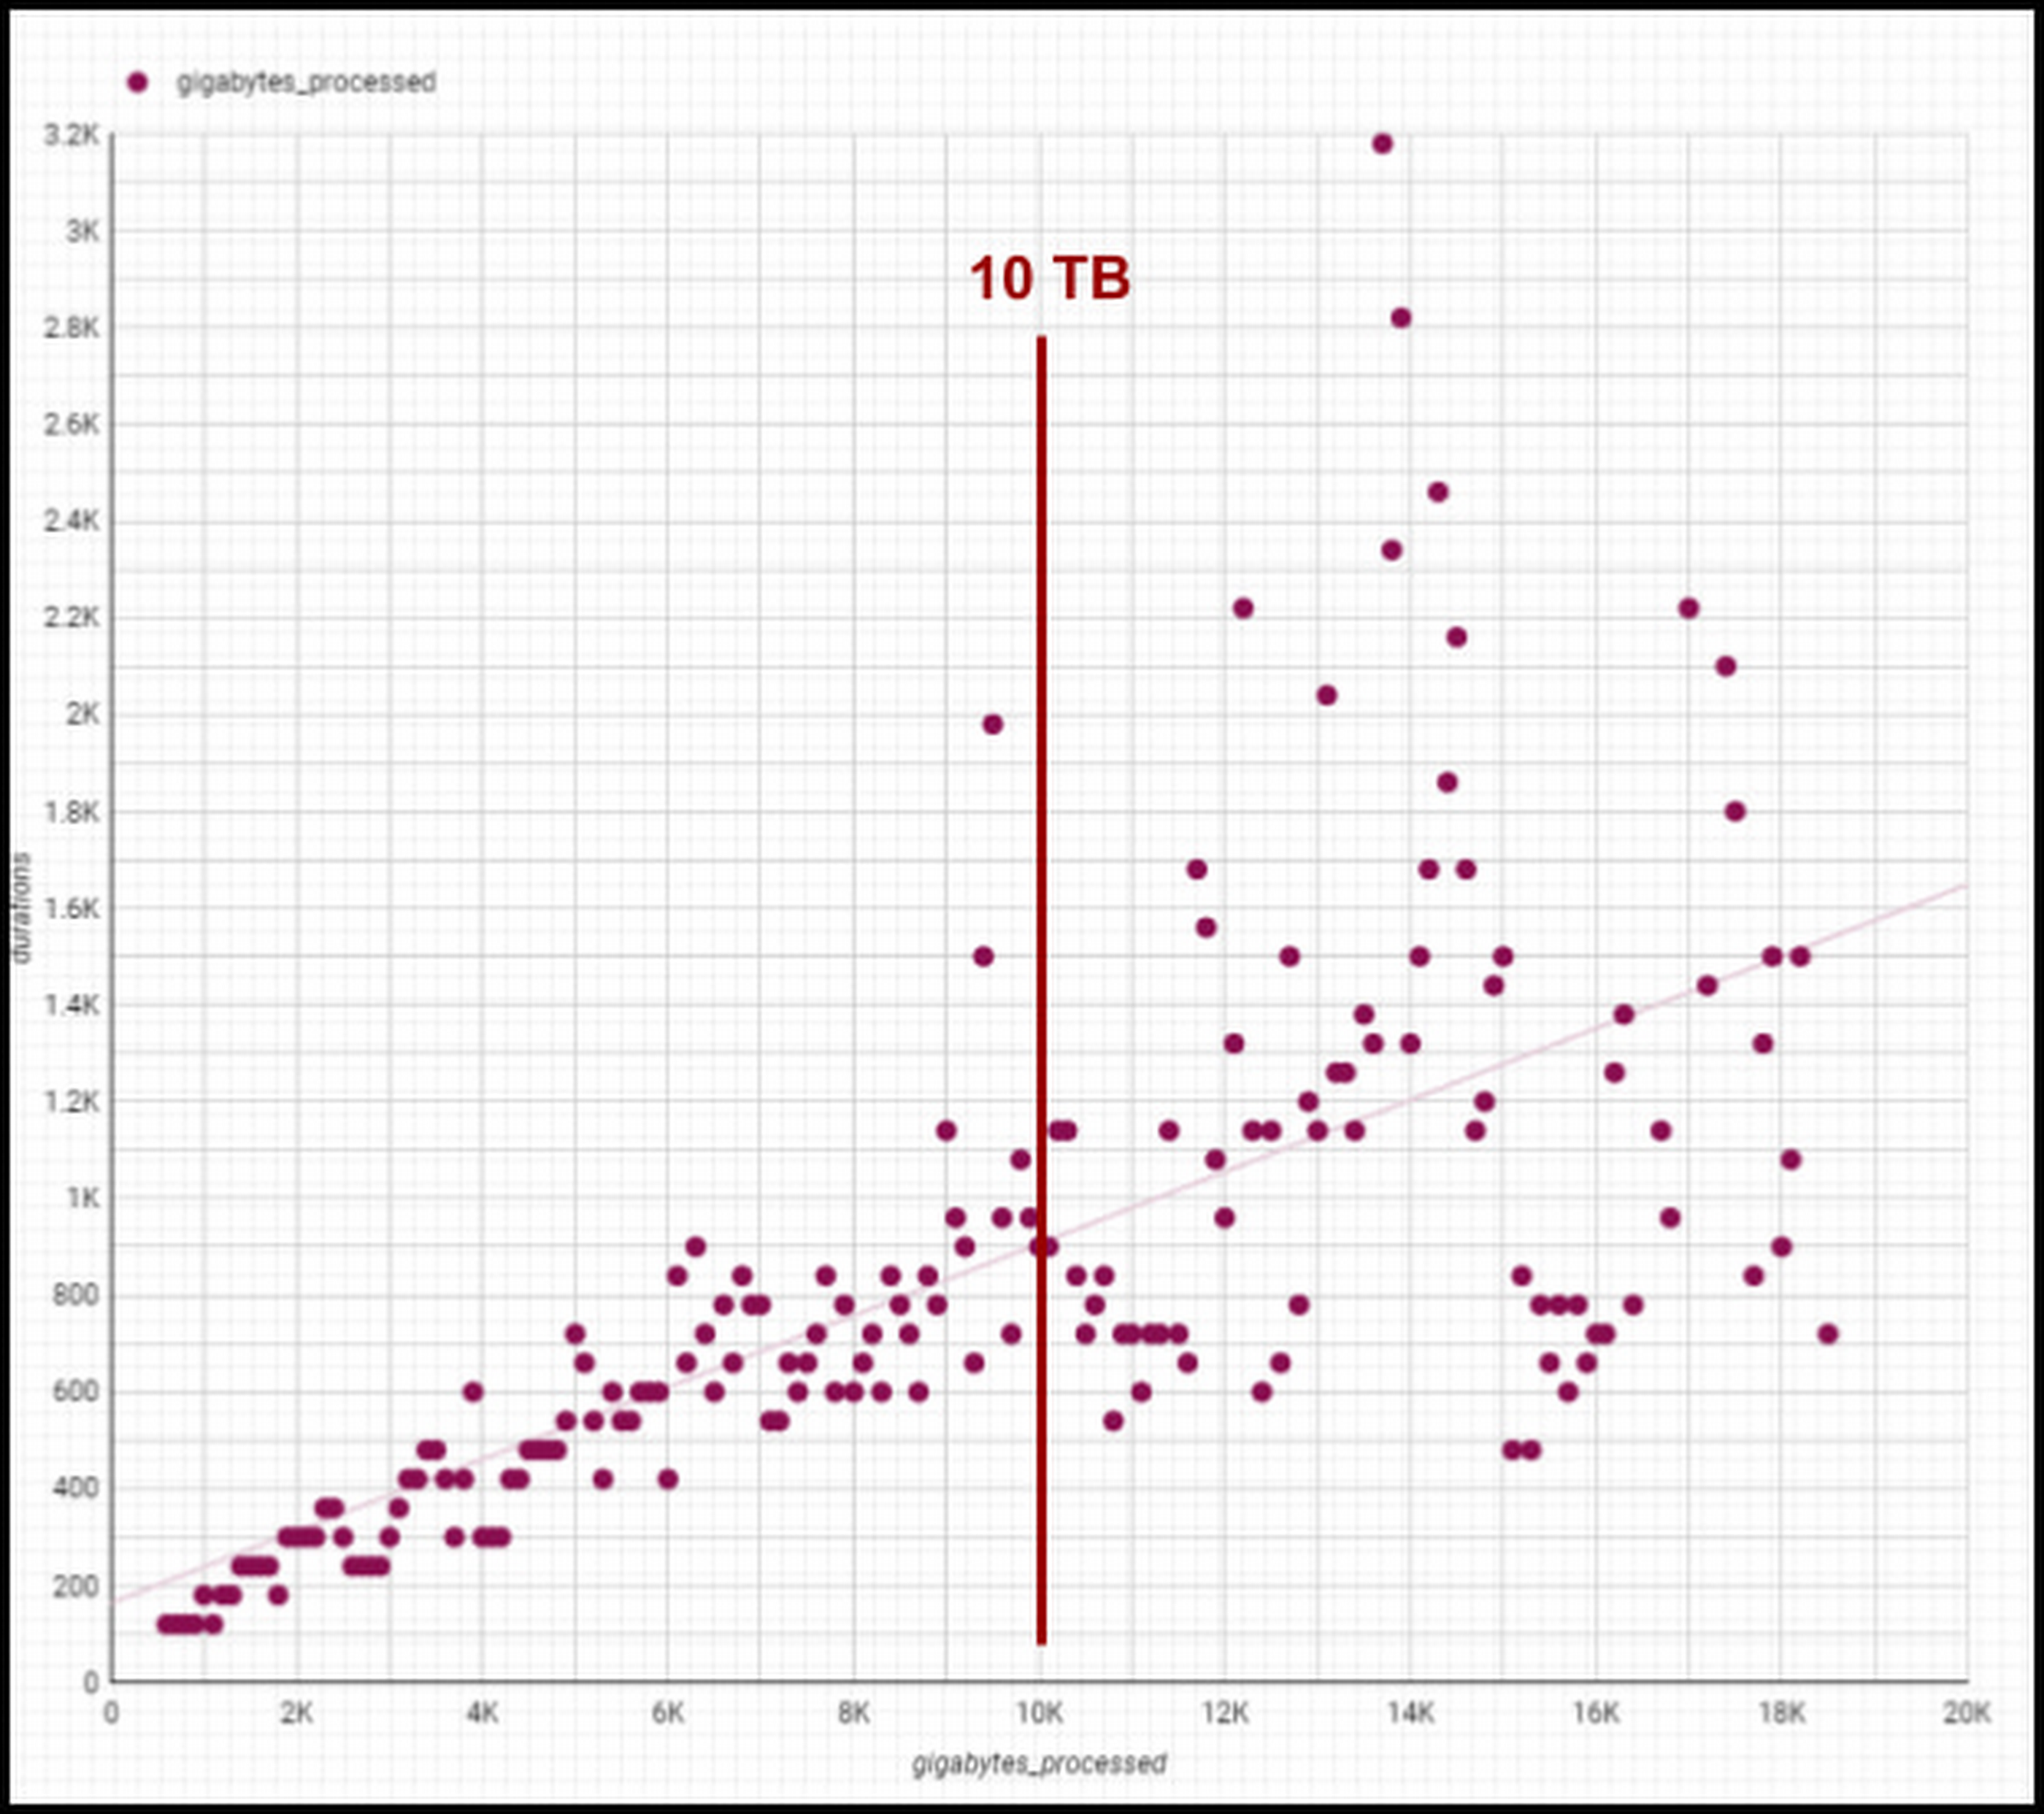
Though individual values vary greatly depending on query complexity [analytic functions/sorting can be computationally expensive], the overall trend line is below 1-1 for bytes versus duration, meaning our BigQuery query runtimes are increasing slower than our data volumes. We are still seeing sub 1:1 threshold runtimes, and we’re already at 100 PB of total data with single queries running on 50PB or more. Going strong!
One unexpected and pleasant surprise has been high performance for smaller queries, such as those required for development, interactive analytics, and internal applications we use for forecasting, segmentation, and other latency-sensitive data workflows. BigQuery’s resource management systems have provided smoother degradation and parallelism profiles than we initially expected for a multi-tenant platform.
We regularly see sub-second p50 query performance for interactive use cases, with p90 performance coming in under 10 seconds for Looker, Data Studio, and AtScale — meeting the threshold we set to avoid analysts losing focus during a business investigation. The chart below shows p50, p90, and p95 timing for core workloads, as well as the number of queries in each bucket and the number of unique users. [Looker and Atscale will use small numbers of service accounts for a large number of users].

This has enabled two important shifts in the way our customers experience analytics services:
- Delivering better user productivity. People no longer have long wait times to get results for a basic query delivering an improved overall user experience.
- Scaling our data transformation. BigQuery has proven, effective data transformation that allows us to embrace the industry shift away towards ELT (extract, load, transform) to transform raw data right within the database.
We no longer have to ask ourselves, “Can we meet the SLA for this data processing task?” The new conversation is, “Of course, we can meet it. What’s the associated cost based on how many resources we assign?” We can make cost and resource trade-offs clear to our users and say “yes” more often to requirements that have measurable business value.
Supporting cost vs. performance decisions
Democratized access to internal analytics is a powerful decision-making tool. With BigQuery’s robust tooling, the decision about how to best allocate computational resources is in the hands of the analytics groups closest to the business decision being made. If they want to spend a sprint optimizing a dashboard, they can show exactly how much money it will save. If they choose not to optimize a report, they can offset the decision with concrete cost savings and other realized value.
Wayfair teams also benefit from visibility into their committed costs by abstracting away the details of the underlying services, including BigQuery slots, the virtual CPUs used to execute SQL queries.
Take a look at this example view consumed by our teams (the metrics for these dashboards are from the BigQuery INFORMATION_SCHEMA (jobs and reservations tables):
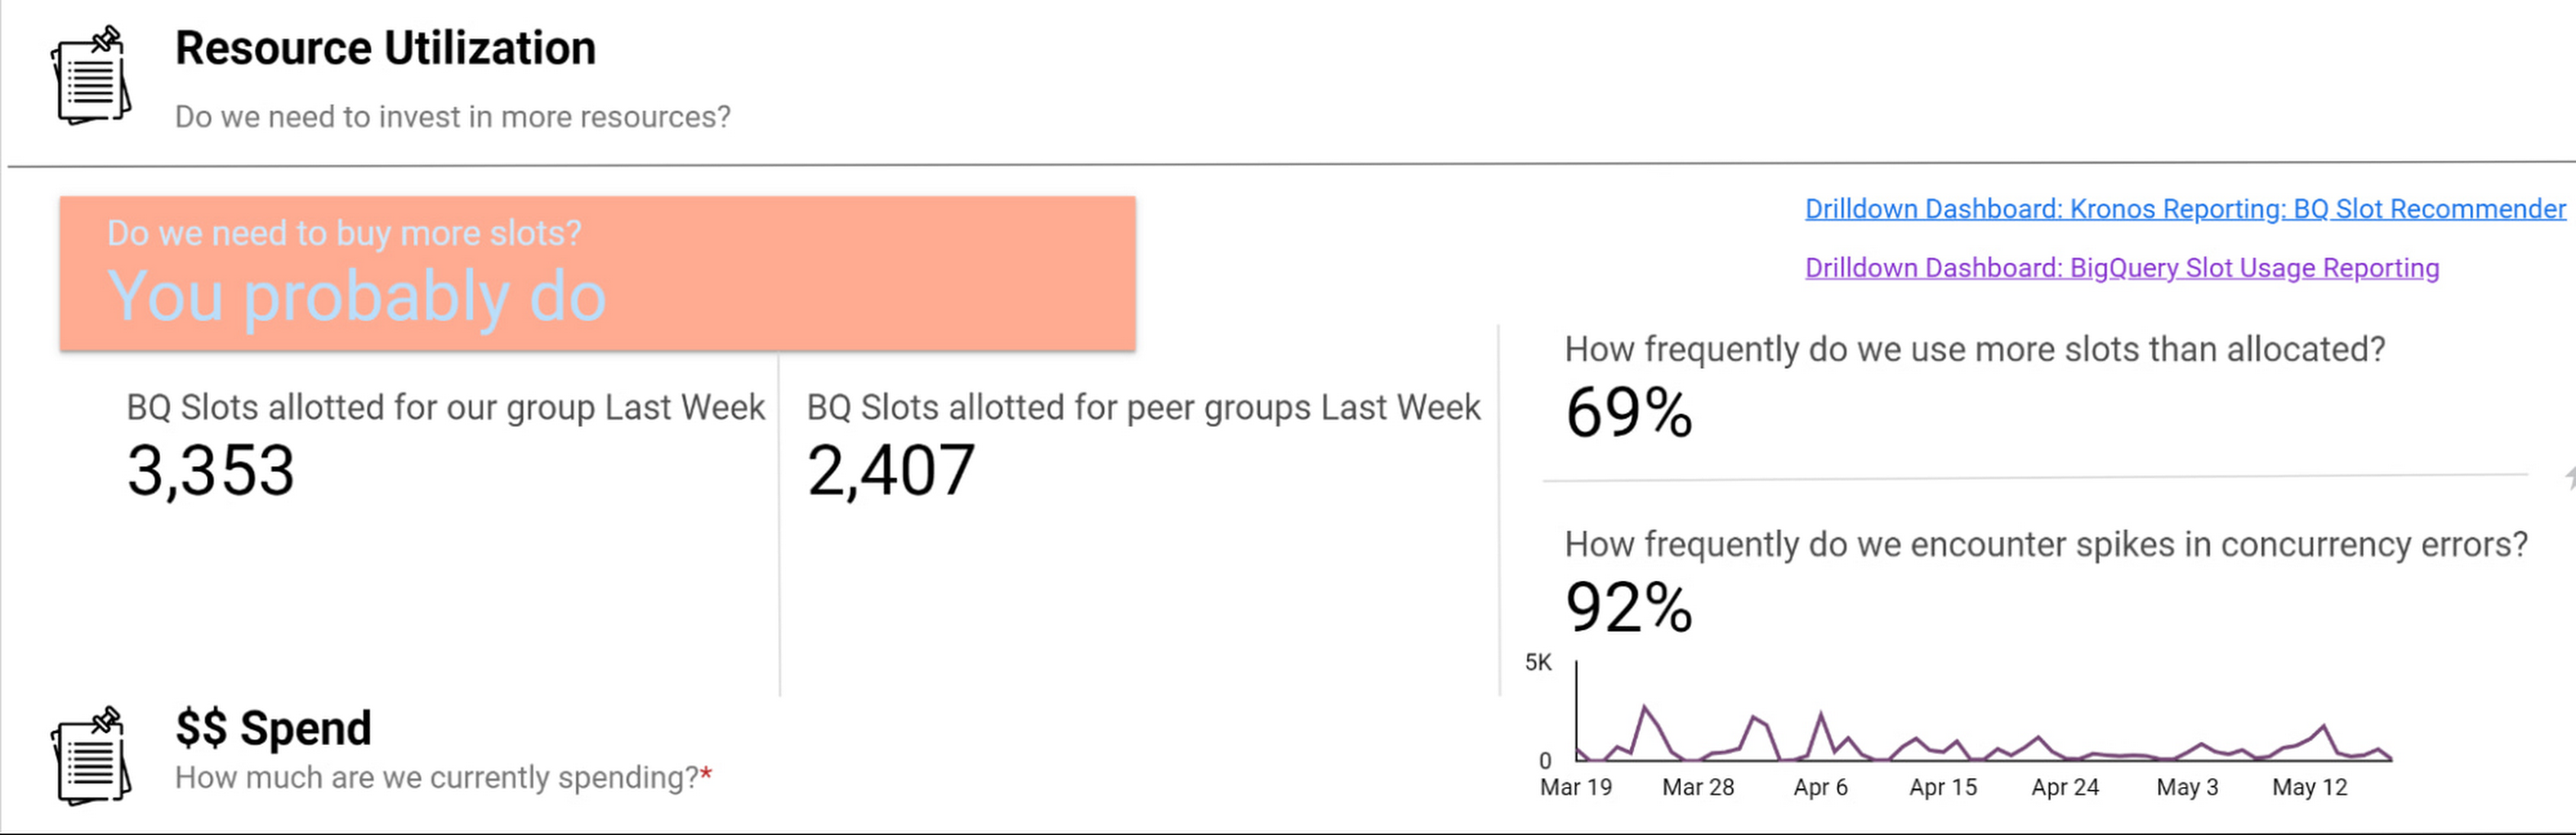
Suppose an organization wants to purchase capacity for a period of time. In that case, we provide an average cost for a slot during that time and charge them based on their slot usage for queries, multiplied by the average price.
Teams can see whether their consumption matches their reservations with a consistent, high-level number. We apply the same approach to tools like Dataproc by aggregating up the costs of component services and providing an organizational cost for those services.
How we use performance signals to improve user efficiency
Instead of overcorrecting for occasional performance fluctuations by allocating excessive resources, we try to align incentives so that people make the right choices for the business. Showback doesn’t work in a vacuum — it requires context and integrated insights. Teams need to show the cost of running a dashboard as well as the ROI is in terms of end user engagement and what peer dashboards with equivalent source datasets might cost.
We want to give users the freedom to do things the way they want and need to while also educating them on achieving their goals and using best practices to reduce their costs and improve their performance. The goal is never for all dashboards to load “less than x seconds” — we believe that any dashboard can load in x seconds when it is properly designed and resourced.
For instance, BigQuery allocates slots for a new workload quickly and efficiently, and queries that are optimized and have dedicated resources consistently complete quickly. When users experience a slowdown, it’s typically because they are sharing resources or inefficiently using their resources. Variable performance is a useful signal to help users discover opportunities to optimize queries and work more productively. We value these signals as we like to focus on the aggregate experience of all users interacting with the tool, not individual interaction.
A natural way to improve user efficiency is to reward ideal behaviors and discourage those that do not align with our analytics strategy. Some examples include splitting out high-demand reporting from ad-hoc exploration to reduce concurrency errors or encouraging people to use materialized tables instead of writing complex custom SQL. For instance, a dedicated reporting project might only include an organization’s Data Studio dashboard if it directly references a table or meets other optimization requirements. Using this approach, we give our users a high degree of freedom and experimentation at the entry-level while providing a well-documented path to scale.
Visibility into query performance improves business performance
The detailed tracking information we get from Google Cloud products is critical — Google’s robust analytics performance has enabled us to scale Data Studio to over 15,000 Wayfarians. Of course, a larger user base always comes with concerns that less sophisticated users may not appropriately optimize their queries or make the best use of the infrastructure.
Evaluating the different Data Studio dashboards helps us identify opportunities to use better query optimization practices, such as reducing custom queries, connecting directly to permanent tables, or using the BI Engine to improve dashboard performance. Recently, our team built new billing projects specific for Data Studio reporting. We can scale up a reservation dedicated to reporting about a major sales event in minutes.
Beyond everyday reporting, holidays and sales events may require higher, guaranteed performance. BigQuery’s flexible capacity commitments allow us to decide at a business level whether an urgent need requires us to reprioritize resources immediately or whether we have the time to optimize queries and rebuild dashboards to be performant. These new billing projects let us evaluate if teams need to scale up resourcing, what areas they can optimize in BigQuery, or if a new reservation is needed to resource that team separately.
Recommendations for achieving high performance at low cost
Are you wondering how to allocate BigQuery slots? Teams must see direct, immediate return on their investment in performance and optimization.
Our first rule of thumb is to align resource utilization with ownership as closely as possible. This makes it easier for teams to secure dedicated resources, even if they start out small. We’re comfortable doing this because BigQuery dynamically reassigns capacity between the targeted reservation and other consumers in milliseconds. We always get the total usage of our slots — there is no wasted capacity even when we break assignments down granularly.
Once a team has a reservation, we provide reporting that consumes various BigQuery information schema views, such as query logs and reservation information, and processes it into aggregated reporting. We look for metrics like the average slots available to a query at a point in time, overall query performance, and how long queries took to execute to pinpoint the overall health of a reservation against our business objectives. Flex slots also let us experiment easily with additional capacity, and BigQuery’s performance is so consistent that we can use straightforward models to estimate return on additional slot investment.
Other key cost optimization tips we have found helpful at Wayfair include:
- Optimize for worst-case performance. Given BigQuery’s ability to share slots, we expect teams will often see much better performance, but we find that thinking it’s more effective when teams think about the most pessimistic case when resourcing their jobs.
- Take advantage of BI Engine reservations. We like to think critically about the data and workload. BI Engine reservations are excellent for workloads that query lots of small dimension tables or a few larger tables loaded into memory. In cases like that, such as with OLAP tools using pre-computed aggregates, we’ve seen BI engine investments drive a 25% reduction in average query time—excellent ROI.
- Leverage Looker for large, longitudinal datasets. Since Looker supports a wide range of use cases, we see a broader range of performance — p50 is still under a second, but p95 can get as high as a minute. For these cases, we recommend modeling user patterns [first of month, first day of week] and dynamically allocating more slots for these periods while deprioritizing batch workloads in the key windows.
- Lean in heavily on the BQ cache for broad-based reporting. To avoid a Monday morning reporting lag, We use the BigQuery cache to avoid Monday morning report loading lags. Up to 30% of our Data Studio queries hit the BQ cache, ensuring our Data Studio p95 consistently stays under 10 seconds.
- Use slots-per-job to improve experience. In our reporting, we find that the most valuable view is slots-per-job. We look for dips in slots available for jobs as this situation often correlates strongly with poor user experiences. For example, our reporting showed us that Looker has the highest volumes of queries and users on Mondays and during each month’s first two business days. We used this information to scale up slots to support these periods of highest demand, delivering on performance SLAs to support business users.

- Get a global picture of usage. We manage slots in a central tool. Teams input their requirements into a calendar to indicate when they want higher or lower capacity to inform our flex slot purchases and annual commitments. It might seem like dozens of relatively inconsistent workloads at the team level, but the picture changes when you look at demand across a week (or our entire business). Understanding global usage makes it easy for us to model baseline capacity recommendations for serving year slots versus flexible demands.
Reaping the rewards of BigQuery
From our first initial undertaking with Google Cloud to transform our storefront, we had a lot of confidence in the underlying technology offerings and the teams that ran them and their ability to meet our unique requirements. But our experience using BigQuery for internal analytics at Wayfair has exceeded our already high expectations.
BigQuery’s fast, dynamic allocation of resources and ability to transform data in place are important to our mission of maintaining consistently high performance for our users while closely managing costs. Moreover, our visibility into query and dashboard performance through BigQuery’s DSP views and other performance metrics have helped us make clearer connections between performance goals and the costs required to meet them — and guide our analysts across the company towards attaining high performance on every project.
Dataflow Guarantees 50+% Increase in Developer Productivity and Infrastructure Cost Savings: Read More

8414
Of your peers have already read this article.
3:00 Minutes
The most insightful time you'll spend today!
In our conversations with technology leaders about data-driven transformation using Google Data Cloud – industry’s leading unified data and AI solution – , one important topic is incorporating continuous intelligence to move from answering questions such as “What has happened? to questions like “What is happening?” and “What might happen?”. The core to this evolution is the need for an underlying data processing that not only provides powerful real-time capabilities for events happening close to origination, but also brings together existing data sources under one unified data platform to enable organizations to draw insights and take actions holistically. Dataflow, Google’s cloud-native data processing and streaming analytics platform, is a key component of any modern data and AI architecture and data transformation journey, along with BigQuery, Google’s internet-scale warehouse with built-in streaming, BI engine and ML; Pub/Sub, a global no-ops event delivery service; and Looker, a modern BI and embedded analytics platform. One of the key evaluation factors is potential economic value of Dataflow to their organization, particularly in the context of engaging other stakeholders is key for many of the leaders that we engage with. So we commissioned Forrester Consulting to conduct a comprehensive study on the impact that Dataflow had on their organization by interviewing actual customers .
Today we’re excited to share our commissioned study conducted by Forrester Consulting, the Total Economic Impact™ of Google Cloud Dataflow, which allows data leaders to understand and quantify the benefits of Dataflow, and use cases it enables. Forrester conducted interviews with Dataflow customers to evaluate the benefits, costs, and risks of investing in Dataflow across an organization. Based on their interviews, Forrester identified major financial benefits across four different areas: business growth, infrastructure cost savings, data engineer productivity, and administration efficiency. In fact, Forrester found that customers adopting Dataflow can achieve a 55% boost in developer productivity and a 50% reduction in infrastructure costs. In fact, Forrester projects that customers adopting Dataflow can achieve a range of up to 171% Return on Investment (ROI) and a less than six months payback period. Customers can now use figures in the report to compute their own Return on Investment (ROI) and payback period.
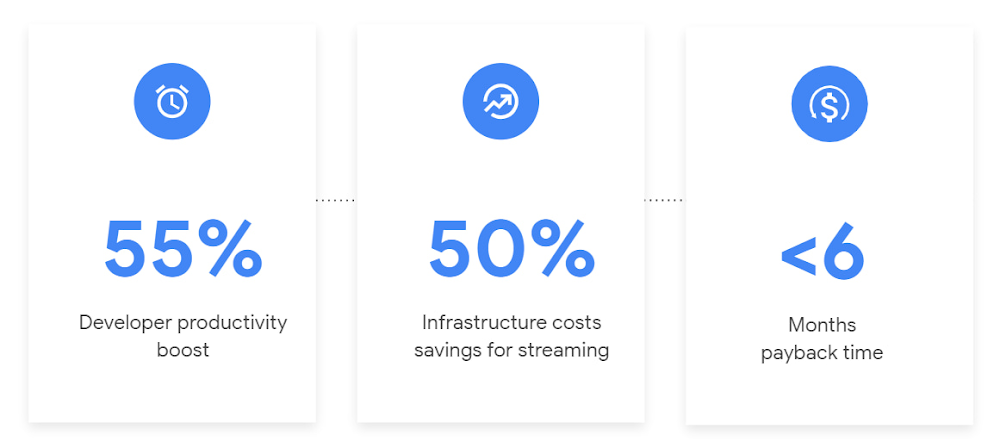
“Dataflow is integral to accelerating time-to-market, decreasing time-to-production, reducing time to figure out how to use data for use cases, focusing time on value-add tasks, streamlining ingestion, and reducing total cost of ownership.” – Lead technical architect, CPG
Let’s take a deeper look at the ways that Forrester found that Dataflow can help you achieve your goals and unlock your business potential.
Benefit #1: Increase data engineer productivity by 55%
Developers can choose among a variety of programming languages to define and execute data workflows. Dataflow also seamlessly integrates with other Google Cloud Platform and open source technologies to maximize value and applicability to a wide variety of use cases. Dataflow streamlined workflows with code reusability,dynamic templates, and the simplicity of a managed service. Engineers trusted pipelines to run correctly and adhere to governance. Data engineers avoided laborious issue-monitoring and remediation tasks that were common in the legacy environments such as poor performance, lack of availability, and failed jobs. Teams valued the language flexibility and open source base.
“Dataflow provided us with ETL replacement that opened limitless potential use cases and enabled us to do smarter data enhancement while data remains in motion.” — Director of data projects, financial services
Benefit #2: Reduce infrastructure costs by up-to 50% for batch and streaming workloads
Dataflow’s serverless autoscaling and discrete control of job needs, scheduling, and regions eliminated overhead and optimized technology spending. Consolidating global data processing solutions to Dataflow further eliminated excess costs while ensuring performance, resilience, and governance across environments. Dataflow’s unified streaming and batch data platform gives organizations the flexibility to define either workload in the same programming model, run it on the same infrastructure, and manage it from a single operational management tool.
“Our costs with our cloud data platform using Dataflow are just a fraction of the costs we faced before. Now we only pay for cloud infrastructure consumption because the open source base helps us avoid licensing costs. We spend about $120,000 per year with Dataflow, but we’d be spending millions with our old technologies.” – Lead technical architect, CPG
Benefit #3: Increase top-line revenue by improving customer experience and retention with payback time of < 6 months
Streaming analytics is an essential capability in today’s digital world to gain real-time actionable insights. Likewise, organizations must also have flexible, high- performance batch environments to analyze historical data for building machine learning models, business intelligence, and advanced analytics. Dataflow enabled real-time streaming use cases, improved data enrichment, encouraged data exploration,improved performance and resiliency, reduced errors, increased trust, and eliminated barriers to scale. As a result, organizations provided customers with more accurate, relevant, and in-the-moment data-backed services and insights — boosting customer experience, creating new revenue streams, and improving acquisition, retention, and enrichment.
“It’s already been proven that we are getting more business [with Dataflow] because we can turn around results faster for customers.” – VP of technology, financial services technology
“When we provide data to our customers and partners with Dataflow, we are much more confident in those numbers and can provide accurate data within a minute. Our customers and partners have taken note and commented on this. It’s reduced complaints and prevented churn.” – Senior software engineer, media
Other benefits
Eliminated administrative overhead and toil
As a cloud-native managed service, all administration tasks such as provisioning, scaling, and updates are automatically handled by Google Cloud. Teams no longer need to manage servers and related software for legacy data processing solutions. Admins also streamlined processes for setting up data sources, adding pipelines, and enforcing governance.
Saved business operations costs for support teams and data end users
Dataflow improved the speed, quality, reliability, and ease of access to data for insights for general business users, saving time and empowering users to drive better data-backed outcomes. It also reduced support inquiry volume while automating manual job creation.
What’s next?
Download the Forrester Total Economic Impact study today to dive deep into the economic impact Dataflow can deliver your organization. We would love to partner with you to explore the potential Dataflow can unlock in your teams. Please reach out to our sales team to start a conversation about your data transformation with Google Cloud.
Transform ‘Dark Data’ from Documents with Document AI, Cloud Functions and Workflows

8223
Of your peers have already read this article.
2:00 Minutes
The most insightful time you'll spend today!
At enterprises across industries, documents are at the center of core business processes. Documents store a treasure trove of valuable information whether it’s a company’s invoices, HR documents, tax forms and much more. However, the unstructured nature of documents make them difficult to work with as a data source. We call this “dark data” or unstructured data that businesses collect, process and store but do not utilize for purposes such as analytics, monetization, etc. These documents in pdf or image formats, often trigger complex processes that have historically relied on fragmented technology and manual steps. With compute solutions on Google Cloud and Document AI, you can create seamless integrations and easy to use applications for your users. Document AI is a platform and a family of solutions that help businesses to transform documents into structured data backed by machine learning. In this blog post we’ll walk you through how to use Serverless technology to process documents with Cloud Functions, and with workflows of business processes orchestrating microservices, API calls, and functions, thanks to Workflows.
At Cloud Next 2021, we presented how to build easy AI-powered applications with Google Cloud. We introduced a sample application for handling incoming expense reports, analyzing expense receipts with Procurement Document AI, a DocAI solution for automating procurement data capture from forms including invoices, utility statements and more. Then organizing the logic of a report approval process with Workflows, and used Cloud Functions as glue to invoke the workflow, and do analysis of the parsed document.
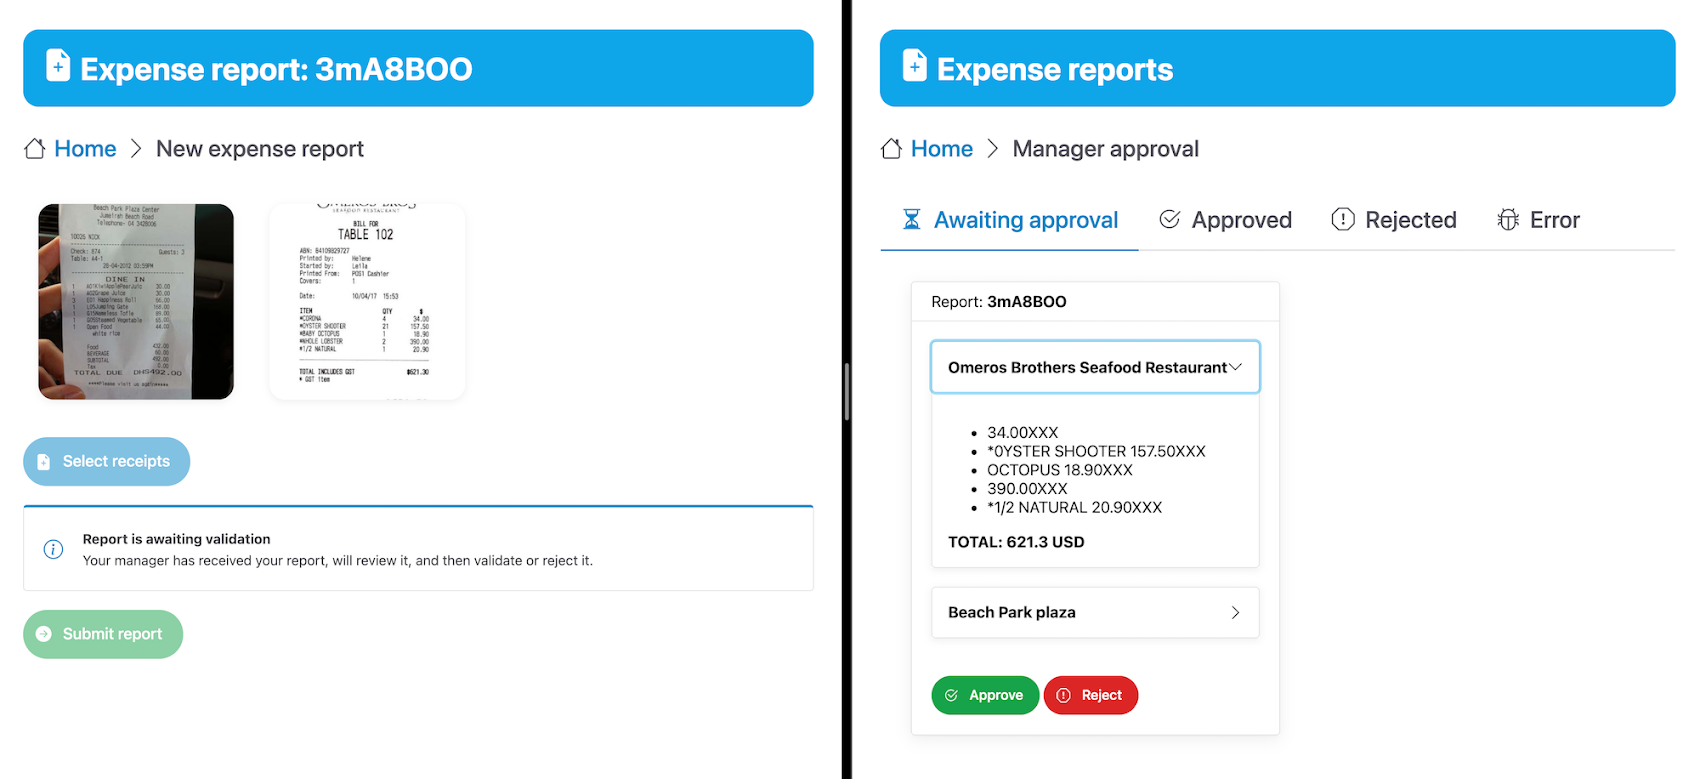
We also open sourced the code on this Github repository, if you’re interested in learning more about this application.
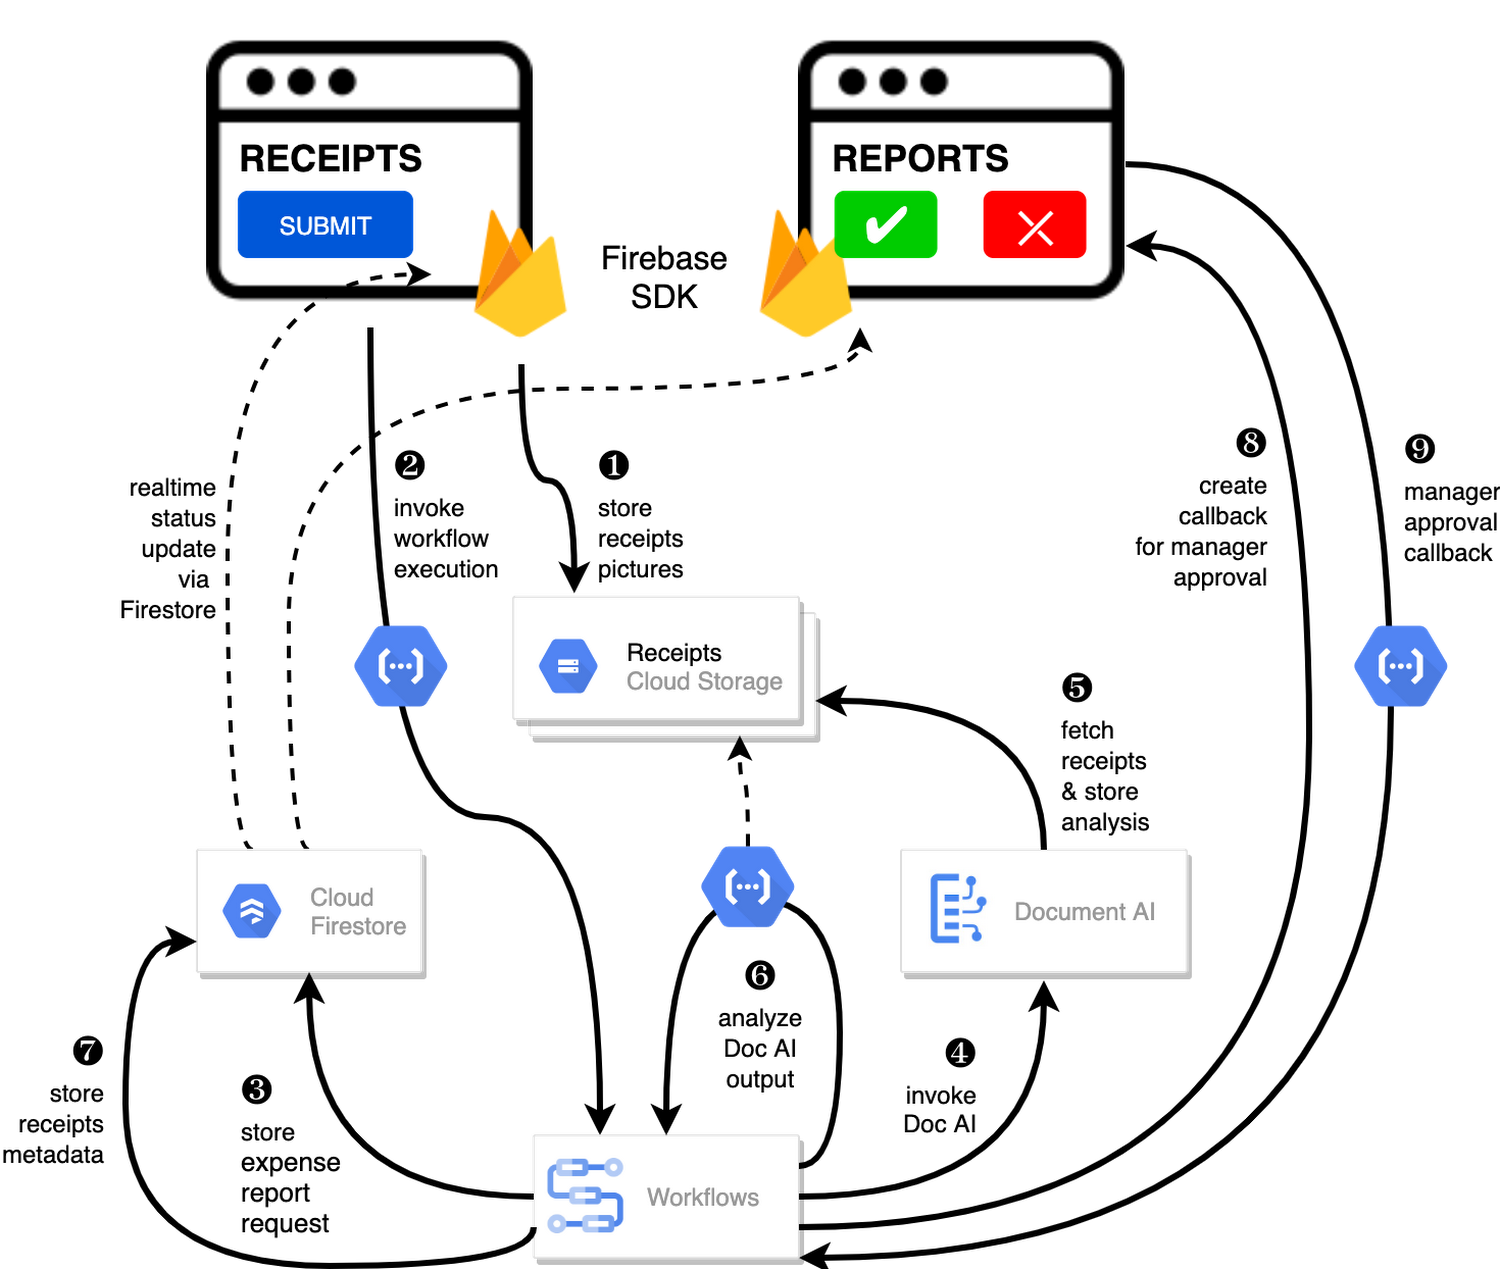
In the above diagram, there are two user journeys: the employee submitting an expense report where multiple receipts are processed at once, and the manager validating or rejecting the expense report.
First, the employee goes to the website, powered by Vue.js for the frontend progressive JavaScript framework and Shoelace for the library of web components. The website is hosted via Firebase Hosting. The frontend invokes an HTTP function that triggers the execution of our business workflow, defined using the Workflows YAML syntax.
Workflows is able to handle long-running operations without any additional code required, in our case we are asynchronously processing a set receipt files. Here, the Document AI connector directly calls the batch processing endpoint for service. This API returns a long-running operation: if you poll the API, the operation state will be “RUNNING” until it has reached a “SUCCEEDED” or “FAILED” state. You would have to wait for its completion. However, Workflows’ connectors handle such long-running operations, without you having to poll the API multiple times till the state changes. Here’s how we call the batch processing operation of the Document AI connector:
- invoke_document_ai:call: googleapis.documentai.v1.projects.locations.processors.batchProcessargs:name: ${"projects/" + project + "/locations/eu/processors/" + processorId}location: "eu"body:inputDocuments:gcsPrefix:gcsUriPrefix: ${bucket_input + report_id}documentOutputConfig:gcsOutputConfig:gcsUri: ${bucket_output + report_id}skipHumanReview: trueresult: document_ai_response
Machine learning uses state of the art Vision and Natural Language Processing models to intelligently extract schematized data from documents with Document AI. As a developer, you don’t have to figure out how to fine tune or reframe the receipt pictures, or how to find the relevant field and information in the receipt. It’s Document AI’s job to help you here: it will return a JSON document whose fields are: line_item, currency, supplier_name, total_amount, etc. Document AI is capable of understanding standardized papers and forms, including invoices, lending documents, pay slips, driver licenses, and more.
A cloud function retrieves all the relevant fields of the receipts, and makes its own tallies, before submitting the expense report for approval to the manager. Another useful feature of Workflows is put to good use: Callbacks, that we introduced last year. In the workflow definition we create a callback endpoint, and the workflow execution will wait for the callback to be called to continue its flow, thanks to those two instructions:
- create_callback:call: events.create_callback_endpointargs:http_callback_method: "POST"result: callback_details...- await_callback:try:call: events.await_callbackargs:callback: ${callback_details}timeout: 3600result: callback_requestexcept:as: esteps:- update_status_to_error:...
In this example application, we combined the intelligent capabilities of Document AI to transform complex image documents into usable structured data, with Cloud Functions for data transformation, process triggering, and callback handling logic, and Workflows enabled us to orchestrate the underlying business process and its service call logic.
Going further
If you’re looking to make sense of your documents, turning dark data into structured information, be sure to check out what Document AI offers. You can also get your hands on a codelab to get started quickly, in which you’ll get a chance at processing handwritten forms. If you want to explore Workflows, quickstarts are available to guide you through your first steps, and likewise, another codelab explores the basics of Workflows. As mentioned earlier, for a concrete example, the source code of our smart expense application is available on Github. Don’t hesitate to reach out to us at @glaforge and @asrivas_dev to discuss smart scalable apps with us.
More Relevant Stories for Your Company

How to Enhance Incremental Pipeline Performance while Ingesting Data into BigQuery
When you build a data warehouse, the important question is how to ingest data from the source system to the data warehouse. If the table is small you can fully reload a table on a regular basis, however, if the table is large a common technique is to perform incremental

Analytics Hub for Secure Data Sharing and Analytics Unlocks True Data Value and Insights
Customers tell us that sharing and exchanging data with other organizations is a critical element of their analytics strategy, but it’s hamstrung by unreliable data and processes, and only getting harder with security threats and privacy regulations on the rise. Furthermore, traditional data sharing techniques use batch data pipelines that are

Architecting Multi-region Database Disaster Recovery for MySQL
Enterprises expect extreme reliability of the database infrastructure that’s accessed by their applications. Despite your best intentions and careful engineering, database errors happen, whether that’s machine crashes or network partitioning. Good planning can help you stay ahead of problems and recover more quickly when issues do occur. This blog shows one approach

Built with BigQuery: Retailers Unlock the Value of Data with SoundCommerce
As economic conditions change, retail brands’ reliance on ever-growing customer demand puts these companies at financial and even existential risk. Top-line revenue and active customer growth do not equal profitable growth. Despite multi-billion dollar valuations for some brands, especially those operating the direct-to-consumer model, the rising costs of meeting shoppers’
