





Become Truly Data-driven with Unified Analytics Platform Built on Google Cloud

3680
Of your peers have already read this article.
2:00 Minutes
The most insightful time you'll spend today!
Every company these days is becoming a data company whether they know it or not. This results in preparing the company to create an ecosystem for data processing. Traditionally, organisations’ data ecosystems consisted of point solutions that used to provide data services. For example, one of the most common questions we get from customers is, “Do I need a data lake, or should I consider a data warehouse? Do you recommend I consider both?” Traditionally, these two architectures have been viewed as separate systems, applicable to specific data types and user skill sets. Increasingly, we are seeing a blurring of lines between data warehouses and data lakes, which provide customers with an opportunity to create a more comprehensive platform that gives them the best of both worlds.
What if we don’t need to compromise? And we create an end-to-end solution compromising the entire data management and processing stages, from data collection to serving. Thus, Data platforms are typically used to store vast amounts of data in varying formats and doing so without compromising on latency. At the same time, providing a platform for all users throughout the data lifecycle.
Emerging Trends
There are data solutions and architectures we’re seeing and anticipating. Emerging concepts include data lakehouses, data meshes, and data vaults. Some are not new and have been around in different shapes and formats, however, all of them work naturally within a Google Cloud environment. Lets look into both ends of the spectrum of enabling data and enabling teams.
Data mesh facilitates a decentralized approach to data ownership, allowing individual lines of business to publish and subscribe to data in a standardized manner, instead of forcing data access and stewardship through a single, centralized team. On the other hand, a data lake house brings raw and processed data closer together, allowing for a more streamlined and centralized repository of data needed throughout the organization. Processing can be done in transit via ELT, reducing the need to copy datasets across systems. This allows for easier data exploration and easier governance. Data vault is designed to separate data driven and model driven parts, so the way data is integrated in the raw vault enables parallel loading so that large implementations can scale out easily.
In Google Cloud, there is no need to keep them separate. In fact, with interoperability among our portfolio of data analytics products, you can easily provide access to data residing in different places, effectively bringing your data lake and data warehouse together on a single platform.
Let’s look at some of the technological innovations that make this reality. BigQuery’s storage API allows treating a data warehouse like a data lake, letting you access the data residing in BigQuery. For example, you can use Spark to access data residing in the data warehouse without it affecting performance of any other jobs accessing it. This is all made possible by the underlying architecture, which separates compute and storage.
We continue to offer specialized products and solutions around data lake and data warehouse functionality but over time we expect to see a significant enough convergence of the two systems that the terminology will change. At Google Cloud, we consider this combination an “analytics data platform”.
Tactical or Strategical
Key differentiators of Google Cloud’s data analytics platform are being open, intelligent, flexible, and tightly integrated. There are many technologies in the market which provide tactical solutions that may feel comfortable and familiar. However, this can be a rather short-term approach that simply lifts and shifts a siloed solution into the cloud. In contrast, an analytics data platform built on Google Cloud provides modern data warehousing and data lake capabilities with close integration to our AI Platform. It also provides built-in streaming, ML, and geospatial capabilities and an in-memory solution for BI use cases. Depending on your organizational data needs, Google Cloud has the set of products, tools, and services to create the right data platform for you.
To become a truly data-driven organization, the first step is to design and implement an analytics data platform that meets your technical and business needs. Whether you want to empower teams to own, publish, and share their data across the organization, or you want to create a streamlined store of raw and processed data for easier discovery, there is a solution that best meets the needs of your company.
To learn more about the elements of a unified analytics data platform built on Google Cloud, and the differences in platform architectures and organizational structures, read our Unified Analytics Platform paper.

Is it Cheaper to Run Oracle Workloads on Google Cloud Than On-Prem? Yes, By 78%
DOWNLOAD RESEARCH REPORTS4238
Of your peers have already downloaded this article
3:30 Minutes
The most insightful time you'll spend today!
On-premises relational database management systems (RDBMS) are the traditional heart of many core business operations, but cloud-based relational databases provide the agility and scalability of the cloud while eliminating many of the onerous tasks associated with maintaining your own infrastructure.
To find out how much more value cloud-based relational databases provide, research firm ESG compared an on-premises RDBMS strategy against hosting the same data on one of Google Cloud’s database offerings, called Cloud Spanner.
Its analysis showed that hosting the same data using Google Cloud Spanner is 78% less expensive than using on-premises servers–and up to 37% less expensive than using other cloud databases.
Here’s a quick snapshot of where those benefits stem from:
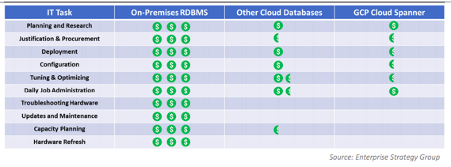
To read the full report and discover how Google Cloud Spanner ranked against other cloud-based database offerings, download ESG’s report, Analyzing the Economic Benefits of Google Cloud Spanner Relational Database Service.
Analytics Hub for Secure Data Sharing and Analytics Unlocks True Data Value and Insights

6762
Of your peers have already read this article.
2:30 Minutes
The most insightful time you'll spend today!
Customers tell us that sharing and exchanging data with other organizations is a critical element of their analytics strategy, but it’s hamstrung by unreliable data and processes, and only getting harder with security threats and privacy regulations on the rise.
Furthermore, traditional data sharing techniques use batch data pipelines that are expensive to run, create late arriving data, and can break with any changes to the source data. They also create multiple copies of data, which brings unnecessary costs and can bypass data governance processes. These techniques do not offer features for data monetization, such as managing subscriptions and entitlements. Altogether, these challenges mean that organizations are unable to realize the full potential of transforming their business with shared data.
To address these limitations, we are introducing Analytics Hub, a new fully managed service, available in Q3, in preview, that helps you unlock the value of data sharing, leading to new insights and increased business value. With Analytics Hub you get:
- A rich data ecosystem by publishing and subscribing to analytics-ready datasets.
- Control and monitoring over how your data is being used, because data is shared in one place.
- A self-service way to access valuable and trusted data assets, including data provided by Google. For example, a unique dataset from Google Search Trends will be available, that you can query and combine with your own data.
- An easy way to monetize your data assets without the overhead of building and managing the infrastructure.
Built on a decade of cross-organizational sharing
While Analytics Hub is a new service, it builds on BigQuery, Google’s petabyte-scale, serverless cloud data warehouse. BigQuery’s unique architecture provides separation between compute and storage, enabling data publishers to share data with as many subscribers as you want without having to make multiple copies of your data. With BigQuery, there are no servers to deploy or manage, which means that data consumers get immediate value from shared data. Data can be provided and consumed in real-time using the streaming capabilities of BigQuery and you can leverage the built in machine learning, geospatial, and natural language capabilities of BigQuery or take advantage of the native business intelligence support with tools like Looker, Google Sheets, and Data Studio.
BigQuery has had cross-organizational, in-place data sharing capabilities since it was introduced in 2010. We took a look at usage metrics in BigQuery and found that over a 7 day period in April, we had over 3,000 different organizations sharing over 200 petabytes of data. These numbers don’t include data sharing between departments within the same organization.
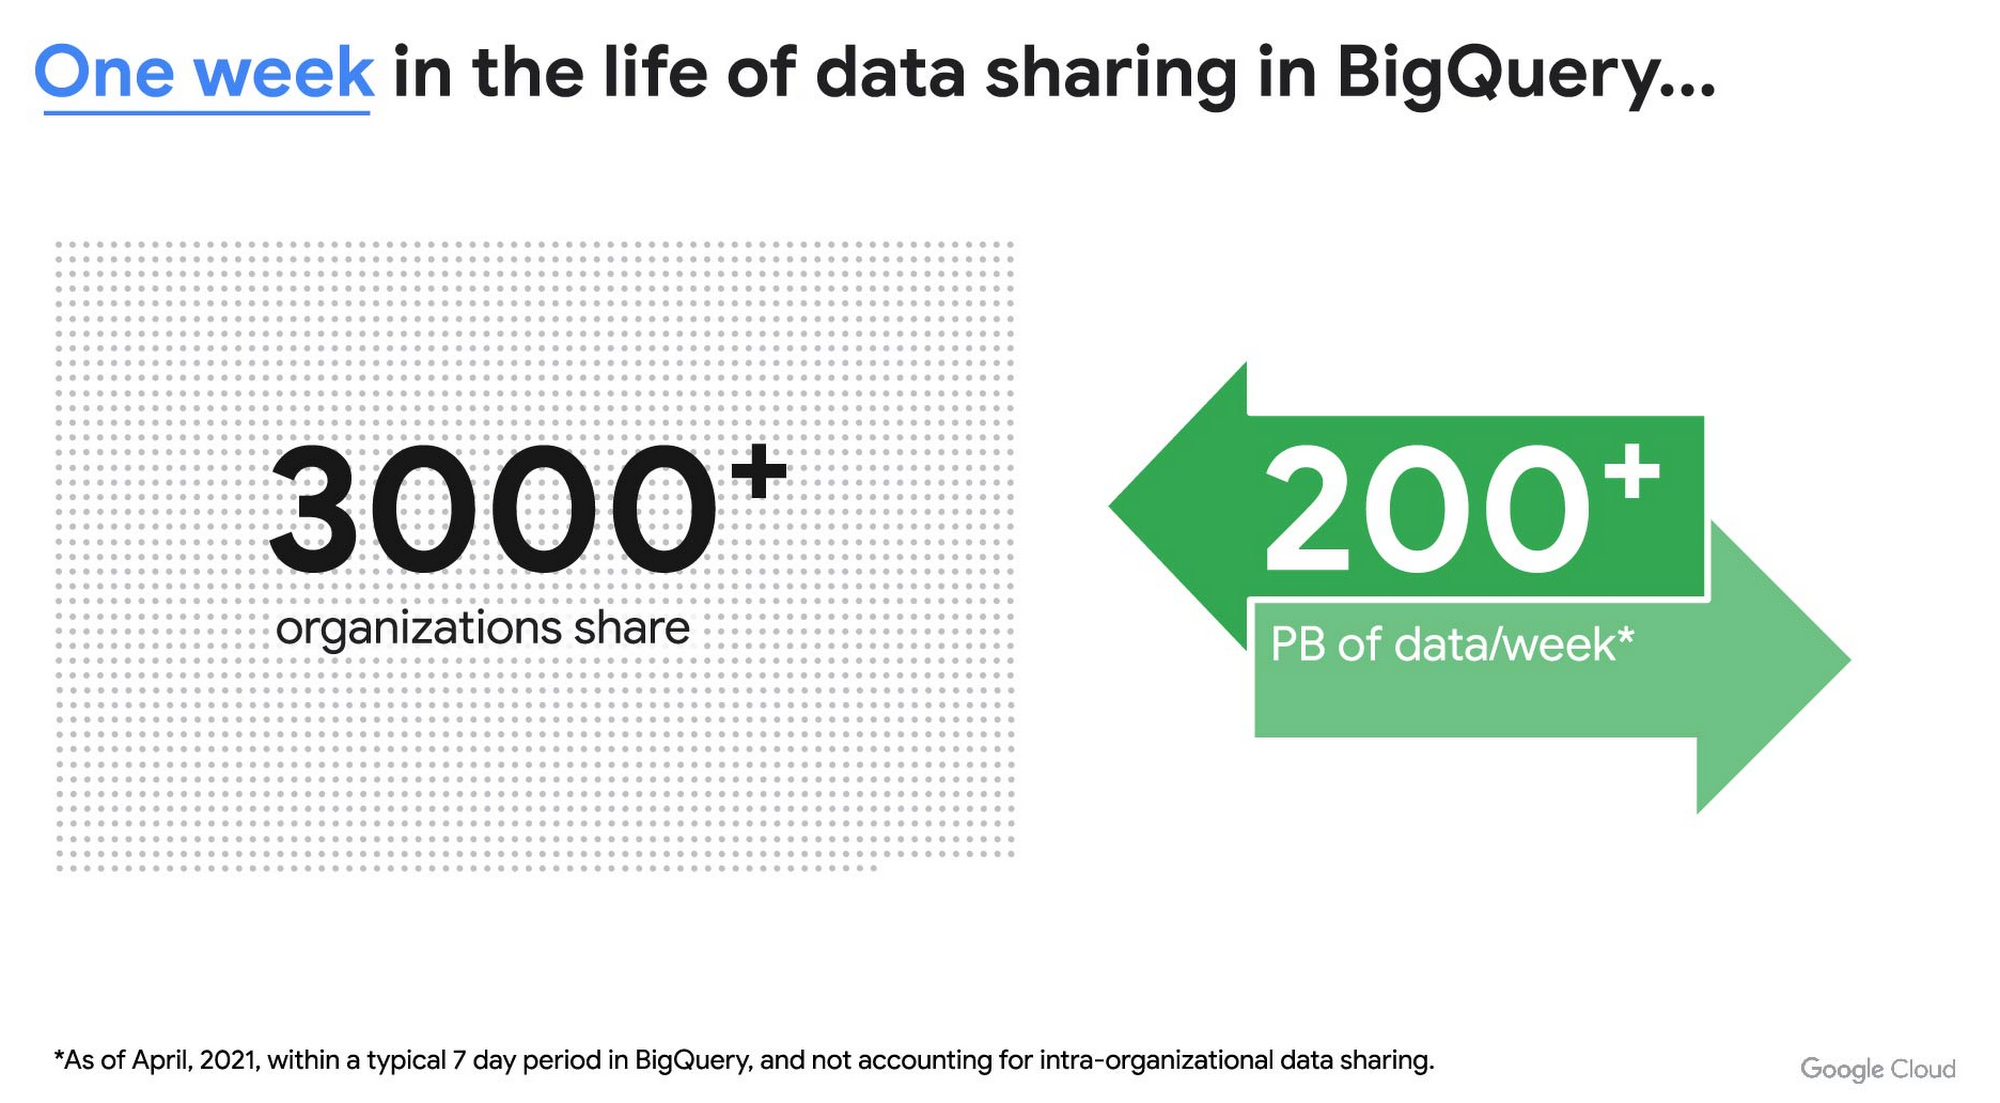
As you can see, data sharing in BigQuery is already popular. But we want to make it easier and even more scalable.
Raising the bar on data sharing
To make data sharing easier and more scalable in BigQuery, Analytics Hub introduces the concepts of shared datasets and exchanges. As a data publisher, you create shared datasets that contain the views of data that you want to deliver to your subscribers. Next, you create exchanges, which are used to organize and secure shared datasets. By default, exchanges are completely private, which means that only the users and groups that you give access to can view or subscribe to the data. You can also create internal exchanges or leverage public exchanges provided by Google. Finally, you publish shared datasets into an exchange to make them available to subscribers.
Data subscribers search through the datasets that are available across all exchanges for which they have access and subscribe to relevant datasets. This creates a linked dataset in their project that they can query and join with their own data. Subscribers pay for the queries that they run against the data while the publisher pays for the storage of the data. Data providers can add new data, new tables, or new columns to the shared dataset and these will be immediately available to subscribers. In addition, the publisher can track subscribers, disable subscriptions, and see aggregated usage information for the shared data.
Analytics Hub makes it easy for you to publish, discover, and subscribe to valuable datasets that you can combine with your own data to derive unique insights. Here are some types of data that will be available through Analytics Hub:
- Public datasets: Easy access to the existing repository of over 200 public datasets, including data about weather and climate, cryptocurrency, healthcare and life sciences, and transportation.
- Google datasets: Unique, freely-available datasets from Google. One example of this is the COVID-19 community mobility dataset. Another example is the forthcoming Google Trends dataset, which will provide the top 25 search terms and top 25 rising search terms over a 5 year window in 210 distinct locations in the US. Trends data can be used by everyone in the organization to gain insights into what customers care about.
- Commercial (paid for) datasets: We are working with leading commercial data providers to bring their data products to Analytics Hub. If you are interested in delivering your data via Analytics Hub, we’re also introducing Data Gravity, an initiative that provides storage benefits and new distribution paths for data published through Analytics Hub.
- Internal datasets: We know that data sharing can be challenging in larger organizations. Analytics Hub can be used for internal data, for example, to share standardized customer demographics with your sales engineering and data science teams.
Customers and partners using Analytics Hub

“Google Search Trends data has always been an important tool for our WPP agency data teams. At WPP we believe that data variety is a superpower which is why we are excited to use the new Trends dataset availability within BigQuery, plus the launch of Analytics Hub. The best creativity in the world is informed by data insights, and influenced by what people search for, so the operational efficiencies we’ll gain via the Analytics Hub and the insights we can drive with Trends data are just phenomenal.”
—Di Mayze Global Head of Data and AI, WPP

“Equifax Ignite is our shared data analytics environment within our Equifax data fabric. We are excited to partner with Google to leverage Analytics Hub and BigQuery to deliver data to over 400 statisticians and data modelers as well as securely sharing data with our partner financial institutions.”
—Kumar Menon, SVP Data Fabric and Decision Science, Equifax

“The flow of data and insights between our teams at Deloitte and our clients is paramount for building truly transformational data cultures. With its purpose-built architecture for secure data exchanges and sharing analytics resources, Google Cloud’s Analytics Hub can help provide significant operational efficiencies for how Deloitte teams support our clients’ data-driven initiatives within their industry ecosystems. It will also help minimize the worries about scale, privacy and security, or the administrative burden associated with each.”
—Navin Warerkar, Managing Director, Deloitte Consulting LLP, and US Google Cloud Data & Analytics GTM Lead

“Crux Informatics is proud to partner with Google to support the launch of Analytics Hub, removing friction for those who need access to analytics-ready data. With thousands of datasets from over 140 sources, Crux Informatics will accelerate access to data on Analytics Hub and together provide a more efficient and cost effective solution to deliver datasets in Google Cloud’s ecosystem.”
—Will Freiberg, CEO, Crux Informatics
Next steps for Analytics Hub
This is just the beginning for Analytics Hub. As we get to preview and general availability, we will be adding additional capabilities, including workflows for publishing and subscribing, publishing analytics assets (Looker Blocks, Data Studio reports, Connected Google Sheets) along with the shared data, the ability for data publishers to specify query restrictions on the usage of their data, and making it easy for data publishers to create sandbox environments for subscribers to work with their data, even if they are not yet on Google Cloud. We will provide features in Analytics Hub for monetization of data, including managing subscriptions, data entitlements, and billing.
Please sign up for the preview, which is scheduled to be available in the third quarter of 2021. In the meantime, you can learn more about BigQuery and how to leverage its built-in data sharing capabilities. Please go to g.co/cloud/analytics-hub to register your interest in Analytics Hub.
Choose the Right Google Database Service With This Chart

4757
Of your peers have already read this article.
2:30 Minutes
The most insightful time you'll spend today!
A growing number of Indian enterprises are leveraging the Google Cloud to run their database workloads.
This is because Google Cloud offers fully managed, scalable database services to support all applications today and tomorrow.
In fact, Forrester has named Google as a Leader in The Forrester Wave™: Database-as-a-Service, Q2 2019.
The first question many {$persona}s ask is: Which database type is best for my specific workload or use case? Here are two tables that will help you get that answer. Click on the images.
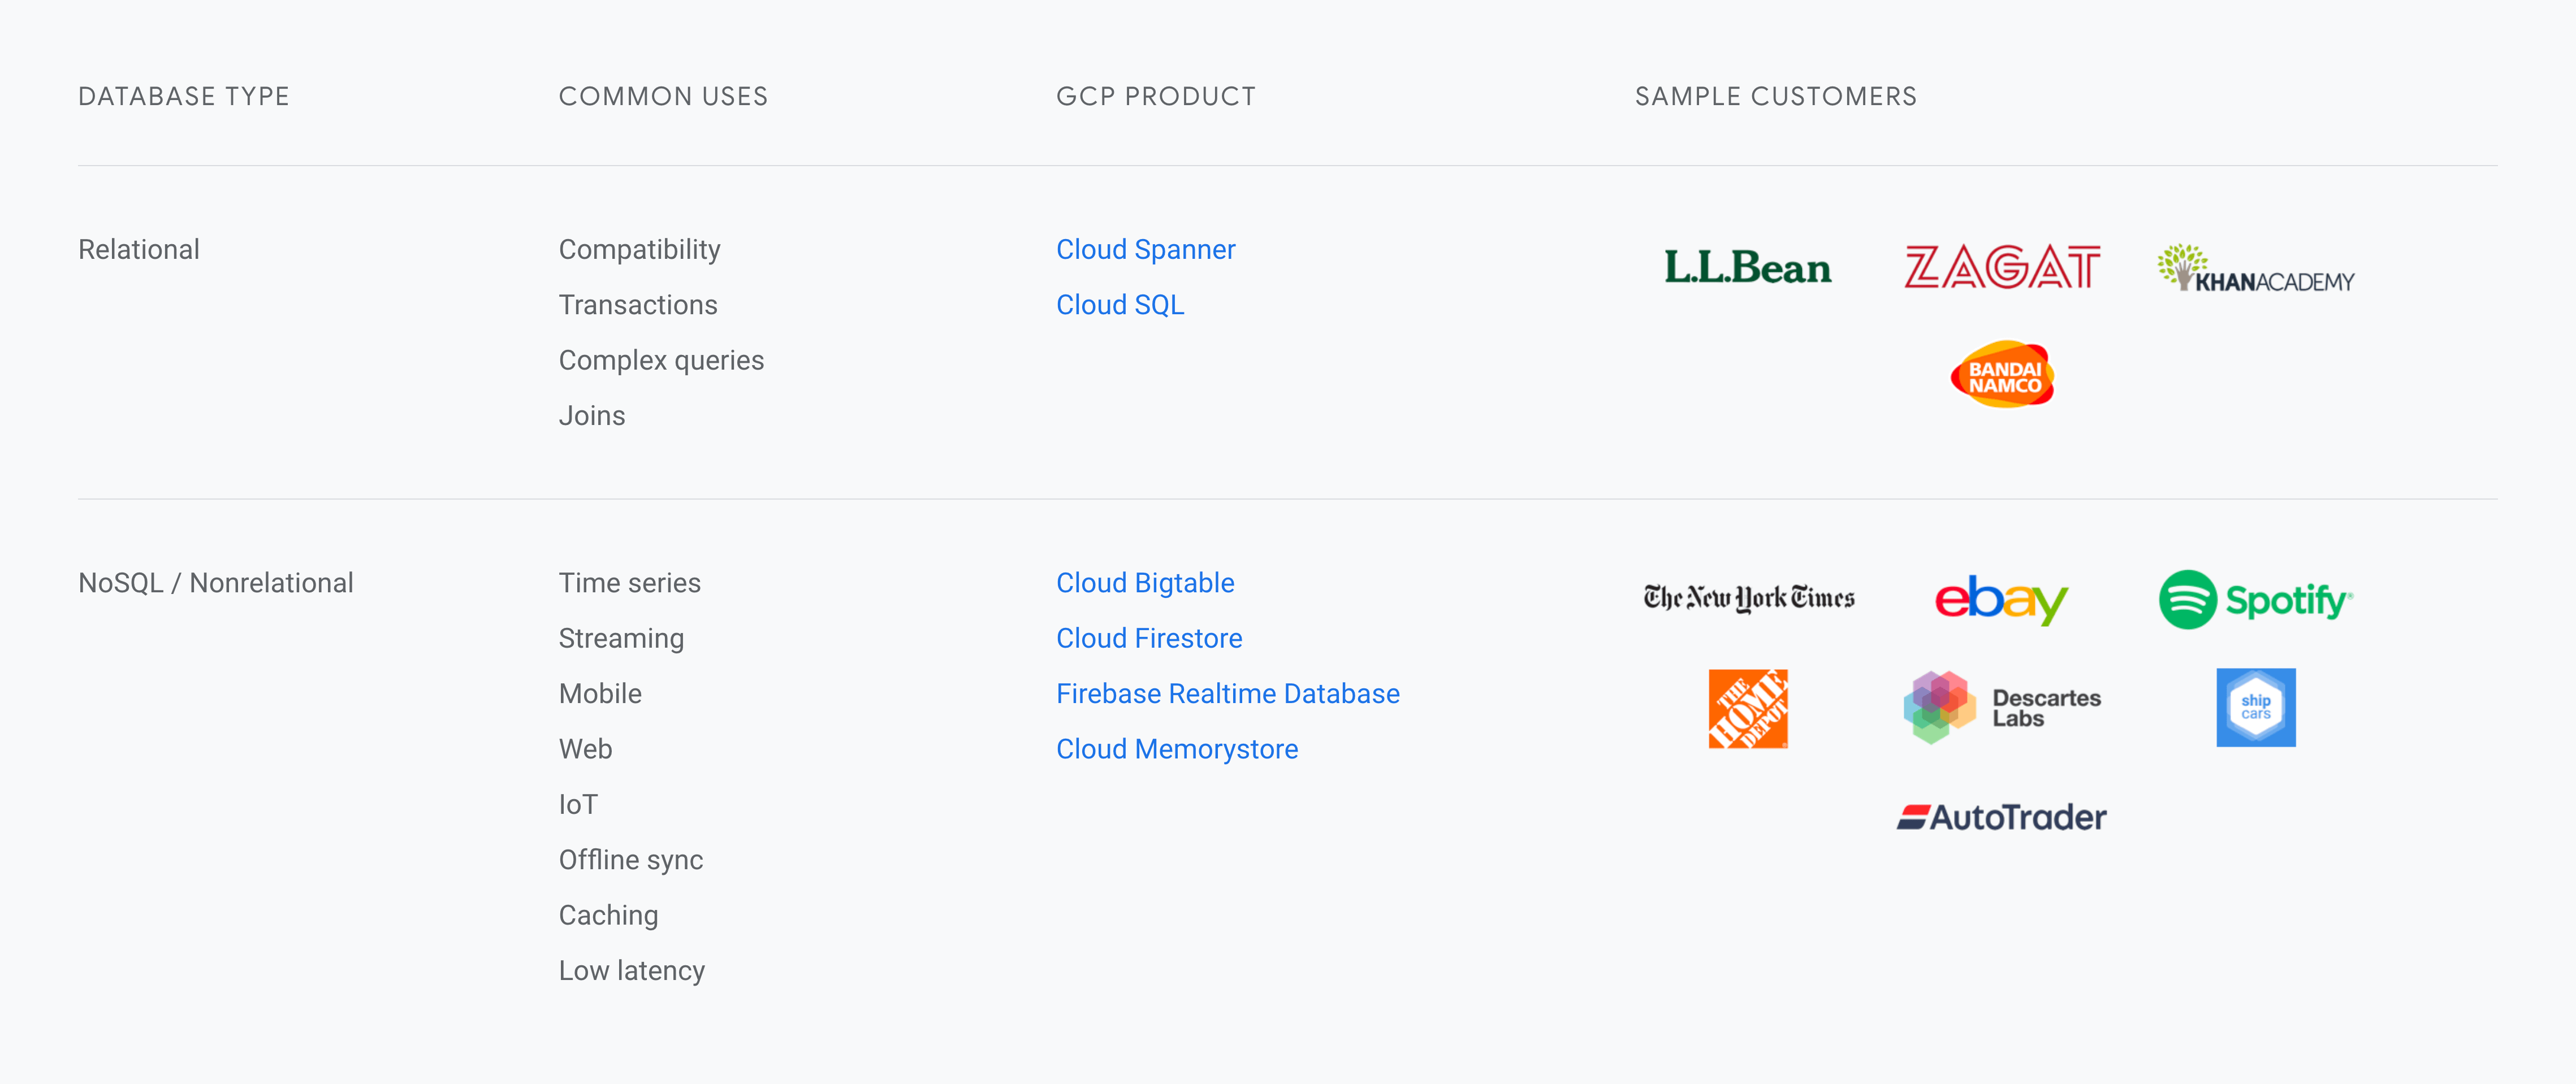
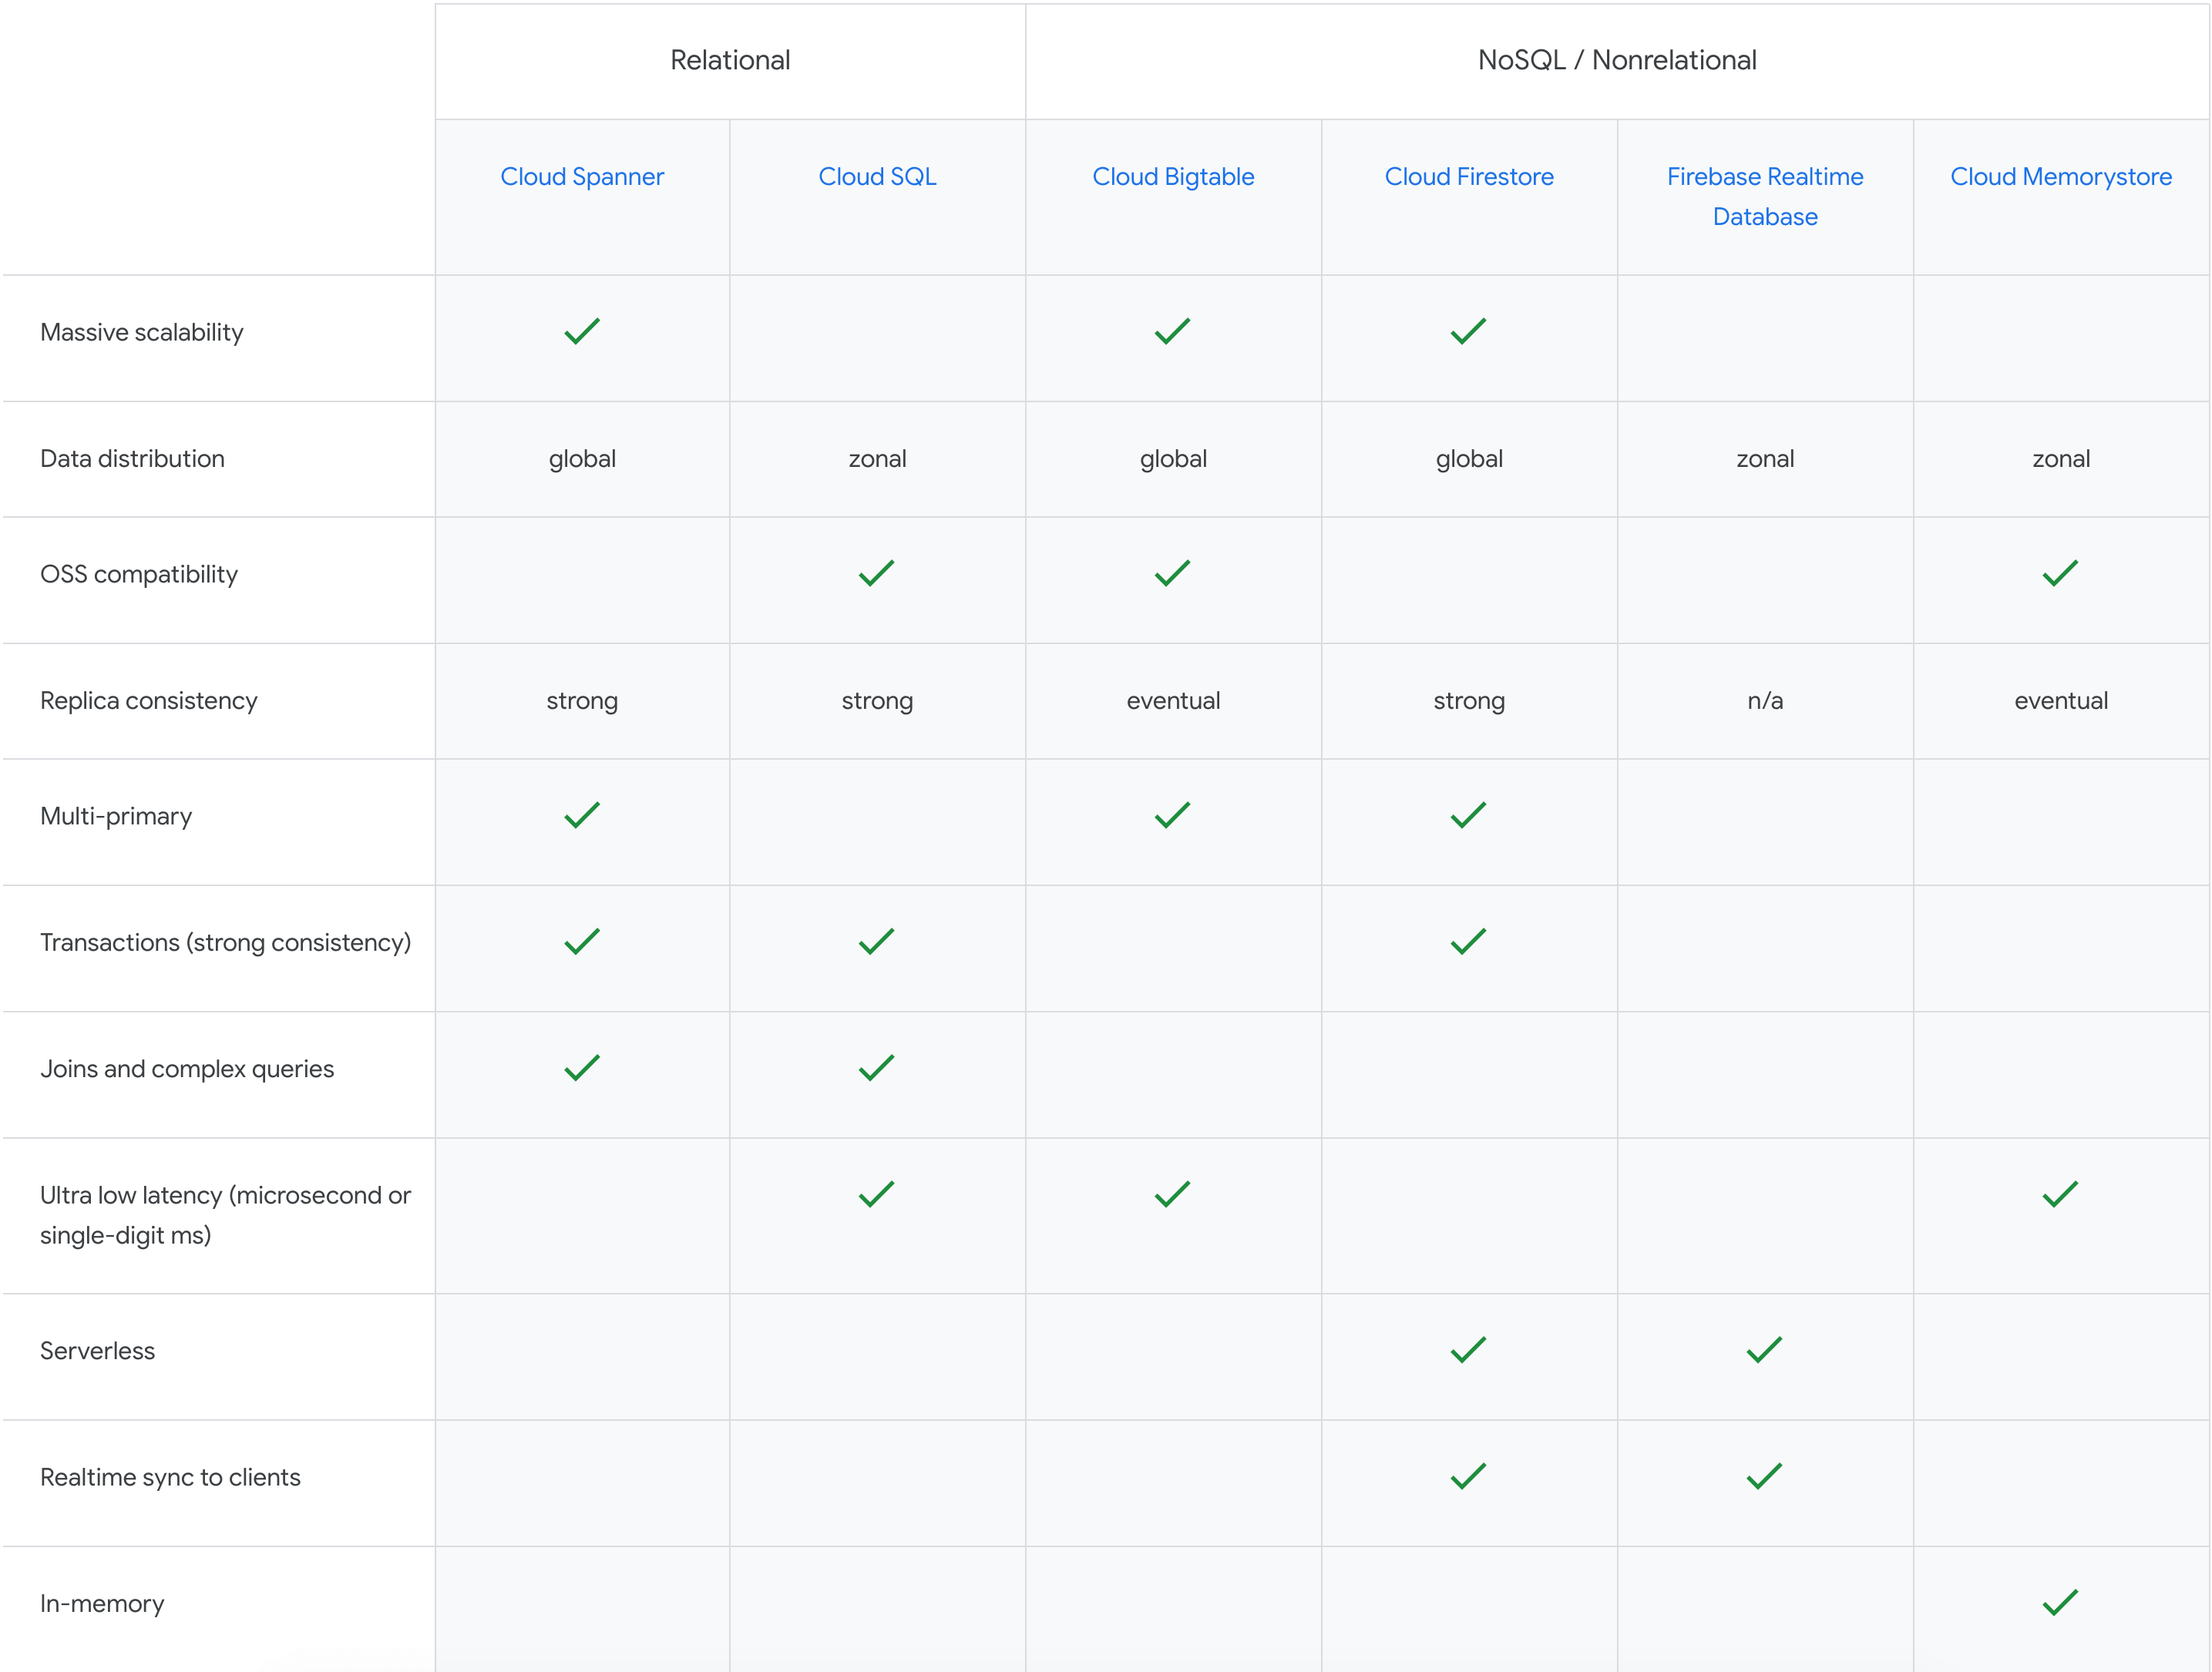
With Google Cloud database services, you can supercharge your applications, accelerate adoption with broad open-source database compatibility, and do more with your data through integrations with analytics and ML/AI.
Held Back by Database Scalability, This Financial Services Company Switches to Google Cloud and Cloud Spanner

11606
Of your peers have already read this article.
4:30 Minutes
The most insightful time you'll spend today!
Azimut Group operates an international network of companies handling investment and asset management, mutual funds, hedge funds, and insurance. Founded in Milan, Italy in 1988, Azimut Group today has branches in fifteen countries, including Brazil, China, and the USA.
“We have subsidiaries and manage funds all over the world,” explains Simone Bertolotti, IT Manager at Azimut Holding S.p.a. “That means that any technology that we put in place has to cover needs from many different countries.”
“When complicated analysis has to be executed, we have to increase our table space in a couple of minutes so that the AI can drill down into the data and deliver the information we need.”
—Simone Bertolotti, IT Manager, Azimut Holding S.p.a.
Azimut manages its funds with investment advisors who use information sourced from Bloomberg, Reuters and others. “They use a huge amount of data,” says Simone. “They work with spreadsheets, algorithms, formulae and they analyse data in minutes.” In finance, every second is crucial, which is why Azimut decided to develop a risk management dashboard that can process information even more quickly, then distribute it worldwide.
“When an advisor manages data, that data is used to make immediate decisions on funds, capital movements or whether to sell stock,” says Simone. “They have to be ready to make recommendations for any amount of data that comes to them. For our dashboard, that means that when additional information arrives or complicated analysis has to be executed, we have to increase our table space in a couple of minutes so that the AI can drill down into the data and deliver the information we need.”
Generating insights at speed
Investors and investment managers make decisions based on the most accurate, up-to-date information possible. For Azimut Group, information sourced through financial data vendors such as Bloomberg and Reuters provided only part of the data that the group required.
“We looked to collect information from a range of different providers,” explains Simone, “then analyse it to develop a predictive algorithm that could work faster than an advisor stationed at the terminal. We set ourselves the challenge to try to manipulate that data to add new insights into our matrix, so that every one of our branches across the world can see risk information about the funds in real-time.”
“We compared Google Cloud Platform’s performance with our previous cloud provider, and saw huge benefits of switching to Google. For me, the key performance issue is scaling. With Google Cloud Platform I know that I can increase and decrease my infrastructure quickly, when I need it.
—Simone Bertolotti, IT Manager, Azimut Holding S.p.a.
The first cloud provider Azimut used to build its system struggled to scale quickly to meet different kinds of data challenges. “If we wanted to add more cores, that was fine,” says Simone. “But the previous cloud provider made it complicated to raise the amount of space in a database infrastructure and scale up to demand. Scaling up for more in-depth analysis would take a day, and our need was immediate.”
That’s why Azimut switched one year ago to Google Cloud Platform to run the 150 VMs on its risk analysis platform. “We compared Google Cloud Platform’s performance with our previous cloud provider, and saw huge benefits of switching to Google. For me, the key performance issue is scaling,” says Simone. “With Google Cloud Platform I know that I can increase and decrease my infrastructure quickly, when I need it. Instead of waiting a day to scale up infrastructure, we can request and add space to our database in a couple of minutes.”
The infrastructure of Azimut’s solution handles around 800TB of data per month, and Google’s global network of servers and high-speed connections ensure that it gets to where it’s most needed by the most direct route. Impressed by the speed, security and availability of Google Cloud Platform, Azimut has moved its intranet on to Google Cloud Platform, too, eliminating the need for staff to login with VPNs.
“Instead of waiting a day to scale up infrastructure, we can request and add space to our database in a couple of minutes.”
—Simone Bertolotti, IT Manager, Azimut Holding S.p.a.
Driving ahead with Noovle
For Azimut, migrating the risk management dashboard is the latest of many Google product collaborations with cloud consultancy Noovle. “Everything started five years ago,” says Simone, “when Noovle assisted us in migrating to Gmail from our on-premise email solution. From G Suite to Google Cloud Platform, we’ve had a great relationship. Noovle provides consultancy services, support for mobility, and external advisors who work on our premises, such as when they trained us how to broadcast our meetings on Google Hangouts. As an independent company, we know we can trust them for transparent advice. All they care about is the best way to get a job done and to help us reach our goals.”
New app, new customers
In a business case comparison, Google Cloud Platform cost Azimut 35% less to run than the previous cloud provider. Now the group is building a major new mobile application on Google App Engine to be released in 2018.
“The new mobile application will allow customers to trade directly, without human advisors, by proposing different investment solutions depending on targets the customers set,” says Simone. “So if a customer aims to make money with investments, they enter their relevant personal information and we carry out the necessary regulatory checks and suggest what they could buy. The entire project will be based on Google Cloud Platform, so customers can control their investments through the app while we manage the fund, using Google Cloud Spanner on the backend.”
Incorporating Custom Holidays into Your Time-Series Models with BigQuery ML

1128
Of your peers have already read this article.
4:30 Minutes
The most insightful time you'll spend today!
About three years ago, JCB, one of the biggest Japanese payment companies, launched a project to develop new high-value services with agility. We set up a policy of starting small from scratch without using the existing system, which we call the concept of “Dejima”, where we focused on improving various aspects such as team structure, risk management, and application and platform development process.
Until now, large Japanese enterprises have built decision-making systems focused on eliminating unnecessary business processes and efficiently increasing quarterly profits. As a result, we are seeing more organizational structures that make it difficult to take on new challenges or experiments with trial and error. We wanted to breathe a new life into this situation, and that is how the concept of Dejima came up. In the Edo period, Japan closed its national border to other countries under its national isolation policy. At the time, Dejima was the only area where special rules were applied and allowed people from different cultures to come and go, and trade. This special rule generated the culture of inclusion and led to Dejima’s prosperity. Like Dejima, we believe that creating an organization that is independent from other business practices can be effective in enabling digital transformation for the organization.
We have been able to make this transformation with the direct help of the Google Cloud and its products such as Google Kubernetes Engine (GKE), Cloud Spanner and Anthos Service Mesh, applying domain-driven design and microservice architecture. We named this the “JCB Digital Enablement Platform (JDEP),” which now hosts multiple business critical production services.
A key benefit of GKE is that the team can easily add resources and release them when they are finished, allowing them to be flexible to accommodate busy periods and off-seasons. Meanwhile, Anthos Service Mesh helps us manage complex environments easily. With containerization and managed services, we are prepared for the future for when more services go into production, as it would be easy to maintain and provide version upgrade support. At the same time, Cloud Spanner ensures that we maintain a 99.99% availability at all times.
Our initial motivation for introducing SRE practices was to break proverbial walls between business, development and operations, which was a success. Now we are focused on ensuring its reliability and maintaining customer satisfaction with our SRE practices.
To ensure the success of SRE practices that we implemented, there were a few categories we needed to address, from defining the organizational culture and practices to ensuring the policies attached to the new models created were practical enough to be implemented on the ground level. This is so that the Dejima concept remains sustainable for the long run.
Instilling a culture of measurement
Here, “appropriate” reliability is the key. According to the conventional way of thinking at JCB, “service failure must not occur” and “SLA should be maintained as high as possible.” We started by discussing what was the “appropriate reliability” that our customers really needed, but it was not as easy as we thought because the level of reliability for user satisfaction differed from application to application.
Eventually, the business, development and operations teams formulated specific SLIs and SLOs together, something we would never have been able to do if we discussed separately. This is because the business is required to compromise on lower service levels, since our reliability standard used to be too high. The collaboration of development and operations teams is necessary to understand how our system works upon our users’ interactions.
After Google Cloud helped us run a series of workshops where all teams participated, we saw change within the organization. The business team started evangelizing SRE to other members in the business department, and the development and operations teams started collaborating autonomously. We felt like we were working at Google speed, accomplishing so much in a short amount of time.
Understanding SRE as an entire company is necessary to progress. We are now working on creating internal training materials to spread the SRE concept throughout the company.
Eliminating ambiguity
With the cooperation of Google Cloud, we have created a Team Charter that defines the team’s mission, values and engagement models. We also created policy documents that include Incident Response Policy, Postmortem Policy, On-call Policy, Toil Policy and Error Budget Policy, to eliminate ambiguity in day-to-day operations.
For example, when an incident occurs, we can identify exactly the level of importance, the roles that are assigned to each person, and in what order they need to follow. When to do a postmortem, who owns it? What to do if the error budget is exhausted? How do other teams reach out to SRE when they have problems? The written policy documents will dramatically improve efficiency and motivate teams to adopt a culture of learning from failures.
The format for such policies are written in Google’s SRE book, but when we adopt it, it needs to take into account the circumstances specific to our company. Simply copying an existing policy won’t work, which is why it’s important to formulate a policy that fits the situation each team is in.
Reformalizing teams
Based on these policies, JCB’s SRE team has two sub-teams. One is called Sheriff which works as the platform SRE, and provides infrastructure services for the application team. The other is called the Diplomat which works as the embedded SRE, and participates in the application team to lead productionisation. There is also a team called Architecture that is separate from the SRE teams whose role is to consult SRE on system design and review architecture.
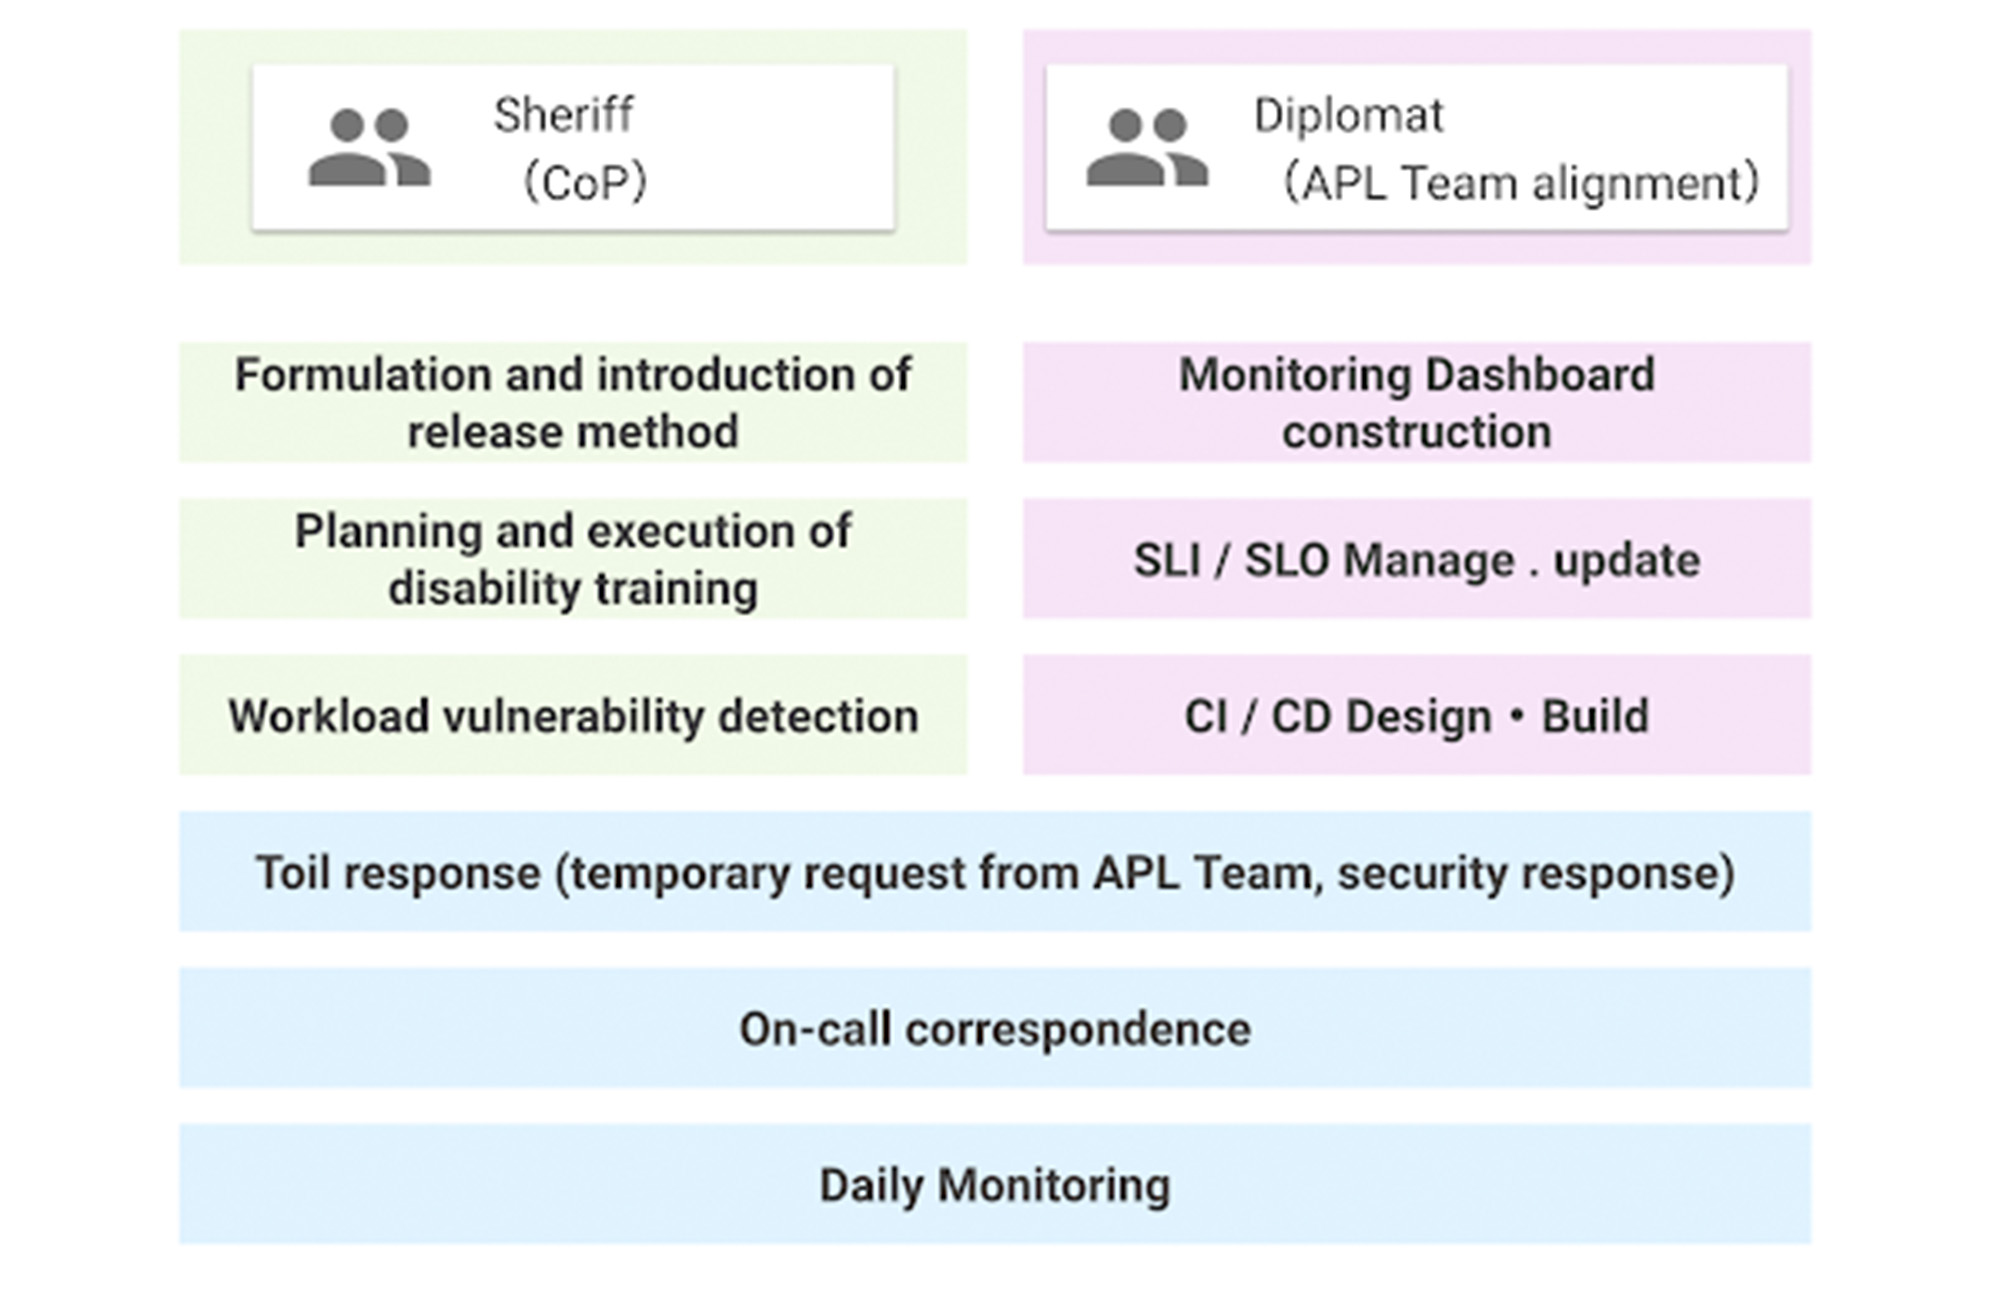
The SRE team was a single role when it was first launched, but now has two sub-teams. This is because as the number of application teams increases, the number of support tasks for the teams also increases, which can result in a shortage of resources to work on overall improvement. Securing people who are not interrupted from day-to-day support tasks and focusing on the main task improves efficiency.
Whereas both sub-teams share the on-call duty, some engineers are not allowed to do it by contract as they are not allowed to get paged. For those who cannot participate in on-call duties, we created what’s called a Toil Shift, which allows them to focus on resolving tickets in our backlogs instead.
This works well so far, but we will keep evolving as our business grows.
More Relevant Stories for Your Company

Google Cloud Migration Speeds Up The New York Times’ Journey to New Normal
Like virtually every business across the globe, The New York Times had to quickly adapt to the challenges of the coronavirus pandemic last year. Fortunately, our data system with Google Cloud positioned us to perform quickly and efficiently in the new normal. How we use data We have an end-to-end type of

Google and AI Researchers Work towards Building Data-centric AI
AI researchers and engineers need better data to enable better AI solutions. The quality of an AI solution is determined by both the learning algorithm (such as a deep-neural network model) and the datasets used to train and evaluate that algorithm. Historically, AI research has focused much more on algorithms

Datashare for Financial Services: Securing the Publishers and Consumers’ Access to Market Data
Access to the cloud has advanced the distribution and consumption of financial information on a global scale. In parallel, the global financial data landscape has been transformed by an influx of alternative data sources, including social media, meteorological data, satellite imagery, and other data. Exchanges and market data providers now

Query Insights for Spanner: A blessing for developers and DBAs
Today, application development teams are more agile and are shipping features faster than ever before. In addition to these rapid development cycles and the rise of microservices architectures, the end-to-end ownership of feature development (and performance monitoring) has moved to a shared responsibility model between advanced database administrators and full-stack
