





ActivStat: Enhancing Live Sports Broadcast with Real-time Stats and Metrics

5097
Of your peers have already read this article.
2:00 Minutes
The most insightful time you'll spend today!
Millions of people annually view esports, as top players and teams compete in thrilling, fast-paced tests of reflexes, strategy, and teamwork. Fans are a diverse group, sharing a passion for action. A new, revolutionary project we’re working on with Call of Duty League just made that action a lot better.
ActivStat brings fans, players, and commentators the power of competitive statistics in real-time—stats that matter not only to the game at hand, but also for a full roster of competitors globally. Using ActivStat, live broadcasts will soon be enhanced with more depth and color-of-play while they’re happening, building excitement and adding to the overall experience.
Technically, ActivStat is an entirely new capability for esports. It’s a constantly updating catalog of statistics that is sourced, analyzed, updated, and delivered in an easy-to-consume way across global-scale computing systems, with a latency of milliseconds or seconds, rather than minutes or hours. By comparison, many of these stats today are available to fans after a day or more of processing.
Call of Duty League plans to begin rolling out ActivStat during the 2021 season. The initial rollout will include critical information like player and team standings and winning ratios across multiple aspects of virtual combat—including ultimately what these numbers mean for rankings. ActivStats are delivered both in raw statistics and via visualizations and graphics, providing commentators with fast access to the types of insights fans crave.
For engineers at both companies, building the service has been an epic success all its own. Due to a sponsorship with Call of Duty signed last February, our dedicated game engineering team quickly innovated a new solution incorporating high-speed networking, data pipelines from multiple cloud sources, and data warehousing to create a user-friendly dashboard. Real data was flowing into commentator dashboards by April.
Esports are more complex to cover in many ways than regular sports. Instead of a well-defined physical playing field (often a simple rectangular space), multiplayer games involve complex and sprawling virtual environments that can be the size of a large campus or airport with multiple levels and hidden locations.
Gameplay between competitors happens across many of these locations simultaneously. In addition, competitors also each choose their own configurations of equipment, known as “loadouts,” which can dramatically affect gameplay and strategy. All of this additional complexity in online gaming involves data that needs to be captured, analyzed, and communicated to the fans in insightful ways.
Two Google Cloud technology capabilities play central roles in the operations of ActivStat. BigQuery—a planet-scale data warehouse that can store and query petabytes of information in real time—is the foundation of the ActivStat platform for gathering and summarizing millisecond-level statistics. Looker, an intuitive analytic dashboard, surfaces those insights to commentators in an easy-to-use, real-time dashboard that enables the commentators to speak to compelling insights and statistics in sync with the gameplay as it is happening in the live broadcast.
While the initial release of ActivStat for this season of Call of Duty League provides compelling and powerful capabilities, it’s only the beginning of this Call of Duty League-Google Cloud co-innovation partnership. Our future vision is mapping gameplay hotspots on the field, and predicting where to place cameras with machine learning as the match evolves–enabling broadcast producers to build excitement for fans by always being in the middle of the best action. Call of Duty League and Google will also look to drive statistics and metrics directly into the broadcast feed.
The implications of the real-time statistical capabilities of ActivStat go beyond gaming and esports. Historically, gaming has been at the leading edge of what computer processing, computer graphics, wide-area networking, data analysis, and insight can do. The real-time data ingestion and output used in ActivStat could one day be useful powering live broadcasts in other types of sporting events, as well as blending live video feeds and data to support use cases in media & entertainment, healthcare, finance, manufacturing, and other verticals. We’re excited about the potential for this bold new solution and partnership between Call of Duty League and Google in esports and beyond.
To learn more about Call of Duty League-Google Cloud partnership, visit our press release.
3466
Of your peers have already watched this video.
20:00 Minutes
The most insightful time you'll spend today!
Managing Change in an SAP World
Change is a constant for SAP customers. Now more than ever, SAP customers need solutions that provide them business agility, rock solid availability, enhanced security, and true economic value.
Learn how Google Cloud can guide your SAP journey to the cloud with simple and no cost migrations, powerful infrastructure, and innovation technologies that you can take advantage of today. Hear examples of SAP customers who have deployed on Google Cloud and the game changing results they are realizing.
Italian Utility Company Deploys its SAP Workloads on Google Cloud to Meet Sustainability Goals

3265
Of your peers have already read this article.
2:00 Minutes
The most insightful time you'll spend today!
With more than 2.5 million customers, Italian utility company A2A is committed to delivering electricity, gas, clean water, and waste collection every day. More recently, the company made another significant commitment: To incorporate the principles of the “circular economy” into its way of doing business — part of the UN 2030 Agenda’s Sustainable-Development Goals — all while also aiming to double its client base by 2030. Growing rapidly but sustainably requires operating as efficiently as possible at every level of the organization, from operating smart meters to generating accurate demand projections. That’s why A2A chose to deploy its SAP S/4HANA ERP and the SAP BW/4HANA data warehouse on Google Cloud.
Roadblocks to innovation
Instead of a linear consumption model that starts with raw materials and ends with use and disposal, the circular economy is a continuous cycle that emphasizes repair, recycling, and the creation of materials rather than their disposal. To take an example from A2A’s own success story: The company keeps 99.7 percent of collected waste out of landfills.1 Of the UN’s sustainability goals, A2A is committing to the three most relevant to its industries:
- Ensuring availability and sustainable management of water and sanitation for all
- Ensuring sustainable consumption and production patterns
- Protecting, restoring, and promoting sustainable use of terrestrial ecosystems
Achieving A2A’s sustainability and customer-first strategies requires high scalability, rapid data ingestion, and rich, accurate analytics. None of this could be reliably supported with the company’s legacy on-premises SAP and Data Warehouse, especially given A2A’s projected growth and the increasing complexity of the data landscape, including IoT deployments and energy market liberalization.
Provisioning data infrastructure was also slow and complex. Simply adding a new metric could require increasing capacity by an order of magnitude. And analytical and transactional data lived in siloes, which created a fragmented and out-of-date view of each customer across sales and customer support teams. A2A’s fragmented data also made it difficult to take proactive action when changing priorities or processes required shifting focus from one data source to another.
With a data warehouse that refreshed only once every 24 hours, simple processes such as responding to a customer calling because their power has been cut off due to an unpaid bill became cumbersome.
Scalability was also a concern. With the on-premises solution, A2A needed to define the budget for its data warehouse over a two-year timeframe, but the rollout of new electricity meters — each sending data every 10 minutes — across Italy made those data requirements hard to predict.
The move to the cloud: From monolith to microservices
The move has been a giant step forward in A2A’s goal of meeting its data-driven, customer-centric strategy. In deploying its SAP systems to Google Cloud, A2A can take advantage of a highly flexible hybrid environment and powerful data management and analytics. It can replicate data from Salesforce, SAP, and other systems in BigQuery, which operates as a data lake with Google Cloud SQL, connected directly to Google Analytics and Google Ads for data-driven customer service, decision-making, and marketing.
“From BigQuery we can feed relevant information directly to the people who need it. Our customer operators work on Salesforce, so we use an OData protocol to embed real-time data in that platform. Elsewhere, we present the information through a dashboard, or with a BI component delivering one-page reports.” —Vito Martino, Head of CRM, Marketing and Sales B2C & B2B, A2A
By running SAP on Google Cloud, A2A can also count on an infrastructure platform that provides:
- Scalability. The robust data architecture on Google Cloud adapts to shifting and increasing demands without compromising on speed or availability, so A2A doesn’t have to worry about over- or under-provisioning as the rollout of smart meters proceeds.
- Speed. The new A2A data solution refreshes every five minutes instead of 24 hours, so the company can respond to its customers’ needs without delays. Customer operators working in Salesforce now receive real-time data from Google BigQuery so that, when a customer calls, operators can see accurate information in seconds. They can now offer value-added services and sustainable options tailored to the customer’s needs, from energy consumption to their preferred method of communication.
- Availability. With microservices orchestrated by Google Kubernetes Engine, the team can update the solution through continuous integration and delivery (CI/CD), eliminating the need for downtime when changes are required.
- Security and control. The A2A IT team uses Google Kubernetes Engine to orchestrate clusters of instances on Google Compute Engine, with Google Cloud Load Balancing and backups on Google Cloud Persistent Disk. Google Cloud Anthos ensures operational consistency across on-premises and cloud platforms.
Ready to grow the sustainable way
By moving to Google Cloud — the industry’s cleanest cloud, with zero net emissions — A2A is ready to grow quickly while locking down the efficiency it will need to meet its ambitious sustainability goals. “To bring sustainable utilities to market, we need to be both responsive to our customers and responsive to the internal needs of A2A,” explains Davide Rizzo, Head of IT Governance and Strategy at A2A. “Understanding what customers need in detail means we can improve their services and reduce their environmental impact at the same time.”
Learn more about the ways Google Cloud can transform your organization’s SAP solutions with scalability, speed, and advanced analytics capabilities.
1. Circular Economy: one of the four founding pillars of A2A’s 2030 sustainability policy | Drupal
New Histogram Features in Cloud Logging Make it Easier to Track Log Volumes, Errors and Anomalies!
3400
Of your peers have already read this article.
2:30 Minutes
The most insightful time you'll spend today!
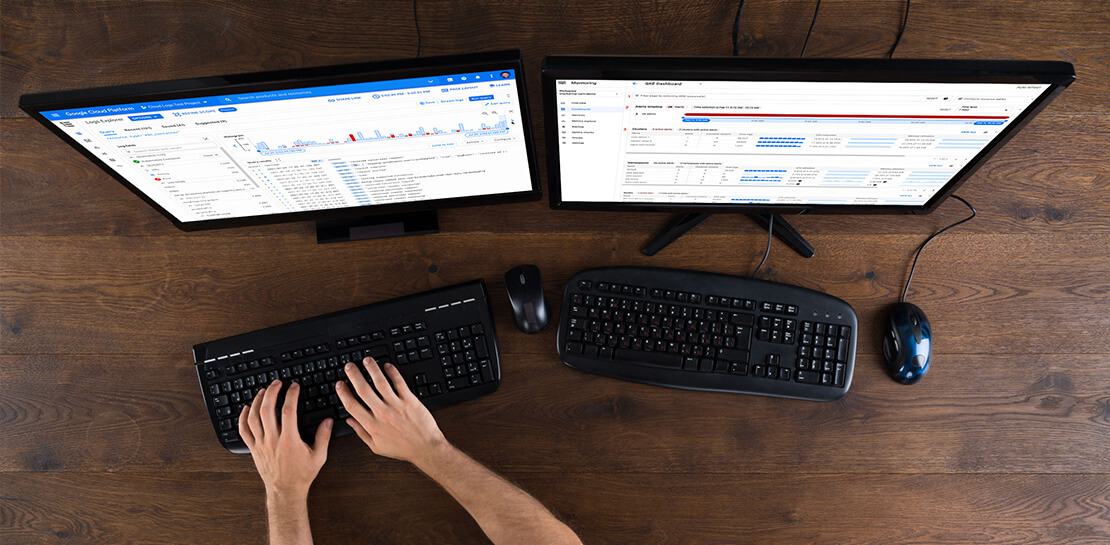
Visualizing trends in your logs is critical when troubleshooting an issue with your application. Using the histogram in Logs Explorer, you can quickly visualize log volumes over time to help spot anomalies, detect when errors started and see a breakdown of log volumes. But static visualizations are not as helpful as having more options for customization during your investigations.
That’s why we’re excited to announce that we recently added three new query controls along with separate colors for log severity to the histogram. These new features make it even easier to refine and analyze your logs by time range. The new histogram controls help find logs before or after the current period, jump to a specific time range represented in a histogram bar and zoom in/out of the current time window in the histogram.
Histogram colors
The histogram now makes it easier to view the breakdown of logs by severity with the introduction of color coding. For example, the severity colors make it easy to spot an increasing number of errors even when the volume of requests is relatively constant. Looking at the histogram below, the red vs blue shading makes it clear that there has been an increase in overall log volume and provides a visual breakdown of errors within that log volume.

Pan left/right to scroll through time
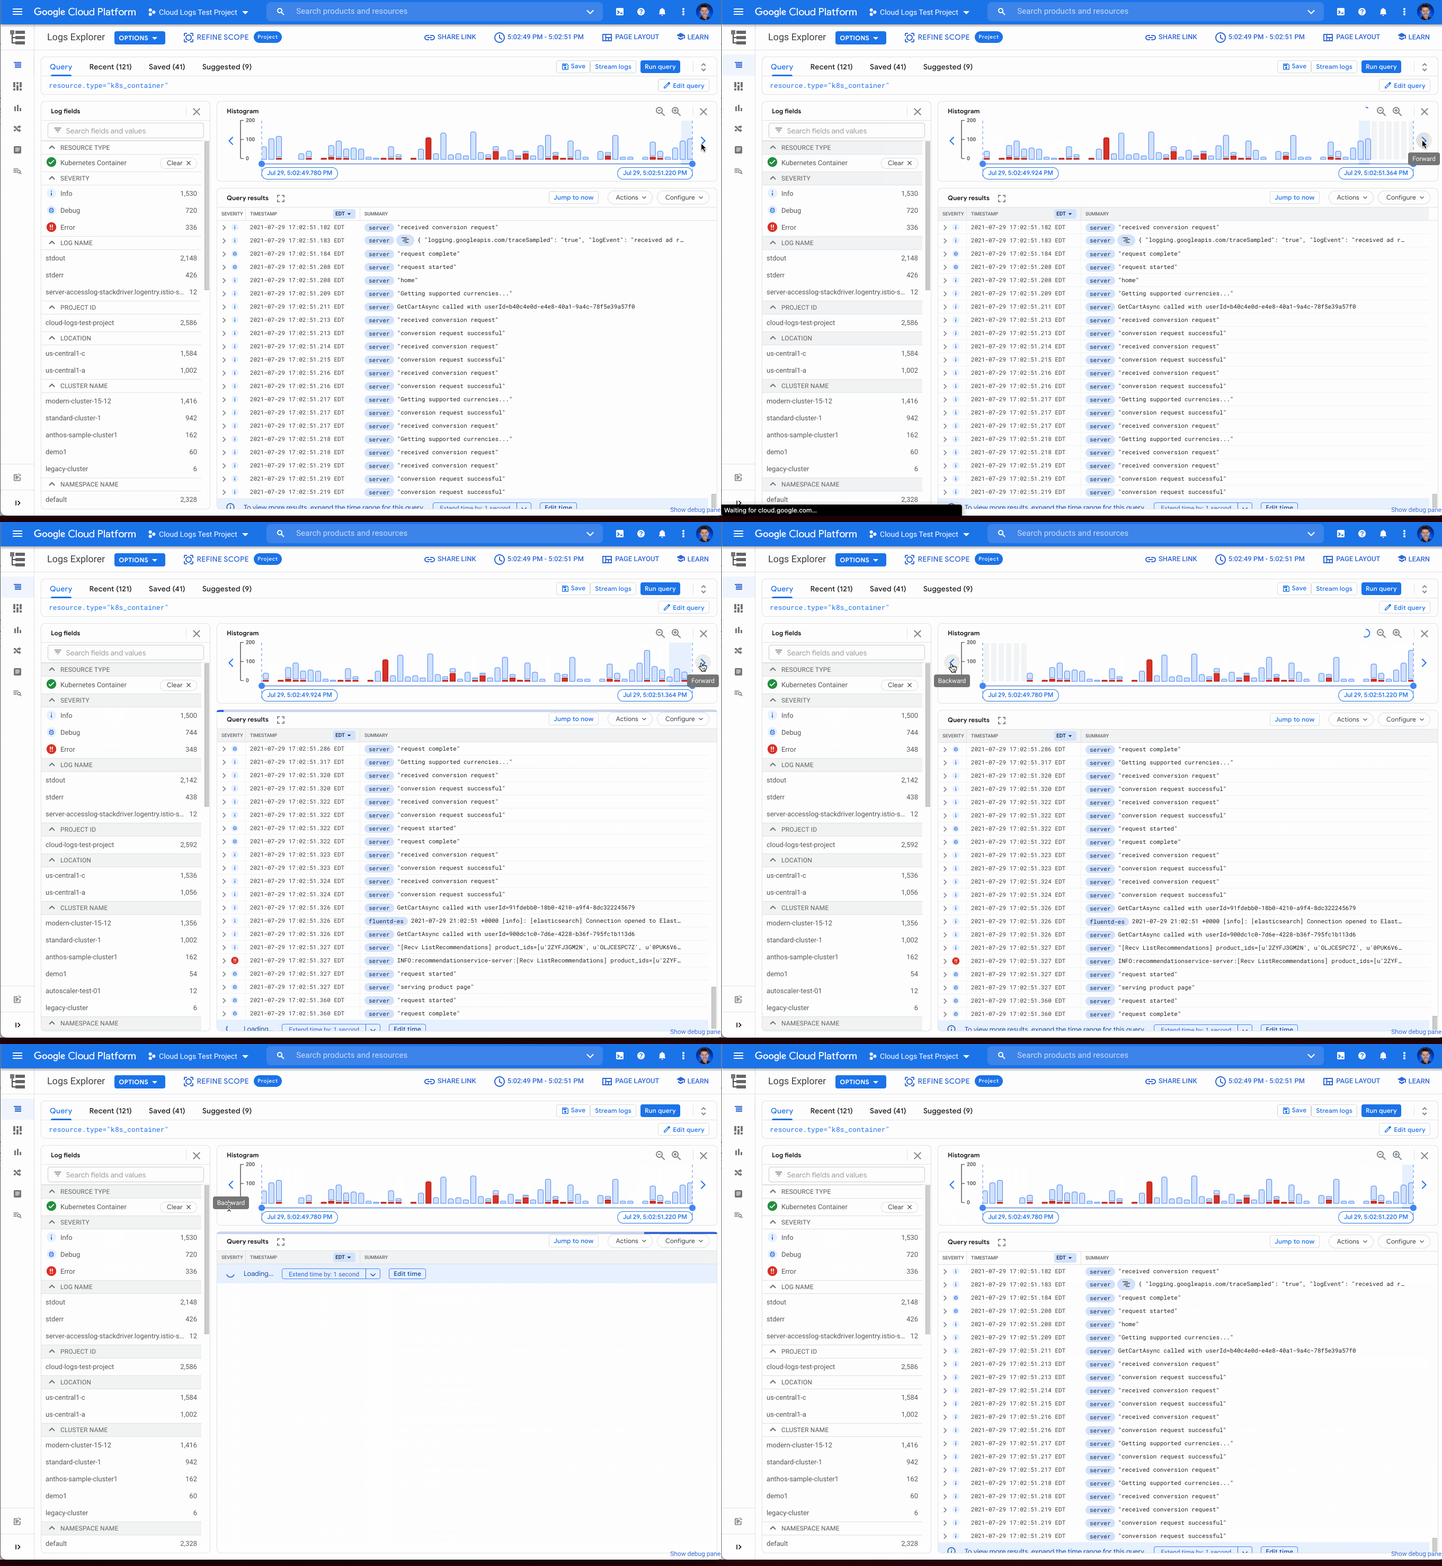
Sometimes in your troubleshooting journey, you may want to look at the logs directly before or after the current set of logs. Perhaps there was an unexpected spike in errors at the beginning of the time range and you need to see the logs in the time period directly preceding the current time range. Pressing the left arrow on the left side of the histogram shifts the time range earlier while the arrow on the right side of the histogram shifts the time range ahead. Either arrow will refine the time range in the query and rerun the query to return the logs in the new time range.
Zooming in or out
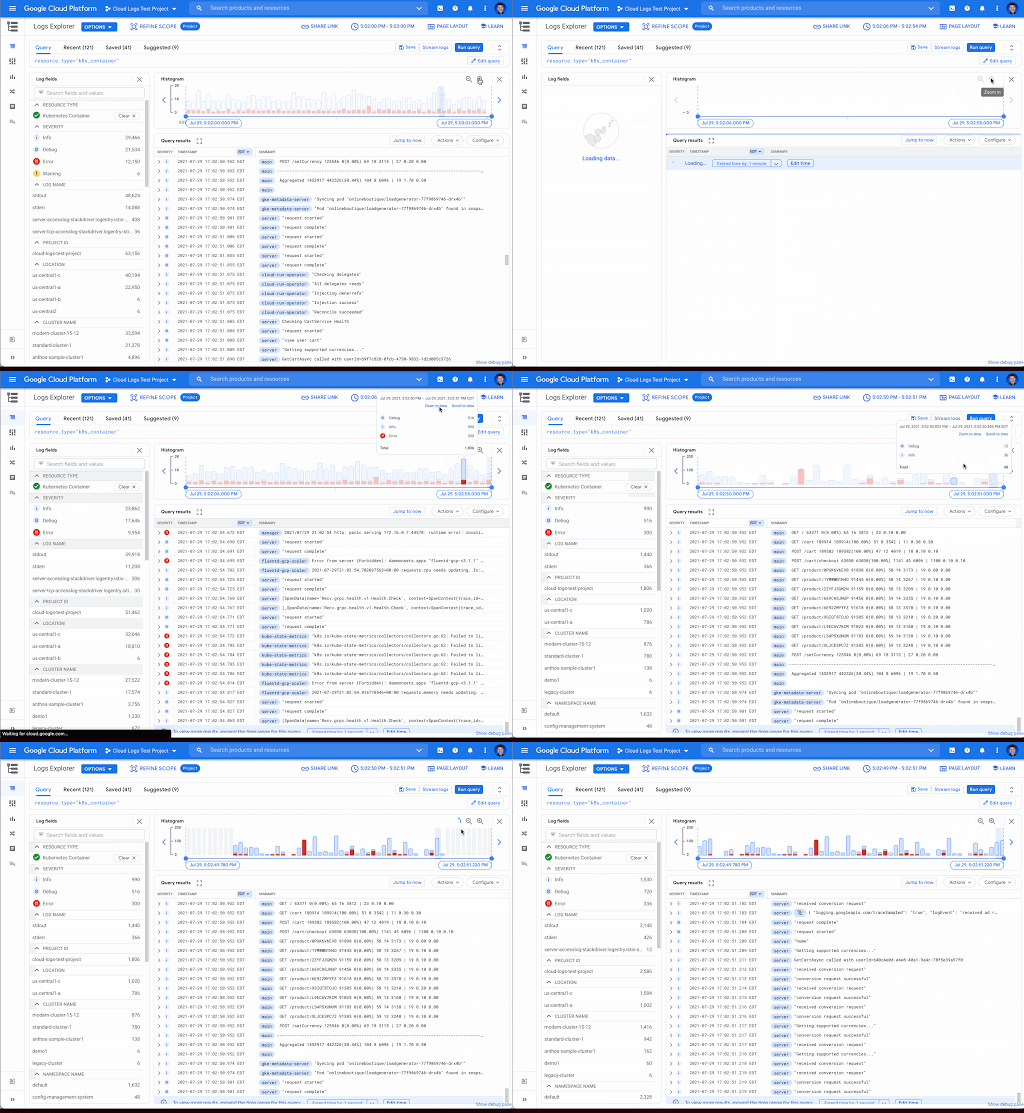
Zooming in or out from a given time range may be useful to visualize fine-grained details or a broader trend Clicking the zoom in or out icons in the upper right corner of the histogram refines the time range in the query and then reruns the query, returning the logs in the newly defined time range.
Scrolling to time
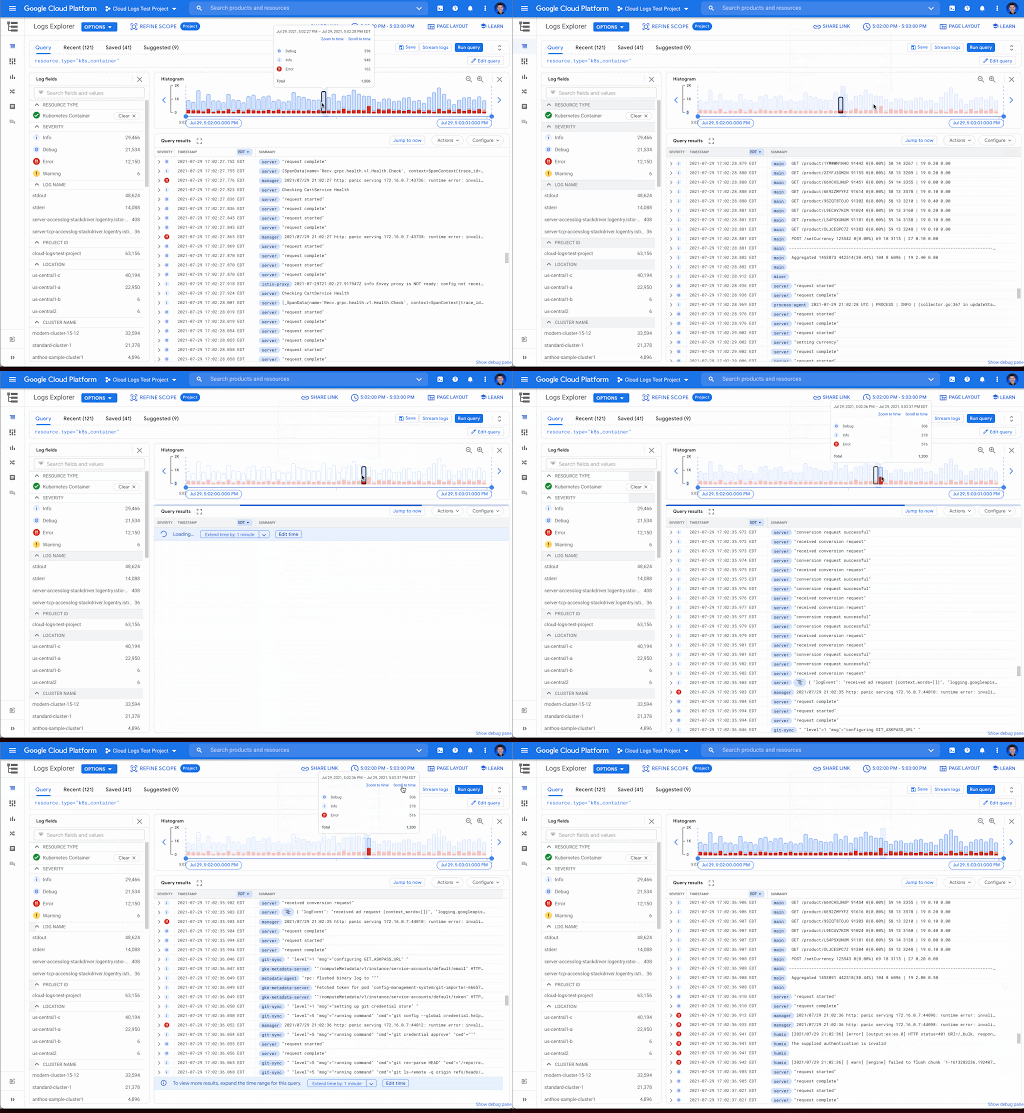
If you see a large spike in logs volume in the histogram, it’s useful to quickly review the logs generated during that spike. Clicking on the histogram bar that contains the spike now scrolls you to the logs generated during that time period.
Where to find the histogram
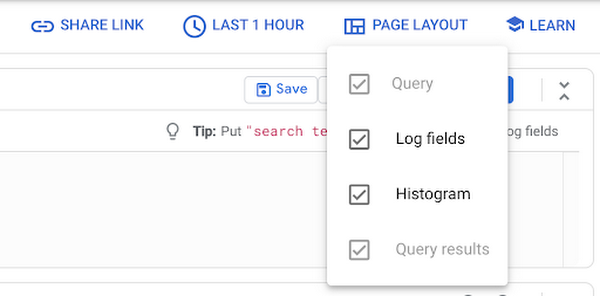
The histogram is a panel in Logs Explorer that can be displayed or hidden using the controls in the Page Layout menu. When you no longer want to display the histogram, click the “X” button in the upper right corner to quickly close it. To open it again, use the same Page Layout menu to enable the histogram display.
Get started with the histogram
These improvements move the histogram from a utility for visualization to an integral part of the troubleshooting journey. We are continuously working to launch new features that make Cloud Logging the best place to troubleshoot your Google Cloud logs. If you are not already a Cloud Logging user, review this getting started documentation or watch a quick video on troubleshooting services on Google Kubernetes Engine (GKE) to learn more. If you have specific questions or feedback, please join the discussion on our Google Cloud Community, Cloud Operations page.
3607
Of your peers have already watched this video.
10:42 Minutes
The most insightful time you'll spend today!
The Inside Story of How PayPal Became an Innovator in a Competitive Market
PayPal is an American company operating a worldwide online payment system that supports online money transfers and serves as an electronic alternative to traditional paper methods like checks and money orders. The company enables over 29 million payments or transactions on a peak day. in over 200 markets around the world.
PayPal wanted to scale its business. It had achieved a 25% payment growth across the world. It wanted to ensure it’s available wherever its customers are and enable seamless transactions. PayPal also wanted to ensure flexibility. “There are huge variations in the amounts of payment that happen every day of the week or every week of the year. We wanted to ensure our systems are capable of keeping up with these variations,” says Sri Shivananda, SVP and CTO, PayPal.
The company also had to meet regulatory compliance needs across its 200 markets and increase its efficiency. It wanted to get rid of hardware on-premises which it wasn’t using on a regular basis. And above all, the company wanted to innovate quickly to beat the competition.
This is why PayPal turned to Google Cloud. Watch how it made the transition and reaped the benefits.
Titanium: A Robust Foundation for Workload-optimized Cloud Computing

943
Of your peers have already read this article.
3:30 Minutes
The most insightful time you'll spend today!
Google Cloud is built on world-class technical infrastructure that supports services that are loved and relied on by billions of people across the globe: Google Search, YouTube, Gmail, Google Maps and more. A core tenet at Google Cloud is to leverage Google’s experience building and operating highly available and highly reliable planetary-scale compute, storage and networking systems and data centers.
Google takes a workload-optimized approach to building its infrastructure, employing a combination of dedicated hardware and software components to meet its workloads’ ever-growing demands. Underpinning this infrastructure is Titanium, a system of purpose-built, custom silicon and multiple tiers of scale-out offloads that together power improvements in the performance, reliability, and security of our customers’ workloads (for example, 25% faster block storage IOPS/instance compared to the other two leading hyperscalers). Unveiled today at Google Cloud Next, you’ll find Titanium technology in many of Google Cloud’s recent infrastructure offerings.
10x demands of tomorrow
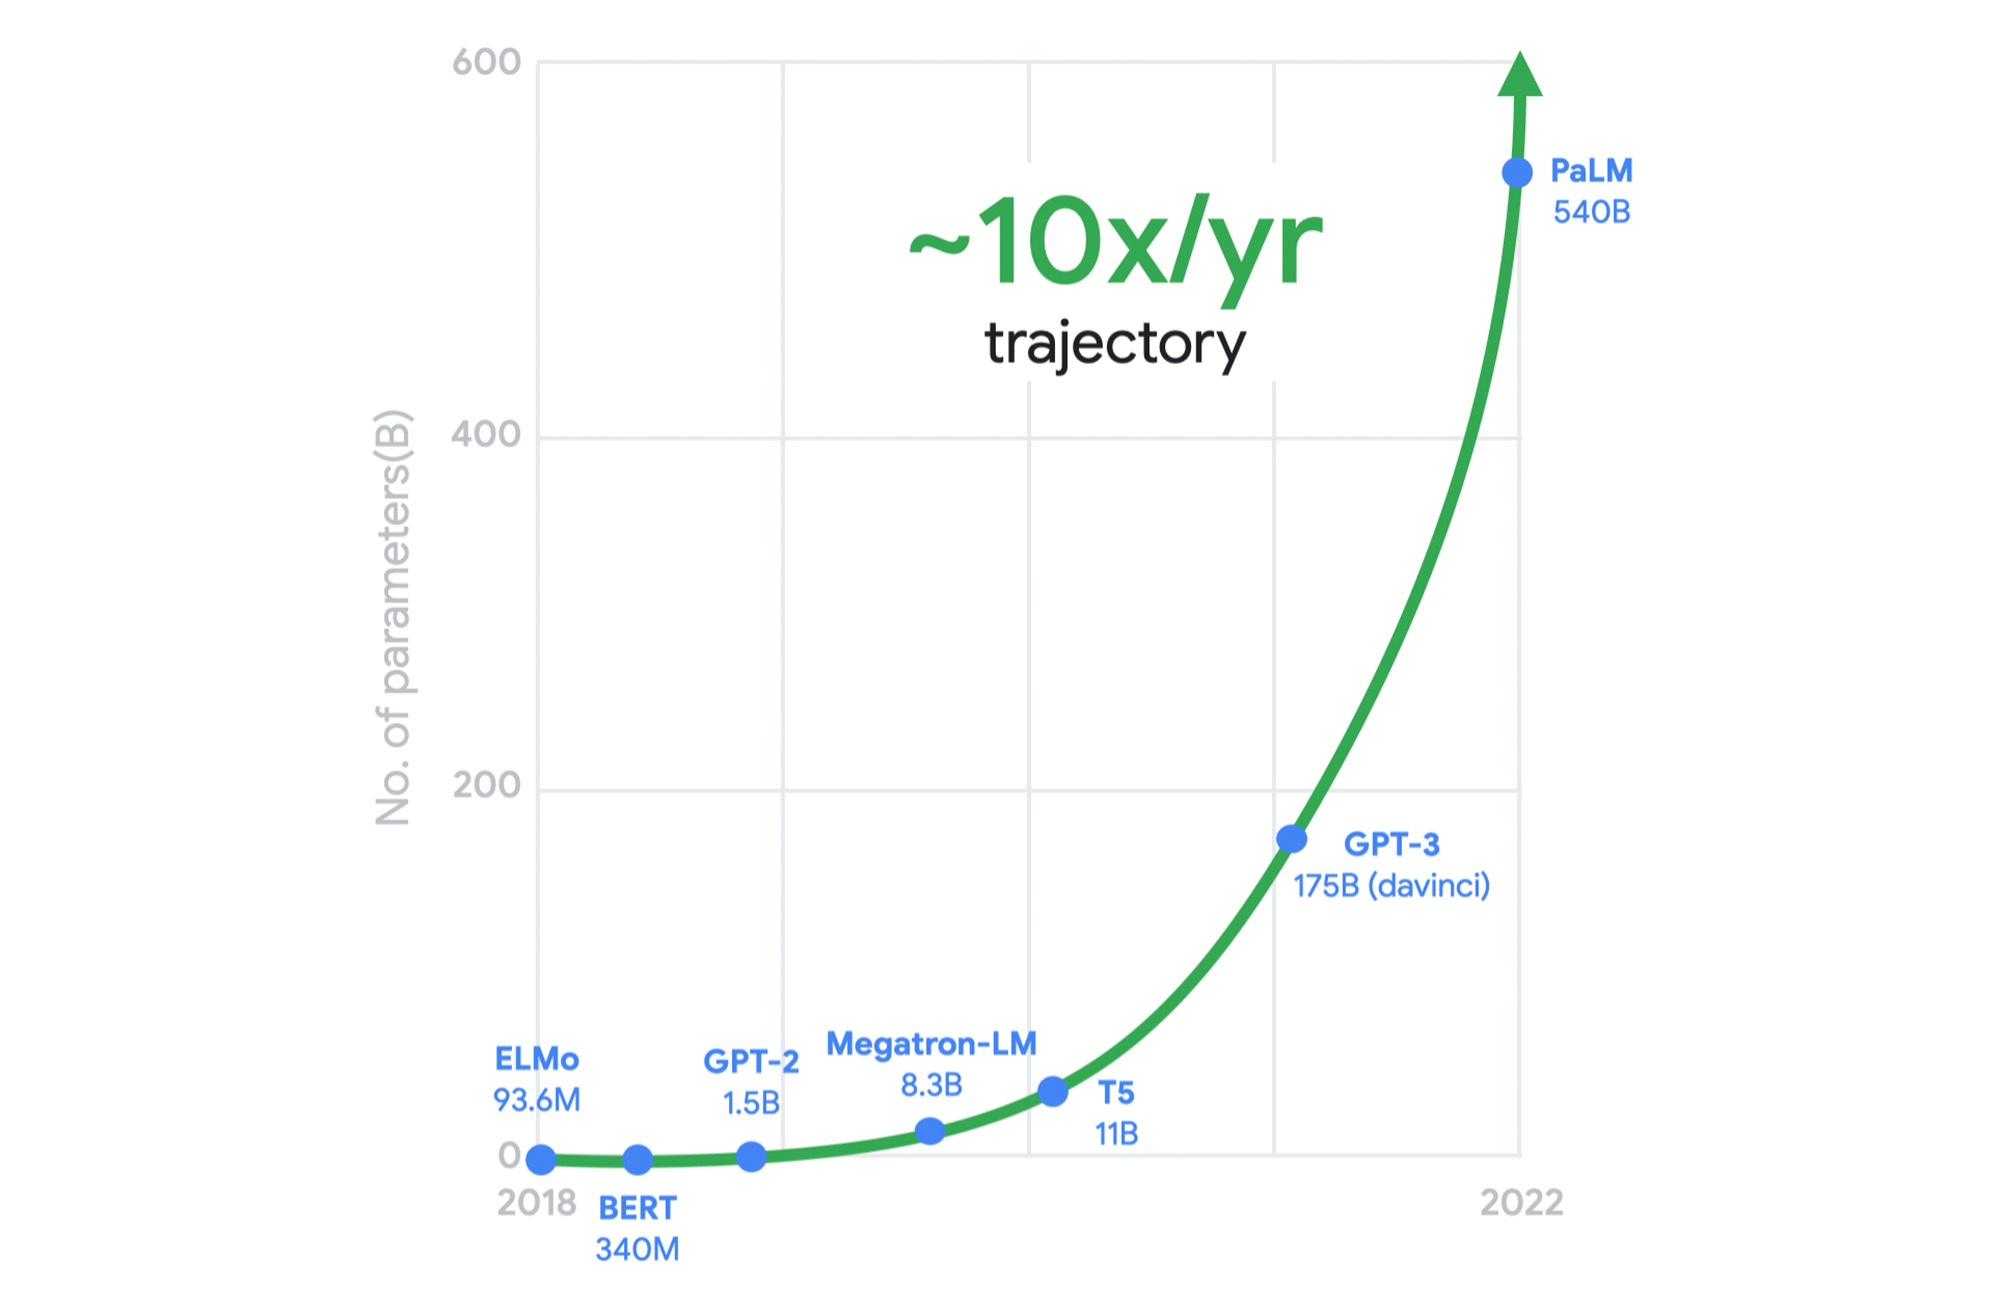
Meeting the growing performance, reliability, and security demands of both legacy and emerging workloads is a constant challenge for cloud infrastructure providers. And now, these demands are multiplying with the heightened adoption of generative AI across almost every industry. Meanwhile, the benefits of Moore’s law have been declining in recent years. We can’t rely on silicon advances alone to meet tomorrow’s needs.
As just one example, this chart shows the exponential computing demands of large language models.
It was clear to us a long time ago that we needed to rethink our infrastructure designs to meet these demands. This is why, for several years, we’ve adopted workload-optimization and intentional design as central principles for our infrastructure platform. We engineer golden paths from silicon to the customer workload, using a combination of purpose-built infrastructure, prescriptive architectures, and an open ecosystem to deliver workload-optimized infrastructure.
Offloads play a pivotal role
Central to this strategy are offload technologies. Traditionally, the CPU wears many hats: It runs the hypervisor, the virtualization stack to enable your workloads, and manages storage and networking I/O; it’s responsible for security isolation for virtual interfaces and physical hardware, etc. In this model, customer workloads running on the CPU contend for resources with these platform tasks.
Offloads on dedicated hardware perform behind-the-scenes security, networking, and storage functions that were previously performed by the host CPU, allowing the CPU to focus on maximizing performance for customer workloads.

A recent example of an on-host offload or accelerator is the Infrastructure Processing Unit (IPU), a system-on-chip that we co-designed with Intel to enable better security isolation and performance on our 3rd gen compute instances. The IPU enables:
- Predictable and efficient compute
- Programmable packet processing for low latency, 200 Gbps networking with 3x the packets per second compared to our previous-generation compute instances
- In-transit encryption with the PSP protocol
Another important example of Google’s on-host hardware is Titan, a secure, low-power microcontroller that helps ensure that every machine in Google Cloud boots from a trusted state.
But we did not stop there. To meet tomorrow’s demands, we knew we needed to go past the performance that could be achieved using the host’s dedicated offload hardware.
A tiered system of offloads
A key component of Titanium is its modern offload architecture, which combines capabilities whose scale and performance are well-established within Google, as well as new capabilities tailored for cloud use cases.
Just as modern workloads scale out horizontally in the cloud, with Titanium, we’ve extended the architecture to augment on-host offloads with an additional tier of scale-out offloads that run outside the host. This system of offloads is deployed fleet-wide and dynamically adjusts to changing workload needs to continually deliver the best performance.

Example 1: Block storage
Titanium scale-out offload enables Hyperdisk block storage to deliver stellar I/O performance. Hyperdisk’s Titanium offload on the host IPU works in tandem with the Titanium scale-out offload tier that distributes I/O across Google’s massive cluster-level filesystem, Colossus.

With traditional offload architectures, higher block storage IOPS requires purchasing larger compute instances. For example, you may need to deploy a data-intensive workload on a compute instance with many more vCPUs than the workload needs just to get sufficient storage performance. This tight coupling results in wasted resources and higher costs for customers. Further, even with large instances, storage performance in the cloud may be inadequate relative to what customers are used to with on-prem storage systems.
With our new block storage, Hyperdisk powered by Titanium, we have decoupled compute-instance size from storage performance. Hyperdisk uses a tier of offloads in our cloud fabric to offload storage I/O from the customer hosts to achieve higher storage performance even with a general-purpose VM.
In fact, today we are announcing that Titanium-powered C3 VMs with Hyperdisk Extreme now support 500K IOPS per compute instance in preview to meet the needs of the most demanding workloads. This is 25% faster IOPS/instance compared to the other two leading hyperscalers, courtesy of the Titanium system.
Example 2: Network routing
Virtual network routing is another example of using a second tier of scale-out offloads (“hoverboards”). With Titanium, Google’s Andromeda virtual networking stack on the IPU offload device sends all packets for which it does not have a route to Hoverboard gateways, which have forwarding information for all virtual networks. Hoverboards are standalone software switches that act as default routers for some flows.

Unlike the traditional gateway model, the control plane dynamically detects flows that exceed a specified usage threshold and programs them to be direct host-to-host flows, bypassing the hoverboards allowing hoverboards to focus on the long tail of less frequent flows. Typically, only a small subset of possible VM pairs in a network communicate with one another, so the VMs only have to store and process a small fraction of the usual network configuration on an individual VM host, improving per-server memory utilization and control-plane CPU scalability.
Titanium already powers your workloads
The Titanium journey began years ago with the component technologies described above. Many of our products already benefit from this architecture, and the newest elements of this architecture are now available with our 3rd gen Compute Engine instances such as C3 and the new Hyperdisk block storage.
Going forward, look for the Titanium architecture to underpin all future generations of our infrastructure offerings, in the process enabling new classes of infrastructure capabilities that move well beyond the confines of a single server.
More Relevant Stories for Your Company

Giving Customers More Choice: Google Cloud’s New Product and Pricing Options
Over the past several years, Google Cloud has made significant investments in our infrastructure product portfolio. We launched new Tau T2D VMs, which deliver 42% better price-performance vs. other leading cloud providers. We upgraded Cloud Storage to offer more flexibility to support customers’ enterprise and analytics workloads, with dual-region buckets

STAC-M3 Tick History Analytics in Google Cloud Benchmark Results Reveals it is 18X Faster than Previous Version
The Securities Technology Analysis Center (STAC®), an organization that improves technology discovery and assessment in the finance industry through dialog and research, recently audited the STAC-M3™ benchmark suite on Google Cloud (SUT ID KDB211210). These enterprise tick-analytics benchmarks assess the ability of a solution stack such as database software, servers,
Qlik and Google Cloud Combo: Extending Integration of SAP Data on BigQuery
If your organization is one of the 52% of SAP customers whose top analytics pain point is data integration1, Google Cloud has got you covered. By working with partners like Qlik, we are expanding our integration options and bringing real-time replication capability for SAP to BigQuery. Integrated data for accelerated insights
5 Features IT Departments Love About Google Cloud
Throughout the past couple of years, I have helped a good number of companies, big and small, migrate their systems to the Google Cloud Platform (aka GCP). During the course of these migrations, there are always a few of those moments where people look at a specific Google Cloud feature and say,
