





4570
Of your peers have already watched this video.
32:30 Minutes
The most insightful time you'll spend today!
Technical deep dive on Looker: The enterprise BI solution for Google Cloud
Thousands of users accessing petabytes of data on a daily basis: This is a challenging proposition for enterprises, without a doubt.
But Looker makes it possible. Beyond just accessing data though, Looker’s platform transforms your company’s relationship with data.
Go under the hood of Looker, with Olivia Morgan, Enterprise CE, Looker, to see how LookML empowers developers to take advantage of powerful data warehouses like BigQuery and ultimately enhance the workflows of end users.
She also takes a deep dive into LookML’s ability to use Google Cloud Functions and Search API to enhance dashboards, leverage BQML within Looker’s modeling layer to give users access to forecasts, tie in BigQuery’s public datasets to add richness to analysis, and show off LookML’s ability to handle nested tables for faster performance on transaction analysis all through a complete end to end demo.
10515
Of your peers have already watched this video.
2:15 Minutes
The most insightful time you'll spend today!
The True Story of How HotStar Broke a World-Record–Thanks to Firebase and Google BigQuery
Hotstar, India’s largest video streaming platform with 150 million monthly active users around the world, provides live-streaming of TV shows, movies, sports, and news on the go.
By using a combination of Firebase products together, Hotstar safely rolled out new features to its watch screen during a major live-streaming event without disrupting users, sacrificing stability, or releasing a new build. They also used Firebase with BigQuery to analyze their event data and reduce app startup time.
“We have an ambitious mission, but our engineering team is only a fraction of the size of most of our competitors. But we are still keeping up, and we are doing it with the help of Firebase,” says Ayushi Gupta, Android Engineer, Hotstar.
Data to Business Outcomes with Google’s Data Analytics Design Pattern

6735
Of your peers have already read this article.
1:30 Minutes
The most insightful time you'll spend today!
Companies today are inundated with vast amounts of data from various sources. This overwhelming amount of data is meant to benefit the company, but often leaves data teams feeling overwhelmed, which can create data bottlenecks and result in a slow time to value. In fact, only twenty seven percent of companies agree that data and analytics projects produce insights and recommendations that are highly actionable (Accenture). This means that nearly 3 in 4 companies are not unlocking value in their data, which poses a huge challenge for organizations trying to move the needle and drive real business results. We at Google Cloud, however, saw opportunity in this challenge, which is why we created Data Analytics Design Patterns: cross-product technical solutions designed to accelerate a customer’s path to value realization with their data. These industry solutions bring together product capabilities alongside design methodology, open source deployable code, data models, and reference architectures to accelerate your business outcomes.

With Data Analytics Design Patterns, you get access to more than 30 ready-to-deploy data analytics solutions. Design patterns leverage the best of Google and our rich partner ecosystem, including Technology Partners & System Integrators. In this blog, we will cover 3 examples on how a design pattern can be applied to unlock the value of data:
- Improve mobile app experience with Unified App Analytics
- Maximize digital shop’s revenue with Price Optimization
- Protect internal systems from security and malware threat with Anomaly Detection
Unified App Analytics
If mobile apps are part of your go-to-market strategy, you have several data sources that can provide invaluable customer insights. In addition to tools such as CRM (e.g. Salesforce) and customer care (e.g. Zendesk), you likely use Google Analytics to log app events and Firebase Crashlytics to gather data about app errors. But can you easily combine back-end server data with app front-end data to unlock customer insights?
The Unified App Analytics design pattern makes it easy to plug all the disparate data sources into a single warehouse (BigQuery) and start analyzing it with a Business Intelligence tool (Looker). Once you have a complete and real time view of your customer experience with your app, you can take action. For example, if you notice an increase in app errors, you can quickly combine your Crashlytics data with your CRM data to narrow down the crashes with the highest revenue impact and prioritize their resolution. Further, you can automate your issue resolution workflow by creating a rule for any future crash that impacts a subset of VIP customers.

With the Unified App Analytics design pattern, you’ll gain access to valuable insights about your user experience with your app so you can inform your future app strategy. For example, NPR, an American media company, increased user engagement by showing content that better mapped to listener interests and behaviors.
Price Optimization
In a competitive and hectic global marketplace, strategic pricing matters more than ever, but often projects are consumed by the tedium of standardizing, cleaning, and preparing data—from transactions, inventory, demand, among other sources.
Price Optimization solution allows retailers to build a data driven pricing model. The solution consists of three main components:
- Dataprep by Trifacta: integrates different data sources into a single Common Data Model (CDM). Dataprep is an intelligent data service for visually exploring, cleaning, and preparing structured and unstructured data for analysis, reporting, and machine learning.
- BigQuery: allows you to create and store pricing models in a consistent and scalable way as a serverless Cloud Data Warehouse service
- Looker dashboards: surface insights and enable business teams to take action with enterprise ready BI platform
With the Price Optimization design pattern from Google Cloud and our partner Trifacta, you’ll be able to rapidly unify multiple data sources and create a real-time and ML-powered analysis, leveraging predictive models to estimate future sales. For example, PDPAOLA, an online jewelry company, doubled sales with dynamic pricing adjustments enabled by a single data view.

Anomaly Detection
Organizations need to anticipate and act on risks and opportunities to stay competitive in a digitally transforming society. Anomaly detection helps organizations identify and respond to data points and data trends in high velocity, high volume data sets that deviate from historical standards and expected behaviors, allowing them to take action on changing user needs, mitigate malicious actors and behaviors, and prevent unnecessary costs and monetary losses.
The Anomaly Detection design pattern uses Google Pub/Sub, BigQuery, Dataflow, and Looker to:
- Stream events in real time
- Process the events, extract useful data points, train the detection algorithm of choice
- Apply the detection algorithm in near-real time to the events to detect anomalies
- Update dashboards and/or send alerts
The challenge of finding the important insights and anomalies in vast amounts of data applies to organizations across all industries and lines of business, but is especially important to protecting the security of an organization. For example, TELUS, a national communications company, modernized their security analytics platform leveraging this pattern, allowing them to detect anomalies in near real time to detect and mitigate suspicious activity.
Get started
Turn your data into business outcomes with Google Cloud and our broad partner ecosystem by deploying Data Analytics Design Patterns at your organization. There are more than 30 Data Analytics Design Patterns ready for you to use. We have more than 200+ more ideas in the pipeline, so be sure to check in regularly as new patterns will be added soon.
To dive deeper and find out more about how Data Analytics Design Patterns can help your organization accelerate use cases and create faster time to value, check out this video.
The Query Execution Graph: Your Key to Better BigQuery Analytics

3081
Of your peers have already read this article.
2:30 Minutes
The most insightful time you'll spend today!
BigQuery offers strong query performance, but it is also a complex distributed system with many internal and external factors that can affect query speed. When your queries are running slower than expected or are slower than prior runs, understanding what happened can be a challenge.
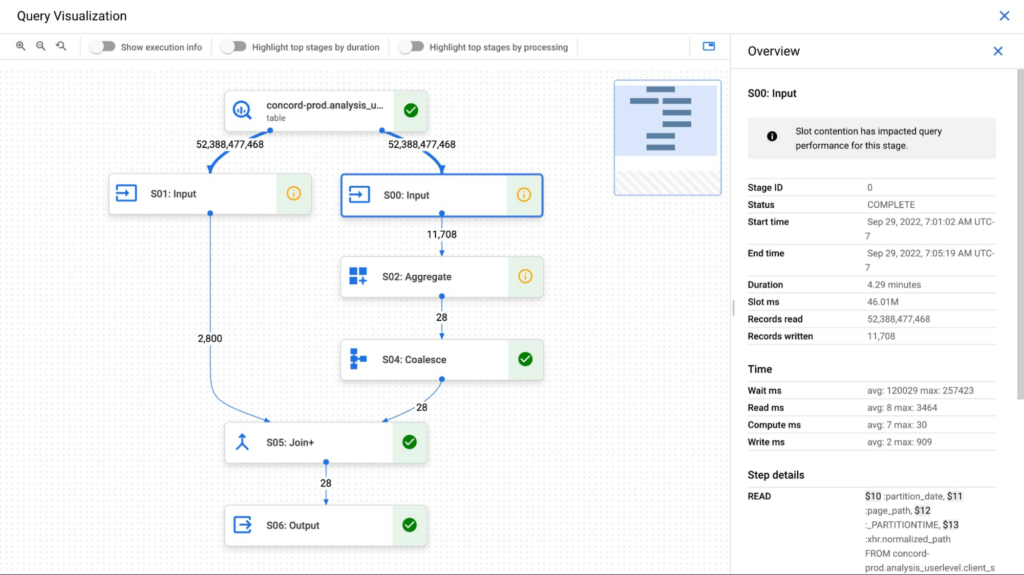
The query execution graph provides an intuitive interface for inspecting query execution details. By using it, you can review the query plan information in graphical format for any query, whether running or completed.
You can also use the query execution graph to get performance insights for queries. Performance insights provide best-effort suggestions to help you improve query performance. Since query performance is multi-faceted, performance insights might only provide a partial picture of the overall query performance.
Execution graph
When BigQuery executes a query job, it converts the declarative SQL statement into a graph of execution, broken up into a series of query stages, which themselves are composed of more granular sets of execution steps. The query execution graph provides a visual representation of the execution stages and shows the corresponding metrics. Not all stages are made equal. Some are more expensive and time consuming than others. The execution graph provides toggles for highlighting critical stages, which makes it easier to spot the potential performance bottlenecks in the query.
Query performance insights
In addition to the detailed execution graph BigQuery also provides specific insights on possible factors that might be slowing query performance.
Slot contention
When you run a query, BigQuery attempts to break up the work needed by your query into tasks. A task is a single slice of data that is input into and output from a stage. A single slot picks up a task and executes that slice of data for the stage. Ideally, BigQuery slots execute tasks in parallel to achieve high performance. Slot contention occurs when your query has many tasks ready for slots to start executing, but BigQuery can’t get enough available slots to execute them.
Insufficient shuffle quota
Before running your query, BigQuery breaks up your query’s logic into stages. BigQuery slots execute the tasks for each stage. When a slot completes the execution of a stage’s tasks, it stores the intermediate results in shuffle. Subsequent stages in your query read data from shuffle to continue your query’s execution. Insufficient shuffle quota occurs when you have more data that needs to get written to shuffle than you have shuffle capacity.
Data input scale change
Getting this performance insight indicates that your query is reading at least 50% more data for a given input table than the last time you ran the query and hence experiencing query slowness. You can use table change history to see if the size of any of the tables used in the query has recently increased.
What’s next?
We continue to work on improving the visualization of the graph. We are working on adding additional metrics to each step and adding more performance insights that will make query diagnosis significantly easier. We are just getting started.
Uniting Data and Analytics in One Place: Apache Iceberg and BigLake

1141
Of your peers have already read this article.
2:30 Minutes
The most insightful time you'll spend today!
When your data is siloed data across lakes and warehouses, it can be hard to transform outcomes with your data. Apache Iceberg is an open table format that provides data management capabilities for data hosted on object stores and enables organizations to run analytics and AI use cases over a single copy of data. A growing community of data engineers, customers, and industry partners are contributing, integrating, and deploying Iceberg, making it the standard for organizations building open-format lakehouses.
To help customers on this journey, we announced support for Iceberg through BigLake in October, 2022. Since its preview, many customers have started building lakehouse workloads using Apache Iceberg as their data management layer, and this support is now generally available.
Unify analytics, streaming and AI use cases over a single copy of data
You can use open-source engines to process and ingest data into Iceberg tables, and BigQuery can query those tables. Since the preview, customers have also used Spark, Trino and Flink to process Iceberg tables and make those tables available to their BigQuery users. Then, BigLake Metastore provides shared metadata for Iceberg tables across BigQuery and open-source engines, eliminating the need to maintain multiple table definitions. Further, you can provide BigQuery datasets and table properties when creating new Iceberg tables in Spark, and those tables become automatically available for the BigQuery user to query.
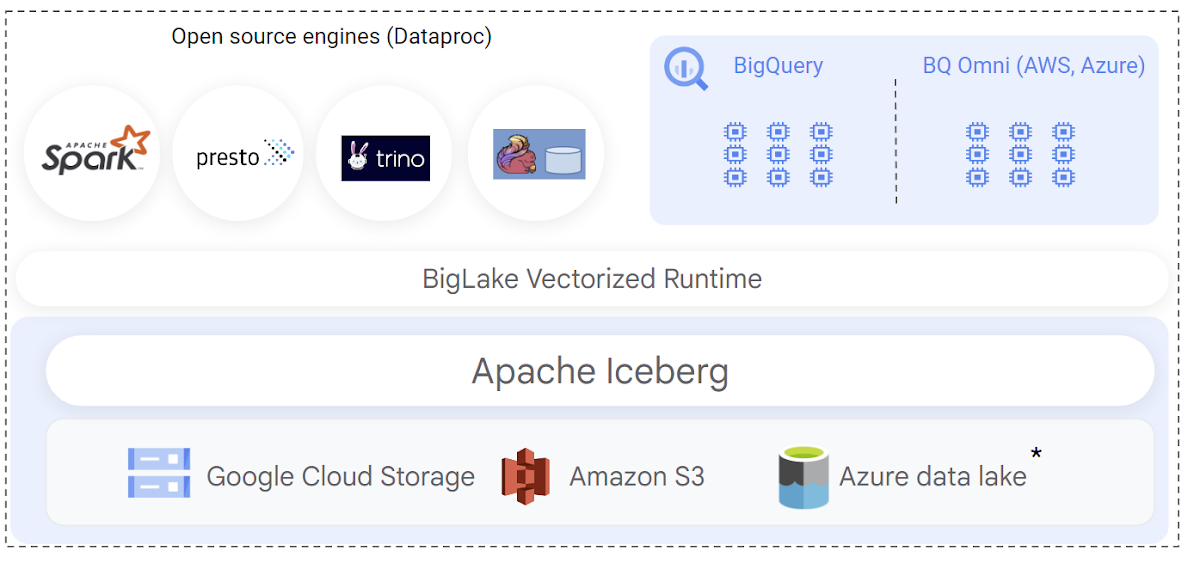
When implementing Iceberg lakehouse workloads, query performance is a top priority for data warehouse users. BigQuery natively integrates with the Iceberg transaction logs and leverages its rich metadata for efficient query planning. Query plans are designed to reduce BigQuery compute consumption by lowering the amount of scanned data, by optimizing joins, and by improving data-plane parallelism. The net result is that you get better query performance and lower slot usage when querying BigLake Iceberg tables.
This GA release also adds support to provide automatic synchronization of table schema in BigQuery when the table is modified through an open-source engine.
Engine-agnostic, industry-leading security and governance built-in
Customers have been telling us that building Iceberg lakehouses in a secure and governed manner is a top priority. BigLake support for Iceberg provides fine-grained access control, including row- and column-level security as well as data masking to simplify this. These features are designed to work independently of the query engine. During the preview, we expanded BigQuery to also support differential privacy for all tables including Iceberg.
You can also define security policies on a BigLake Iceberg table using BigQuery. Security policies are then enforced regardless of the query engine used — BigQuery natively enforces these policies at runtime, and open-source engines can securely access the data using the BigQuery Storage API. The BigQuery Storage API enforces the security policies at the data-plane layer, and is offered via pre-built connectors for Spark, Trino, Presto and TensorFlow. You can also use client libraries to build connectors for custom applications.
New use cases with multi-cloud Iceberg lakehouse
The open nature of Apache Iceberg lets you build multi-cloud lakehouses with uniform management of data. With this launch, you can now create BigLake Iceberg tables on Amazon S3, and query them using BigQuery Omni. BigLake’s performance and fine-grained access control features seamlessly extend to multi-cloud Iceberg tables, so you can securely perform cross-cloud analytics with BigQuery. We’ll extend similar support to Azure data lake Gen 2 in the coming weeks.
Apache Iceberg’s format uniformity across clouds also enables new data sharing use cases to help you share data with your customers, partners and suppliers, regardless of which cloud they are using. BigLake Iceberg tables on Cloud Storage or on Amazon S3 can be shared through Analytics Hub and consumed via BigQuery or OSS engines via BigQuery Storage Read API, providing an open sharing standard and the flexibility to use multiple query engines. A notable example of this is the recently announced Salesforce Data Cloud data sharing use case, which enables bi-directional cross-cloud data sharing between Salesforce and BigQuery and which is powered by Iceberg.
Getting started
To create and query your first Iceberg table, following the documentation. or run a quick proof of concept on our analytics lakehouse with the Iceberg jump start solution.

5133
Of your peers have already downloaded this article
7:30 Minutes
The most insightful time you'll spend today!
Sure, machine learning is becoming a business imperative, but how does it work in practice?
That’s the subject of a new step-by-step guide to solving business problems with artificial intelligence and ML, based on insights gathered by IDG Research Services.
Its publication comes at a time when technology leaders face growing pressure to embrace these emerging technologies, yet many have questions about how to get started.
It has real-life examples such as a health services company that used ML to reduce support ticket-resolution time from 48 minutes to six.
In another section, a financial services VP explains that cloud-based ML services enable his company to avoid spending money on computing resources that sit idle.
The guide also includes concrete tips for new ML adopters, provided by the CIOs and other IT leaders who participated in IDG’s research. For example, a real-estate CIO recommends the use of third-party tools that rely on AI and ML technologies, while a financial services VP highlights the challenge and potential of incorporating unstructured data into ML initiatives.
Download the guide now!
More Relevant Stories for Your Company

The Right Datawarehouse Helps Fight Climate Change, While Improving Customer Experience
When you think about climate change, you might not consider a daily commute to work or a drive around town as big contributing factors. And yet, transport is the fastest growing source of CO2 emissions from fossil fuel, which in turn is the largest contributor to climate change. This is the key insight

Zeotap Uses Big Data to Enable Personalized, Precision Marketing at Scale
Customers today expect brands to know what they want. In fact, Forbes cited that 71% of customers feel frustrated when the shopping experience is impersonal. From interests to purchase habits, companies need to target customers effectively in order to stand out from the plethora of competitors in the online marketplace. "Our mission



Chronicle Security Analytics: Key to Address Security Data Overload
Google Cloud's Chronicle is a security analytics platform built for modern use cases to combat modern threats. In today's world, enterprises have undergone significant changes in all aspects, and must adapt to their security needs to counter threats and attacks. Watch the video to learn Google Cloud's initiative to help

Getting Started with BigQuery: 10 Quick Steps
BigQuery is Google's fully managed, petabyte scale, low cost analytics data warehouse. BigQuery is NoOps—there is no infrastructure to manage and you don't need a database administrator—so you can focus on analyzing data to find meaningful insights, use familiar SQL, and take advantage of our pay-as-you-go model. That's great, right? So
