





3136
Of your peers have already watched this video.
36:30 Minutes
The most insightful time you'll spend today!
Don’t sweat the big stuff. Make it Google’s problem
Need to interpolate new time series data values over 5 billion rows? Don’t reach for python. Make that Google’s problem and do it in BigQuery.
Need to aggregate petabytes of geospatial data across arbitrary polygons and put it on a map for analysis? Make that Google’s problem and use BQ-GIS.
Great – your map was awesome and now we need it every hour. Roll your own Airflow server? Nope. Make that Google’s problem. You see the pattern.
Geotab, which operates in in the telematics space, applies instrumenting to vehicles to learn how to optimize fleet maintenance, routes and costs, and even find way to optimize city infrastructure.
Geotab has been a long-time customer of Google Cloud products. They leverage the entire GCP suite to empower data scientists to efficiently ingest, process, and analyze petabytes of IoT data.
One of the keys to their pace of innovation and growth has been to focus on their key competencies and partner with others to fill in the gaps.
For Geotab’s data scientists this means focusing on the data and model-building and whenever possible making the processing, storage, and orchestration, well Google’s problem.
New Capabilities in BigQuery to Ease Anomalies Detection in the Absence of Labeled Data

6346
Of your peers have already read this article.
4:00 Minutes
The most insightful time you'll spend today!
When it comes to anomaly detection, one of the key challenges that many organizations face is that it can be difficult to know how to define what an anomaly is. How do you define and anticipate unusual network intrusions, manufacturing defects, or insurance fraud? If you have labeled data with known anomalies, then you can choose from a variety of supervised machine learning model types that are already supported in BigQuery ML. But what can you do if you don’t know what kind of anomaly to expect, and you don’t have labeled data? Unlike typical predictive techniques that leverage supervised learning, organizations may need to be able to detect anomalies in the absence of labeled data.
Today we are announcing the public preview of new anomaly detection capabilities in BigQuery ML that leverage unsupervised machine learning to help you detect anomalies without needing labeled data. Depending on whether or not the training data is time series, users can now detect anomalies in training data or on new input data using a new ML.DETECT_ANOMALIES function (documentation), with the following models:
- Autoencoder model, now in Public Preview (documentation)
- K-means model, already GA (documentation)
- ARIMA_PLUS time series model, already GA (documentation)
How does anomaly detection with ML.DETECT_ANOMALIES work?
To detect anomalies in non-time-series data, you can use:
- K-means clustering models: When you use
ML.DETECT_ANOMALIESwith a k-means model, anomalies are identified based on the value of each input data point’s normalized distance to its nearest cluster. If that distance exceeds a threshold determined by the contamination value provided by the user, the data point is identified as an anomaly. - Autoencoder models: When you use
ML.DETECT_ANOMALIESwith an autoencoder model, anomalies are identified based on the reconstruction error for each data point. If the error exceeds a threshold determined by the contamination value, it is identified as an anomaly.
To detect anomalies in time-series data, you can use:
- ARIMA_PLUS time series models: When you use
ML.DETECT_ANOMALIESwith an ARIMA_PLUS model, anomalies are identified based on the confidence interval for that timestamp. If the probability that the data point at that timestamp occurs outside of the prediction interval exceeds a probability threshold provided by the user, the datapoint is identified as an anomaly.
Below we show code examples of anomaly detection in BigQuery ML for each of the above scenarios.
Anomaly detection with a k-means clustering model
You can now detect anomalies using k-means clustering models, by running ML.DETECT_ANOMALIES to detect anomalies in the training data or in new input data. Begin by creating a k-means clustering model:
Language: SQL
CREATE MODEL `mydataset.my_kmeans_model`OPTIONS(MODEL_TYPE = 'kmeans',NUM_CLUSTERS = 8,KMEANS_INIT_METHOD = 'kmeans++') ASSELECT* EXCEPT(Time, Class)FROM`bigquery-public-data.ml_datasets.ulb_fraud_detection`;
With the k-means clustering model trained, you can now run ML.DETECT_ANOMALIES to detect anomalies in the training data or in new input data.
To detect anomalies in the training data, use ML.DETECT_ANOMALIES with the same data used during training:
Language: SQL
SELECT*FROMML.DETECT_ANOMALIES(MODEL `mydataset.my_kmeans_model`,STRUCT(0.02 AS contamination),TABLE `bigquery-public-data.ml_datasets.ulb_fraud_detection`);

To detect anomalies in new data, use ML.DETECT_ANOMALIES and provide new data as input:
Language: SQL
SELECT*FROMML.DETECT_ANOMALIES(MODEL `mydataset.my_kmeans_model`,STRUCT(0.02 AS contamination),(SELECT * FROM `mydataset.newdata`));

How does anomaly detection work for k-means clustering models?
Anomalies are identified based on the value of each input data point’s normalized distance to its nearest cluster, which, if exceeds a threshold determined by the contamination value, is identified as an anomaly. How does this work exactly? With a k-means model and data as inputs, ML.DETECT_ANOMALIES first computes the absolute distance for each input data point to all cluster centroids in the model, then normalizes each distance by the respective cluster radius (which is defined as the standard deviation of the absolute distances of all points in this cluster to the centroid). For each data point, ML.DETECT_ANOMALIES returns the nearest centroid_id based on normalized_distance, as seen in the screenshot above. The contamination value, specified by the user, determines the threshold of whether a data point is considered an anomaly. For example, a contamination value of 0.1 means that the top 10% of descending normalized distance from the training data will be used as the cut-off threshold. If the normalized distance for a datapoint exceeds the threshold, then it is identified as an anomaly. Setting an appropriate contamination will be highly dependent on the requirements of the user or business.
For more information on anomaly detection with k-means clustering, please see the documentation here.
Anomaly detection with an autoencoder model
You can now detect anomalies using autoencoder models, by running ML.DETECT_ANOMALIES to detect anomalies in the training data or in new input data.
Begin by creating an autoencoder model:
Language: SQL
CREATE MODEL `mydataset.my_autoencoder_model`OPTIONS(model_type='autoencoder',activation_fn='relu',batch_size=8,dropout=0.2,hidden_units=[32, 16, 4, 16, 32],learn_rate=0.001,l1_reg_activation=0.0001,max_iterations=10,optimizer='adam') ASSELECT* EXCEPT(Time, Class)FROM`bigquery-public-data.ml_datasets.ulb_fraud_detection`;
To detect anomalies in the training data, use ML.DETECT_ANOMALIES with the same data used during training:
Language: SQL
SELECT*FROMML.DETECT_ANOMALIES(MODEL `mydataset.my_autoencoder_model`,STRUCT(0.02 AS contamination),TABLE `bigquery-public-data.ml_datasets.ulb_fraud_detection`);

To detect anomalies in new data, use ML.DETECT_ANOMALIES and provide new data as input:
Language: SQL
SELECT*FROMML.DETECT_ANOMALIES(MODEL `mydataset.my_autoencoder_model`,STRUCT(0.02 AS contamination),(SELECT * FROM `mydataset.newdata`));

How does anomaly detection work for autoencoder models?
Anomalies are identified based on the value of each input data point’s reconstructed error, which, if exceeds a threshold determined by the contamination value, is identified as an anomaly. How does this work exactly? With an autoencoder model and data as inputs, ML.DETECT_ANOMALIES first computes the mean_squared_error for each data point between its original values and its reconstructed values. The contamination value, specified by the user, determines the threshold of whether a data point is considered an anomaly. For example, a contamination value of 0.1 means that the top 10% of descending error from the training data will be used as the cut-off threshold. Setting an appropriate contamination will be highly dependent on the requirements of the user or business.
For more information on anomaly detection with autoencoder models, please see the documentation here.
Anomaly detection with an ARIMA_PLUS time-series model

With ML.DETECT_ANOMALIES, you can now detect anomalies using ARIMA_PLUS time series models in the (historical) training data or in new input data. Here are some examples of when might you want to detect anomalies with time-series data:
Detecting anomalies in historical data:
- Cleaning up data for forecasting and modeling purposes, e.g. preprocessing historical time series before using them to train an ML model.
- When you have a large number of retail demand time series (thousands of products across hundreds of stores or zip codes), you may want to quickly identify which stores and product categories had anomalous sales patterns, and then perform a deeper analysis of why that was the case.
Forward looking anomaly detection:
- Detecting consumer behavior and pricing anomalies as early as possible: e.g. if traffic to a specific product page suddenly and unexpectedly spikes, it might be because of an error in the pricing process that leads to an unusually low price.
- When you have a large number of retail demand time series (thousands of products across hundreds of stores or zip codes), you would like to identify which stores and product categories had anomalous sales patterns based on your forecasts, so you can quickly respond to any unexpected spikes or dips.
How do you detect anomalies using ARIMA_PLUS? Begin by creating an ARIMA_PLUS time series model:
Language: SQL
CREATE OR REPLACE MODEL mydataset.my_arima_plus_modelOPTIONS(MODEL_TYPE='ARIMA_PLUS',TIME_SERIES_TIMESTAMP_COL='date',TIME_SERIES_DATA_COL='total_amount_sold',TIME_SERIES_ID_COL='item_name',HOLIDAY_REGION='US') ASSELECTdate,item_description AS item_name,SUM(bottles_sold) AS total_amount_soldFROM`bigquery-public-data.iowa_liquor_sales.sales`GROUP BYdate,item_nameHAVINGdate BETWEEN DATE('2016-01-04') AND DATE('2017-06-01')AND item_name IN ("Black Velvet", "Captain Morgan Spiced Rum","Hawkeye Vodka", "Five O'Clock Vodka", "Fireball Cinnamon Whiskey");
To detect anomalies in the training data, use ML.DETECT_ANOMALIES with the model obtained above:
Language: SQL
SELECT*FROMML.DETECT_ANOMALIES(MODEL `mydataset.my_arima_plus_model`,STRUCT(0.8 AS anomaly_prob_threshold));

To detect anomalies in new data, use ML.DETECT_ANOMALIES and provide new data as input:
Language: SQL
WITHnew_data AS (SELECTdate,item_description AS item_name,SUM(bottles_sold) AS total_amount_soldFROM`bigquery-public-data.iowa_liquor_sales.sales`GROUP BYdate,item_nameHAVINGdate BETWEEN DATE('2017-06-02')AND DATE('2017-10-01')AND item_name IN ('Black Velvet','Captain Morgan Spiced Rum','Hawkeye Vodka',"Five O'Clock Vodka",'Fireball Cinnamon Whiskey') )SELECT*FROMML.DETECT_ANOMALIES(MODEL `mydataset.my_arima_plus_model`,STRUCT(0.8 AS anomaly_prob_threshold),(SELECT*FROMnew_data));

For more information on anomaly detection with ARIMA_PLUS time series models, please see the documentation here.
Thanks to the BigQuery ML team, especially Abhinav Khushraj, Abhishek Kashyap, Amir Hormati, Jerry Ye, Xi Cheng, Skander Hannachi, Steve Walker, and Stephanie Wang.
Largest Beauty Retailer in the US Powers Digital Transformation with Google Cloud Smart Analytics

9283
Of your peers have already read this article.
3:15 Minutes
The most insightful time you'll spend today!
Digital technology offers increasing flexibility and choice to consumers. As a result, the retail industry is dramatically shifting toward more tailored and personalized experiences for shoppers, and businesses are rethinking how they deliver value to customers.
This couldn’t be more true for the beauty retailing industry where leading companies are turning to digital technology to create customized shopping experiences.
At Google Cloud, we’re particularly excited about our work with Ulta Beauty, the largest beauty retailer in the United States with more than 1196 stores in all 50 states, and how the company is using Google Cloud technology solutions to power personalization and redefine beauty retailing.
Established in 1990, Ulta Beauty has had incredible success as a company, and as customers become more discerning and curious about their purchases, the company is finding new ways to meet their changing needs.
Recently, leaders at Ulta Beauty recognized a huge opportunity to complement and enhance the shopping experience by helping beauty enthusiasts navigate through more than 500 brands and 25,000 products carried in their stores and online channel.
They decided to leverage the data from Ulta Beauty’s successful Ultamate Rewards loyalty program to create and offer more unique and personalized user experiences.
With more than 30 million members generating data through sales, transactions, product reviews, and social media engagement, Ulta Beauty’s Loyalty Program creates a comprehensive data set, and the company sought the right technology partner to help organize, analyze and transform that data into valuable insights for its customers.
Ulta Beauty’s leaders knew they had an opportunity to leverage data analytics and machine learning to reach customers in new ways, enhance the guest experience, and continue to grow their active loyalty member base. After considering a number of cloud providers, they chose to expand their existing partnership with Google Cloud.
“Google Cloud listened to our needs and worked in tandem with our engineering team to address our challenges,” said Michelle Pacynski, vice president of digital innovation at Ulta Beauty. “The ease of working with the Google Cloud team and their breadth of experience made the decision a no-brainer, laying the foundation for a great partnership.”
In 2019, Ulta Beauty announced it was working with Google Cloud Platform to unify and organize its data, using:
- BigQuery to perform data analysis and generate dynamic content, personalized product recommendations, and event-based messages for customers.
- Cloud Storage to provide highly available, secure, resilient and cost-effective access to data across the entire enterprise.
- Compute Engine for the high-performance scalability needed to grow with customer demand while painlessly migrating existing applications to the cloud.
- Anthos to build a hybrid cloud foundation that allows their applications to take advantage of all this data, combining the power and flexibility of GKE with the ability to leverage their existing investment in secure infrastructure on-premises.
Our partnership with Ulta Beauty has enabled increased engagement with customers in store and online, and the creation of new tools and capabilities, including a new Virtual Beauty Advisor tool to deliver tailored recommendations and help shoppers choose the right products, and a Customer Conversation Platform that’s enabling deeper connections with guests, ultimately driving customer loyalty.
“It’s been a really efficient process so far due in part to the ease of working with the Google team,” said Michelle Pacynski, vice president of digital innovation at Ulta Beauty. “They’re experienced, approachable, and their can-do style makes for a great partnership. They listened to our needs and worked in tandem with our engineering team, figuring things out, and getting it done.”
6565
Of your peers have already watched this video.
17:00 Minutes
The most insightful time you'll spend today!
Eli Lilly’s Custom-built Translation Service Leverages Google’s Translation Engine
Eli Lilly leverages Google Cloud’s machine translation to globalize content to serve their multilingual employees. Watch the video to learn how the healthcare company built an in-house solution powered by Google Cloud APIs to address the challenge of translating multilingual content at scale. Also explore Google’s innovations and investments into services for language translations produced for machine learning (also called as machine translation or neural machine translation) for safe and secure documents and text translation via an easy-to-use interface and API.
4579
Of your peers have already watched this video.
32:30 Minutes
The most insightful time you'll spend today!
Technical deep dive on Looker: The enterprise BI solution for Google Cloud
Thousands of users accessing petabytes of data on a daily basis: This is a challenging proposition for enterprises, without a doubt.
But Looker makes it possible. Beyond just accessing data though, Looker’s platform transforms your company’s relationship with data.
Go under the hood of Looker, with Olivia Morgan, Enterprise CE, Looker, to see how LookML empowers developers to take advantage of powerful data warehouses like BigQuery and ultimately enhance the workflows of end users.
She also takes a deep dive into LookML’s ability to use Google Cloud Functions and Search API to enhance dashboards, leverage BQML within Looker’s modeling layer to give users access to forecasts, tie in BigQuery’s public datasets to add richness to analysis, and show off LookML’s ability to handle nested tables for faster performance on transaction analysis all through a complete end to end demo.

7701
Of your peers have already downloaded this article
4:30 Minutes
The most insightful time you'll spend today!
AI has the power to revolutionize every industry—from retail to agriculture, and education to healthcare. Yet many businesses still haven’t begun to adopt AI.
There are a number of factors, including the need for specialized talent and hardware, the right types and quantities of data for training and refining machine learning models, and of course, the broader complexities of introducing a new way of working inside an organization.
But above all, AI can be challenging to apply to very specific business needs.
Google wants to change that, which is why it’s introducing a number of AI solutions aimed at making it easier for businesses to use AI to address many of these specific use cases.
Google’s AI solutions fall into two categories. The first is a set of pre-packaged AI solutions that can be easily integrated into existing workflows. To make these solutions as easy to implement as possible, Google works with popular, trusted enterprise partners who have deep-domain expertise in these workflows.
The majority of Google’s pre-packaged solutions will be delivered through these partners, although it will be offering some
The second category of AI solutions is comprised of reference architectures that businesses can use to create highly-custom AI tools. These require more development work than Google’s pre-packaged
Additionally, businesses can build on these architectures and deploy them to market more quickly, helping your business take advantage of AI, faster.
Learn more about all Google’s AI solutions. Download the whitepaper now!
More Relevant Stories for Your Company

Analytics Hub for Secure Data Sharing and Analytics Unlocks True Data Value and Insights
Customers tell us that sharing and exchanging data with other organizations is a critical element of their analytics strategy, but it’s hamstrung by unreliable data and processes, and only getting harder with security threats and privacy regulations on the rise. Furthermore, traditional data sharing techniques use batch data pipelines that are
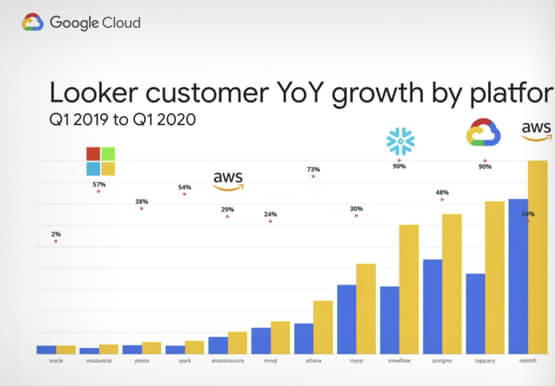
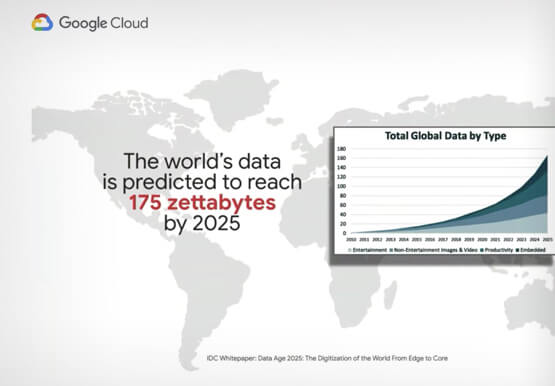

Data Leaders in 2021 and Beyond: How to Prepare
As technologies and workplace environments are quickly evolving, how people and businesses leverage data in their day-to-day workflow is also changing. Data leaders are an emerging force navigating and charting pathways forward towards new horizons for how people and organizations experience data. In this presentation, Pedro Arellano, Product Marketing Director,

Mid-Sized B2B Firm Achieves the Business Trifecta with a Single Strategy
Thirteen years’ experience in e-commerce has given Teddy Chan, Chief Executive Officer and Chief Technology Officer, AfterShip, a deep understanding of the challenges of shipping and tracking packages to customers worldwide. “The key problem many merchants face is customers asking ‘where is my order?’ and ‘when I will get the package?’”

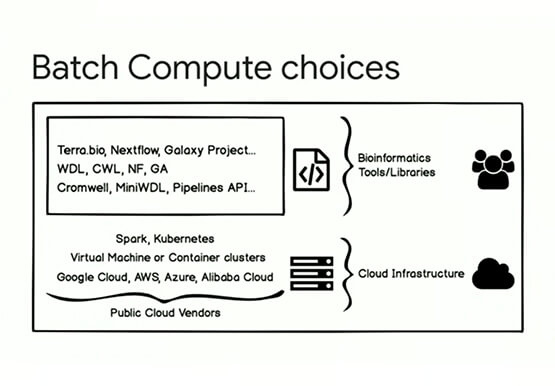
GCP for Bioinformatics
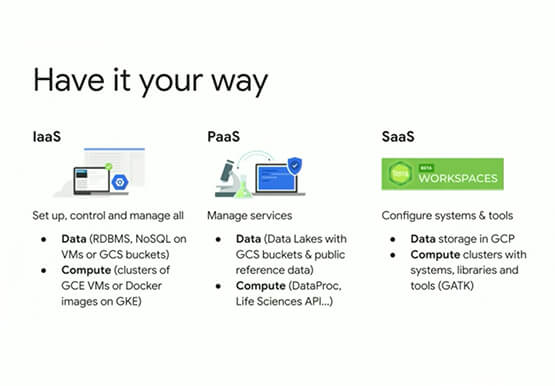
Join Cloud GDE and developer Lynn Langit in this fast-paced session to get resources you can use to learn how to use the Google Cloud Platform for bioinformatics. Lynn has created an open source course (on GitHub) to introduce researchers to using GCP to scale their analysis jobs. In this
