





Analytics Hub for Secure Data Sharing and Analytics Unlocks True Data Value and Insights

6734
Of your peers have already read this article.
2:30 Minutes
The most insightful time you'll spend today!
Customers tell us that sharing and exchanging data with other organizations is a critical element of their analytics strategy, but it’s hamstrung by unreliable data and processes, and only getting harder with security threats and privacy regulations on the rise.
Furthermore, traditional data sharing techniques use batch data pipelines that are expensive to run, create late arriving data, and can break with any changes to the source data. They also create multiple copies of data, which brings unnecessary costs and can bypass data governance processes. These techniques do not offer features for data monetization, such as managing subscriptions and entitlements. Altogether, these challenges mean that organizations are unable to realize the full potential of transforming their business with shared data.
To address these limitations, we are introducing Analytics Hub, a new fully managed service, available in Q3, in preview, that helps you unlock the value of data sharing, leading to new insights and increased business value. With Analytics Hub you get:
- A rich data ecosystem by publishing and subscribing to analytics-ready datasets.
- Control and monitoring over how your data is being used, because data is shared in one place.
- A self-service way to access valuable and trusted data assets, including data provided by Google. For example, a unique dataset from Google Search Trends will be available, that you can query and combine with your own data.
- An easy way to monetize your data assets without the overhead of building and managing the infrastructure.
Built on a decade of cross-organizational sharing
While Analytics Hub is a new service, it builds on BigQuery, Google’s petabyte-scale, serverless cloud data warehouse. BigQuery’s unique architecture provides separation between compute and storage, enabling data publishers to share data with as many subscribers as you want without having to make multiple copies of your data. With BigQuery, there are no servers to deploy or manage, which means that data consumers get immediate value from shared data. Data can be provided and consumed in real-time using the streaming capabilities of BigQuery and you can leverage the built in machine learning, geospatial, and natural language capabilities of BigQuery or take advantage of the native business intelligence support with tools like Looker, Google Sheets, and Data Studio.
BigQuery has had cross-organizational, in-place data sharing capabilities since it was introduced in 2010. We took a look at usage metrics in BigQuery and found that over a 7 day period in April, we had over 3,000 different organizations sharing over 200 petabytes of data. These numbers don’t include data sharing between departments within the same organization.
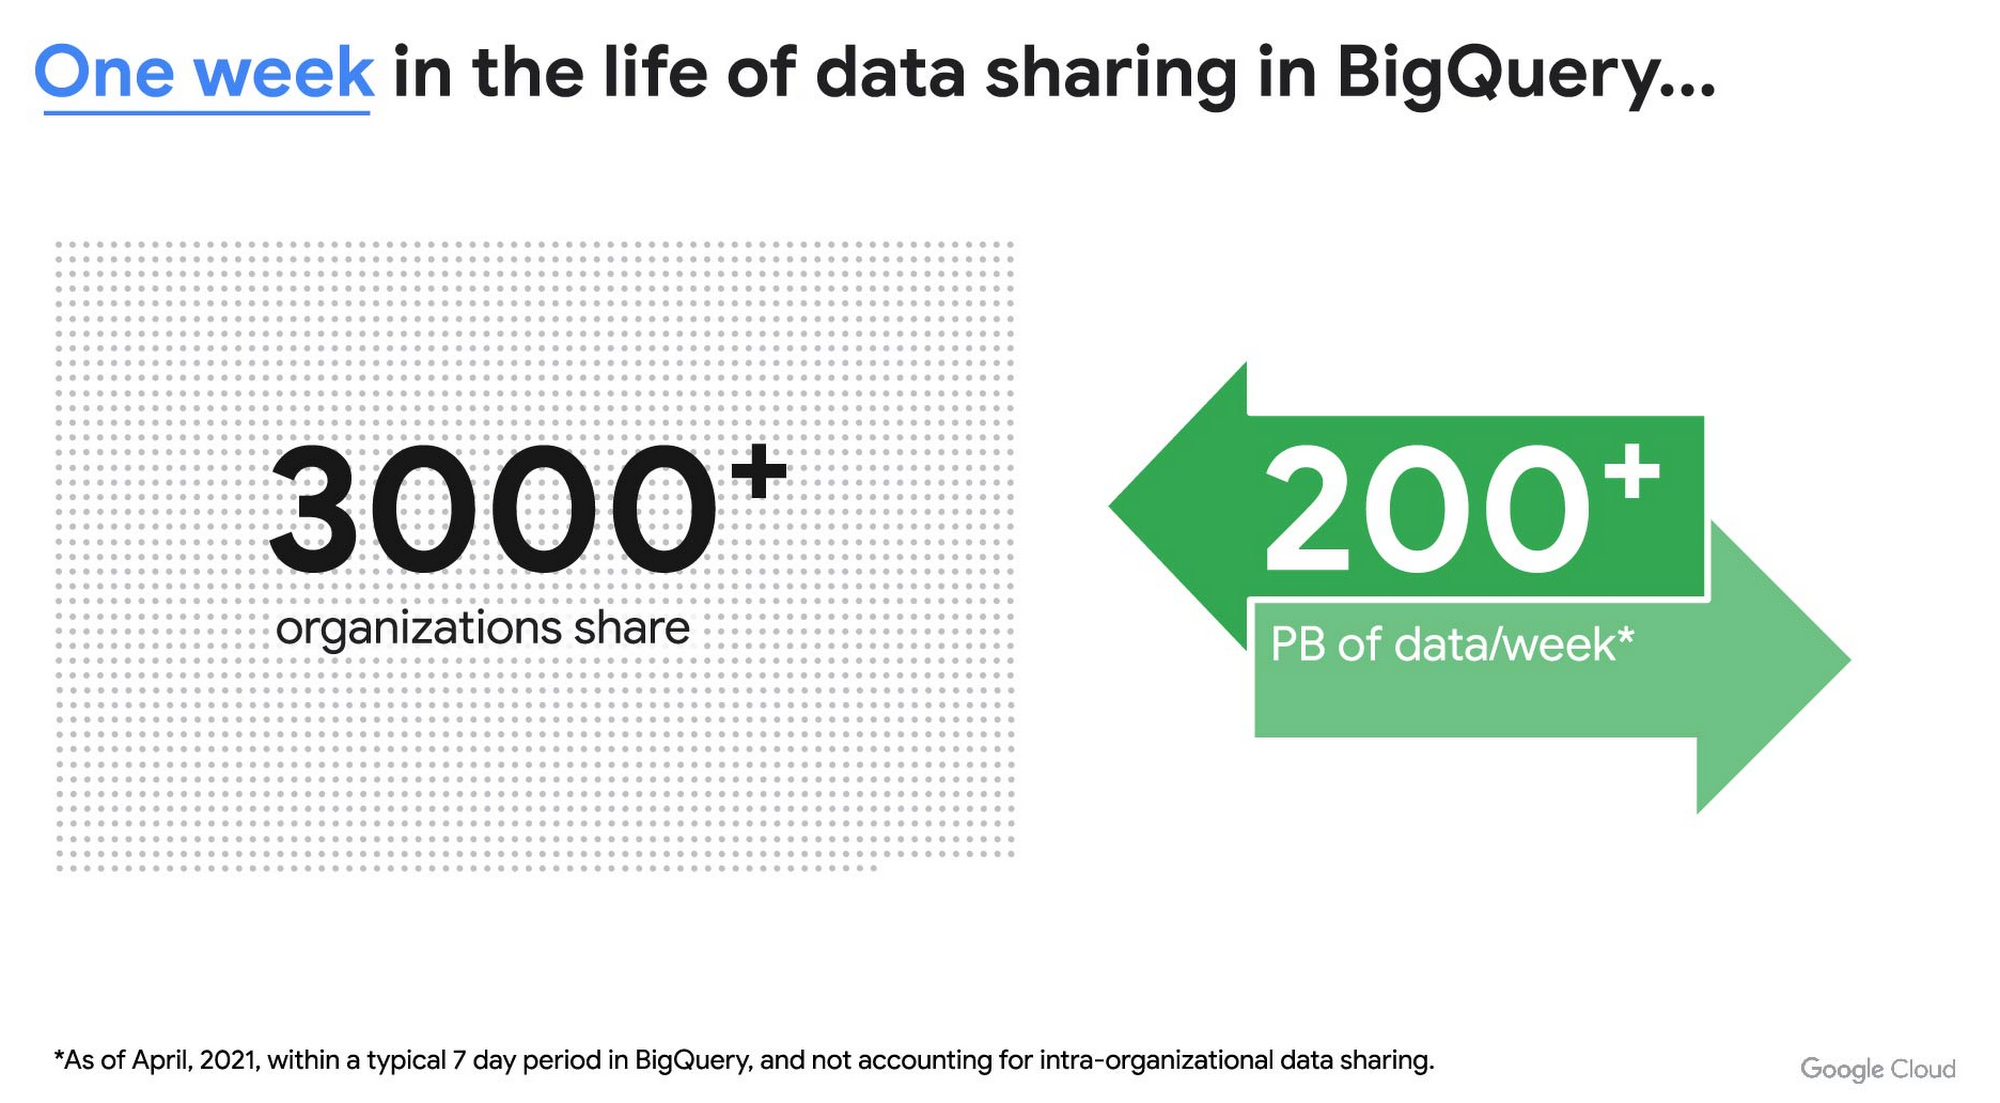
As you can see, data sharing in BigQuery is already popular. But we want to make it easier and even more scalable.
Raising the bar on data sharing
To make data sharing easier and more scalable in BigQuery, Analytics Hub introduces the concepts of shared datasets and exchanges. As a data publisher, you create shared datasets that contain the views of data that you want to deliver to your subscribers. Next, you create exchanges, which are used to organize and secure shared datasets. By default, exchanges are completely private, which means that only the users and groups that you give access to can view or subscribe to the data. You can also create internal exchanges or leverage public exchanges provided by Google. Finally, you publish shared datasets into an exchange to make them available to subscribers.
Data subscribers search through the datasets that are available across all exchanges for which they have access and subscribe to relevant datasets. This creates a linked dataset in their project that they can query and join with their own data. Subscribers pay for the queries that they run against the data while the publisher pays for the storage of the data. Data providers can add new data, new tables, or new columns to the shared dataset and these will be immediately available to subscribers. In addition, the publisher can track subscribers, disable subscriptions, and see aggregated usage information for the shared data.
Analytics Hub makes it easy for you to publish, discover, and subscribe to valuable datasets that you can combine with your own data to derive unique insights. Here are some types of data that will be available through Analytics Hub:
- Public datasets: Easy access to the existing repository of over 200 public datasets, including data about weather and climate, cryptocurrency, healthcare and life sciences, and transportation.
- Google datasets: Unique, freely-available datasets from Google. One example of this is the COVID-19 community mobility dataset. Another example is the forthcoming Google Trends dataset, which will provide the top 25 search terms and top 25 rising search terms over a 5 year window in 210 distinct locations in the US. Trends data can be used by everyone in the organization to gain insights into what customers care about.
- Commercial (paid for) datasets: We are working with leading commercial data providers to bring their data products to Analytics Hub. If you are interested in delivering your data via Analytics Hub, we’re also introducing Data Gravity, an initiative that provides storage benefits and new distribution paths for data published through Analytics Hub.
- Internal datasets: We know that data sharing can be challenging in larger organizations. Analytics Hub can be used for internal data, for example, to share standardized customer demographics with your sales engineering and data science teams.
Customers and partners using Analytics Hub

“Google Search Trends data has always been an important tool for our WPP agency data teams. At WPP we believe that data variety is a superpower which is why we are excited to use the new Trends dataset availability within BigQuery, plus the launch of Analytics Hub. The best creativity in the world is informed by data insights, and influenced by what people search for, so the operational efficiencies we’ll gain via the Analytics Hub and the insights we can drive with Trends data are just phenomenal.”
—Di Mayze Global Head of Data and AI, WPP

“Equifax Ignite is our shared data analytics environment within our Equifax data fabric. We are excited to partner with Google to leverage Analytics Hub and BigQuery to deliver data to over 400 statisticians and data modelers as well as securely sharing data with our partner financial institutions.”
—Kumar Menon, SVP Data Fabric and Decision Science, Equifax

“The flow of data and insights between our teams at Deloitte and our clients is paramount for building truly transformational data cultures. With its purpose-built architecture for secure data exchanges and sharing analytics resources, Google Cloud’s Analytics Hub can help provide significant operational efficiencies for how Deloitte teams support our clients’ data-driven initiatives within their industry ecosystems. It will also help minimize the worries about scale, privacy and security, or the administrative burden associated with each.”
—Navin Warerkar, Managing Director, Deloitte Consulting LLP, and US Google Cloud Data & Analytics GTM Lead

“Crux Informatics is proud to partner with Google to support the launch of Analytics Hub, removing friction for those who need access to analytics-ready data. With thousands of datasets from over 140 sources, Crux Informatics will accelerate access to data on Analytics Hub and together provide a more efficient and cost effective solution to deliver datasets in Google Cloud’s ecosystem.”
—Will Freiberg, CEO, Crux Informatics
Next steps for Analytics Hub
This is just the beginning for Analytics Hub. As we get to preview and general availability, we will be adding additional capabilities, including workflows for publishing and subscribing, publishing analytics assets (Looker Blocks, Data Studio reports, Connected Google Sheets) along with the shared data, the ability for data publishers to specify query restrictions on the usage of their data, and making it easy for data publishers to create sandbox environments for subscribers to work with their data, even if they are not yet on Google Cloud. We will provide features in Analytics Hub for monetization of data, including managing subscriptions, data entitlements, and billing.
Please sign up for the preview, which is scheduled to be available in the third quarter of 2021. In the meantime, you can learn more about BigQuery and how to leverage its built-in data sharing capabilities. Please go to g.co/cloud/analytics-hub to register your interest in Analytics Hub.
4531
Of your peers have already watched this video.
1:30 Minutes
The most insightful time you'll spend today!
AI-powered Cameras Help You Serve Your Pets Better. Learn How
Watch the video to learn how you can leverage Google Cloud platform and AI functions to build pet-detection cameras that can capture and send image-based alert messages on your phone to notify when your pets arrive or leave.
2854
Of your peers have already watched this video.
17:30 Minutes
The most insightful time you'll spend today!
GCP for Bioinformatics
Join Cloud GDE and developer Lynn Langit in this fast-paced session to get resources you can use to learn how to use the Google Cloud Platform for bioinformatics.
Lynn has created an open source course (on GitHub) to introduce researchers to using GCP to scale their analysis jobs. In this short talk, she’ll guide you through her course materials, so that you can get started learning using examples from genomics.
She talks is divided into four parts:
- What is needed?
- Why do we need to have patterns?
- How can you use pattern information,
- How can you learn more.
How to Predict the Cost of a Managed Streaming and Batch Analytics Service

3619
Of your peers have already read this article.
4:30 Minutes
The most insightful time you'll spend today!
The value of streaming analytics comes from the insights a business draws from instantaneous data processing, and the timely responses it can implement to adapt its product or service for a better customer experience. “Instantaneous data insights,” however, is a concept that varies with each use case. Some businesses optimize their data analysis for speed, while others optimize for execution cost.
In this post, we’ll offer some tips on estimating the cost of a job in Dataflow, Google Cloud’s fully managed streaming and batch analytics service. Dataflow provides the ability to optimize a streaming analytics job through its serverless approach to resource provisioning and management. It automatically partitions your data and distributes your worker code to Compute Engine instances for parallel processing, optimizes potentially costly operations such as data aggregations, and provides on-the-fly adjustments with features like autoscaling and dynamic work rebalancing.
The flexibility that Dataflow’s adaptive resource allocation offers is powerful; it takes away the overhead of estimating workloads to avoid paying for unutilized resources or causing failures due to the lack of processing capacity. Adaptive resource allocation can give the impression that cost estimation is unpredictable too. But it doesn’t have to be. To help you add predictability, our Dataflow team ran some simulations that provide useful mechanisms you can use when estimating the cost of any of your Dataflow jobs.
The main insight we found from the simulations is that the cost of a Dataflow job increases linearly when sufficient resource optimization is achieved. Under this premise, running small load experiments to find your job’s optimal performance provides you with a throughput factor that you can then use to extrapolate your job’s total cost. At a high level, we recommend following these steps to estimate the cost of your Dataflow jobs:
- Design small load tests that help you reach 80% to 90% of resource utilization
- Use the throughput of this pipeline as your throughput factor
- Extrapolate your throughput factor to your production data size and calculate the number of workers you’ll need to process it all
- Use the Google Cloud Pricing Calculator to estimate your job cost
This mechanism works well for simple jobs, such as a streaming job that moves data from Pub/Sub to BigQuery or a batch job that moves text from Cloud Storage to BigQuery. In this post, we will walk you through the process we followed to prove that throughput factors can be linearly applied to estimate total job costs for Dataflow.
Finding the throughput factor for a streaming Dataflow job
To calculate the throughput factor of a streaming Dataflow job, we selected one of the most common use cases: ingesting data from Google’s Pub/Sub, transforming it using Dataflow’s streaming engine, then pushing the new data to BigQuery tables. We created a simulated Dataflow job that mirrored a recent client’s use case, which was a job that read 10 subscriptions from Pub/Sub as a JSON payload. Then, the 10 pipelines were flattened and pushed to 10 different BigQuery tables using dynamic destinations and BigQueryIO, as shown in the image below.
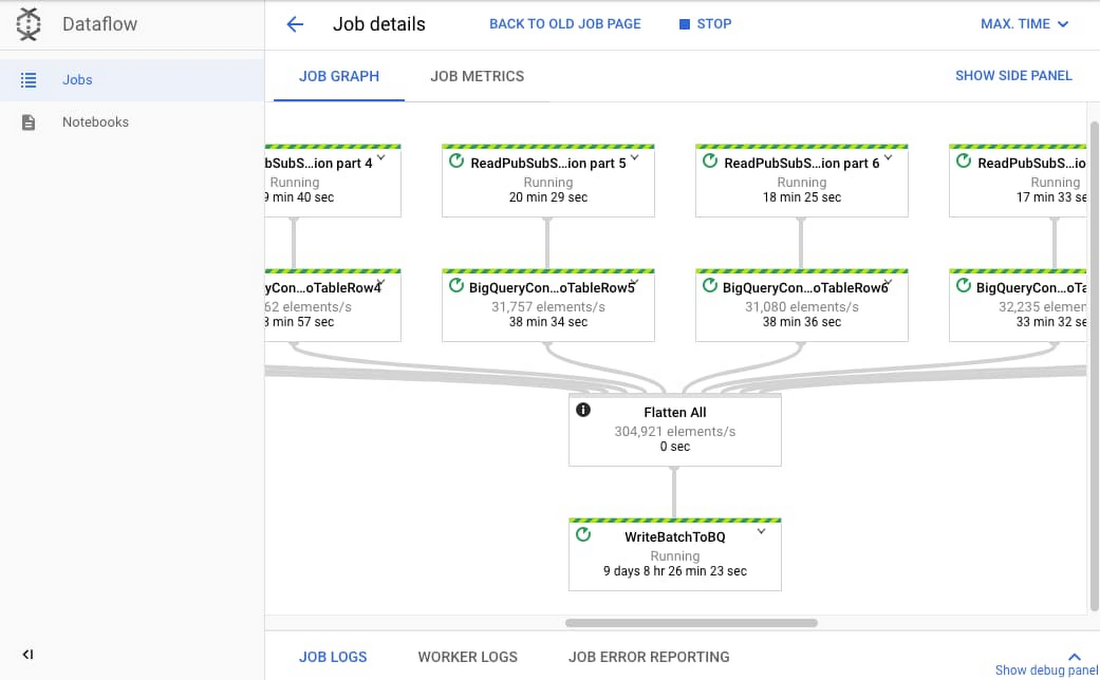
The team ran 11 small load tests for this job. The first few tests were focused on finding the job’s optimal throughput and resource allocation to calculate the job’s throughput factor.
For the tests, we generated messages in Pub/Sub that were 500 KB on average, and we adjusted the number of messages per topic to obtain the total loads to feed each test. We tested a range of loads from 3MB/s to 250MB/s. The table below shows five of the most representative jobs with their adjusted parameters:
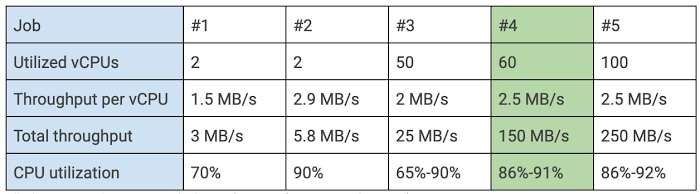
In order to ensure maximum resource utilization, we monitored the backlog of each test using the backlog graph in the Dataflow interface. We recommend targeting an 80% to 90% utilization so that your pipeline has enough capacity to handle small load increases. We considered 86% to 91% of CPU utilization to be our optimal utilization. In this case, it meant a 2.5MB/s per virtual CPU (vCPU) load. This is job #4 on the table above. In all tests, we used n1-standard-2 machines, which are the recommended type for streaming jobs and have two vCPUs. The rest of the tests were focused on proving that resources scale linearly using the optimal throughput, and we confirmed it.
Using the throughput factor to estimate the approximate total cost of a streaming job
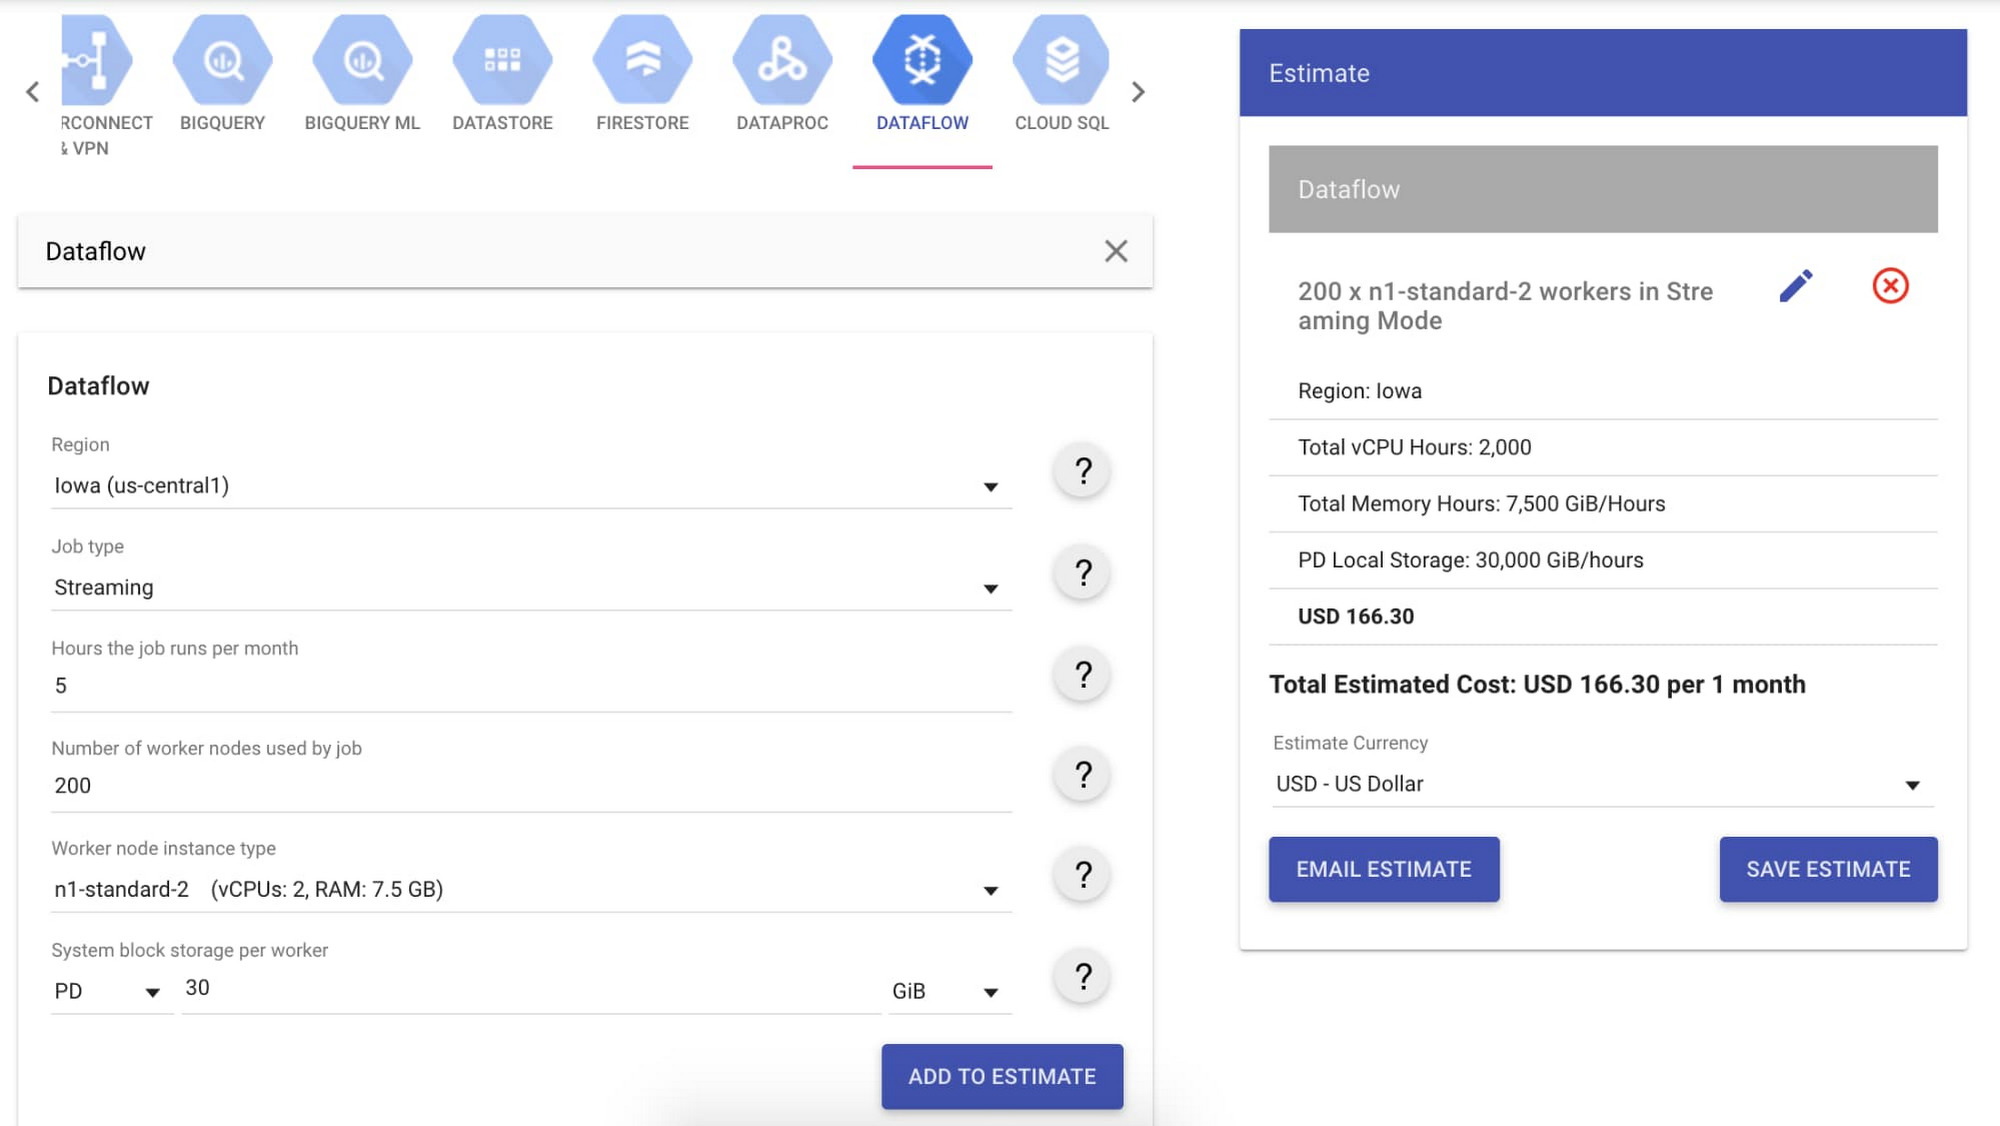
Let’s assume that our full-scale job runs with a throughput of 1GB/s and runs five hours per month. Our throughput factor estimates that 2.5MB/s is the ideal throughput per worker using the n1-standard-2 machines. To support a 1GB/s throughput, we’ll need approximately 400 workers, so 200 n1-standard-2 machines.
We entered this data in the Google Cloud Pricing Calculator and found that the total cost of our full-scale job is estimated at $166.30/month. In addition to worker costs, there is also the cost of streaming data processed when you use the streaming engine. This data is priced by volume measured in gigabytes, and is typically between 30% to 50% of the worker costs. For our use case, we took a conservative approach and estimated 50%, totaling $83.15 per month. The total cost of our use case is $249.45 per month.
Finding the throughput factor for a simple batch Dataflow job
The most common use case in batch analysis using Dataflow is transferring text from Cloud Storage to BigQuery. Our small load experiments read a CSV file from Cloud Storage and transformed it into a TableRow, which was then pushed into BigQuery in batch mode. The source was split into 1 GB files. We ran tests with file sizes from 10GB to 1TB to demonstrate that optimal resource allocation scales linearly. Here are the results of these tests:
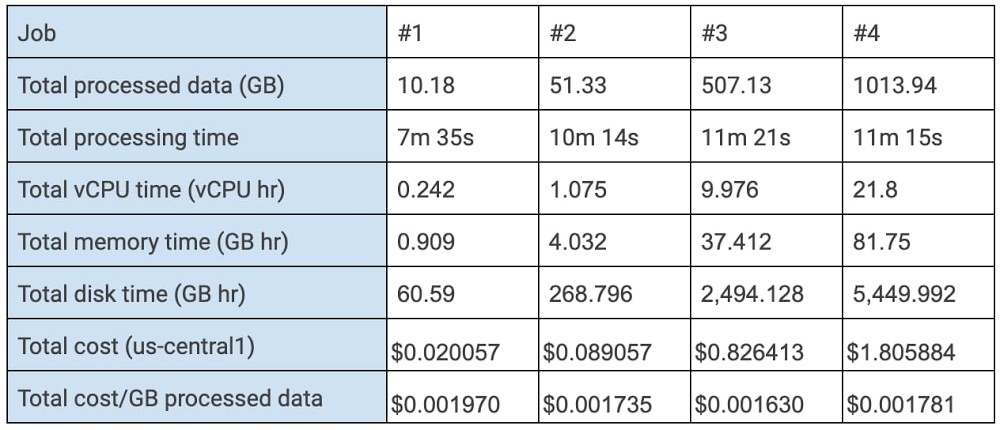
These tests demonstrated that batch analysis applies autoscaling efficiently. Once your job finds an optimized resource utilization, it scales to allocate the resources needed to complete the job with a consistent price per unit of processed data in a similar processing time.
Let’s assume that our real scale job here processes 10TB of data, given that our estimated cost using resources in us-central1 is about $0.0017/GB of processed data. The total cost of our real scale job would be about $18.06. This estimation follows this equation: cost(y) = cost(x) * Y/X, where cost(x) is the cost of your optimized small load test, X is the amount of data processed in your small load test, and Y is the amount of data processed in your real scale job.
The key in this and the previous examples is to design small-load experiments to find your optimized pipeline setup. This setup will give you the parameters for a throughput factor that you can scale to estimate the resources needed to run your real scale job. You can then input these resource estimations in the Pricing Calculator to calculate your total job cost.
How a Mid-Sized Firm is Shrinking Inventory Carryovers 50% with AI

7437
Of your peers have already read this article.
5:30 Minutes
The most insightful time you'll spend today!
For more than 10 years, NMK Textile Mills has manufactured bed linens for major retailers in the United States and Canada. As e-commerce exploded, the company’s co-founder saw an opportunity to grow the business. So, in addition to manufacturing bed linens wholesale for retail customers, NMK Textile Mills reworked its complete supply chain to manufacture products for California Design Den, which became an e-commerce retailer selling its own fashion-forward products directly to consumers online.
With California Design Den’s push into e-commerce, it became apparent the SMB company (with about 250 global employees) faced the same tough supply chain questions as large retail customers, including maintaining enough inventory to meet customer demand in a timely, efficient way.
California Design Den depended upon a myriad of systems to track its complex forecasting and reordering processes. Team members typically planned inventory manually using desktop spreadsheet software, which could lead to excess inventory. Accurately forecasting demand and supply was essential to the company’s financial success—but it was also a challenge.
A couple years ago, California Design Den partnered with Pluto7, a technology solutions provider that offers a software as a service (SaaS) called Planning In A Box. Leveraging Google Cloud Platform machine learning and artificial intelligence, Planning In A Box intelligently helps predict demand and balances it with supply.
But that was just the beginning. “Along the way, we realized that to compete with larger retailers, make quicker decisions, and move faster, we needed to go further,” says Deepak Mehrotra, Co-founder and Chief Adventurer at California Design Den.
With guidance from Pluto7, California Design Den began migrating its database to Google Cloud Platform. Using Google BigQuery, Google Compute Engine, Google Cloud SQL, and Google Cloud Storage, and experimenting with Google Cloud Vision and Google Cloud AutoML, the company is reducing inventory carryovers by more than 50%, improving the accuracy of demand planning quarter over quarter, and gaining granular insights into how individual SKUs are performing.
“We would need an army of data scientists to make faster decisions on pricing and inventory levels. With Google Cloud Platform machine learning and artificial intelligence, we don’t need that. We can make much faster pricing decisions to optimize profitability and move inventory.”
—Deepak Mehrotra, Co-founder and Chief Adventurer, California Design Den
No need for army of data scientists
“Using Google Cloud Platform machine learning and AI was essential for California Design Den if it was to compete successfully with larger retailers,” Deepak says.
For example, tastes and fashions in bed linens can change quickly and consumer prices fluctuate. With more than 2,500 SKUs, it wasn’t possible for California Design Den’s team to continuously monitor product demand and experiment with competitive pricing in real time.
“We would need an army of data scientists to make faster decisions on pricing and inventory levels,” says Deepak. “With Google Cloud Platform machine learning and artificial intelligence, we don’t need that. We can make much faster pricing decisions to optimize profitability and move inventory.”
By integrating all its data onto Google Cloud Platform, California Design Den’s team gains deeper insights into product sales over time, which in turn helps the company improve demand planning by better determining which styles to manufacture and sell in the future.
“When experienced employees leave, their knowledge leaves with them. By having all data in one place, and with machine learning and AI, California Design Den can go back in its history, look at products made or sold years ago, and analyze product performance.”
—Deepak Mehrotra, Co-founder and Chief Adventurer, California Design Den
Merging visuals with data
Before Google Cloud Platform, team members had to dig through spreadsheets and run scenarios to get a sense of how particular products had sold. The next step was to perform keyword searches across the company’s photo library in the cloud to find each product’s image. From there, a team member would insert the product images into a presentation, along with relevant data points, to provide a report for stakeholders on how particular styles performed.
Today, California Design Den, with the help of Pluto7, is integrating its entire product image library with its database on Google Cloud Platform. Experimenting with Google Cloud Vision and Google Cloud AutoML, California Design Den is moving towards a day when team members can run sales scenarios and get deep background data on individual product performance while viewing images of the relevant products.
Merging product visuals with data will help designers and team members better understand sales patterns over time and in context. In the past, making correlations between things like which sheet colors sold well in California, compared to how the same sheet colors performed on the East Coast, was something that California Design Den employees primarily did in their heads.
“When experienced employees leave, their knowledge goes with them,” says Manjunath Devadas, Founder and CEO at Pluto7. “By having all data in one place, and with machine learning and AI, California Design Den can go back in its history, look at products made or sold years ago, and analyze product performance.”
“We are literally growing the complexity of our business on all levels, including designing, manufacturing, selling, reordering, inventory holding—everything.”
—Deepak Mehrotra, Co-founder and Chief Adventurer, California Design Den
Reimagining supply-demand balancing
Pluto7’s mission statement is to democratize supply demand balancing with machine learning and AI. California Design Den is a case in point, as the combination of Planning In A Box and Google Cloud Platform gives the company greater control over its destiny.
“Big retailers used to tell us what to manufacture and how much they would pay for it,” says Deepak. “That was our primary business, and if we didn’t accept the terms, a competitor would.” Today, in addition to continuing to make products for retailers, California Design Den can design, make, and sell a variety of designs for itself, including custom and limited-edition products, thanks to Google Cloud Platform and Pluto7 software offerings. The payoff is not only in having a more diversified business. California Design Den also receives more favorable profit margins by selling its own products.
“We are literally growing the complexity of our business on all levels, including designing, manufacturing, selling, reordering, inventory holding—everything,” Deepak says. “We can make smaller batches. We can connect directly with consumers. We can identify the missing pieces—what should we produce next, when, and how much? We otherwise couldn’t afford the level of talent it would take to do this.”
Cutting through the noise
Google and Pluto7 software helped California Design Den reduce inventory carryovers by more than 50%. Inventory tracking and distribution, along with insights and visibility into product sales, are faster, more efficient, and accurate. Google Cloud Platform flexible pricing, speed, reliability, security, and scalability enable California Design Den to stay relevant and be more competitive.
In addition to benefiting from Google Cloud Platform, California Design Den relies on G Suite—also part of Google Cloud—to enhance collaboration among its global teams. Previously, the company’s email server would sometimes crash, due to the heavy load of sharing product photos and other data. “Gmail and Google Drive handle the everyday demands on the business effortlessly and reliably,” Deepak says.
“Google machine learning and AI enable us to cut through all the noise from raw data, so we can see what’s important. We can focus on analytics to guide us to success today and in the future.”
—Deepak Mehrotra, Co-founder and Chief Adventurer, California Design Den
The company is exploring additional ways to leverage Google Cloud Platform in the near future. For example, one possibility is to import customer reviews from sites where products are sold into Google BigQuery, and to use that data to perform sentiment analysis via Google Cloud Natural Language. It could provide another valuable data source to help California Design Den’s team decide where to focus future designs.
“Google machine learning and AI enable us to cut through all the noise from raw data, so we can see what’s important,” Deepak says. “We can focus on analytics to guide us to success today and in the future.”
2844
Of your peers have already watched this video.
31:00 Minutes
The most insightful time you'll spend today!
Tools to Simplify Streaming Analytics
Streaming analytics is transforming how companies interact with their customers and operate with agility.
Dataflow supports a number of features to guide you through your journey to adopt streaming, including notebooks for writing your first pipeline, SQL to accelerate your streaming deployments, Flex Templates to scale streaming in your organization, and enhanced monitoring for operating your pipelines at scale.
In this video Mehran Nazir, Product Manager, Google Cloud, introduces Beam and Dataflow, and other tools, and how to start, how to scale and how to optimize. See how these capabilities can set you up for streaming success.
More Relevant Stories for Your Company

Sainsbury’s Uses AI to Figure Out How the World Eats
Retail will forever be an industry that must constantly reinvent itself in response to, and anticipation of, ever-changing consumer demands. Digital transformation is fueling these changes and we've previously spoken about how businesses including Ulta Beauty and Kohl’s are taking advantage of Google Cloud to put data at the center of what they do

World’s Largest Online-only Grocery Retailer Uses AI to Figure Which Customers Need Most Attention
In the United Kingdom, the popularity of online grocery shopping is expected to surge from about 6% of the market today to 9% by 2021, according to market research firm Mintel. One of the pioneers of online-only grocery retailing is Ocado, based in Hatfield, Hertfordshire in the U.K. Since starting commercial deliveries

Bit Capital Rolls Out a Digital Financial Solution in Under 3 Months and at 2/3 the Cost
In the past few years, a series of new technologies and regulatory changes has been transforming Brazil’s financial industry. The concept of blockchain added security and agility to financial transactions. The open banking system being deployed by the country’s Central Bank (BC) allows for platform integration and data sharing -with
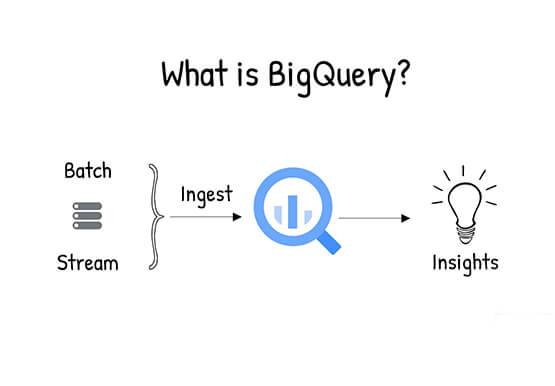

What is BigQuery?
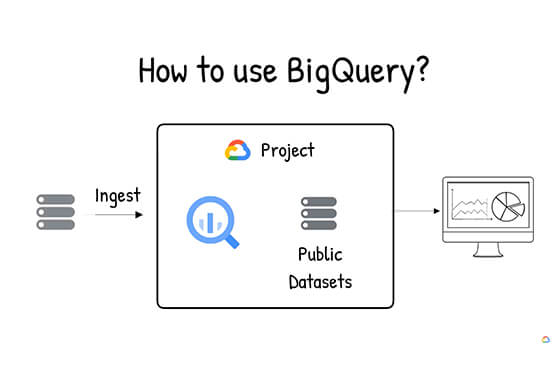
BigQuery is Google Cloud's enterprise data warehouse designed to help you ingest, store, analyze, and visualize big data with ease. Organizations rely on data warehouses to aggregate data from disparate sources, process it, and make it readily available for data analysis that supports their strategic decision-making. You can ingest data
