





3078
Of your peers have already watched this video.
26:00 Minutes
The most insightful time you'll spend today!
Measuring and Improving Speech-to-Text Accuracy
Google Cloud’s Speech-to-Text API has a large number of uses including making customer service teams more effective and increasing their ability to improve customer experience.
Google Cloud’s Speech-to-Text API provides incredible accuracy out of the box. What many might not know is that it also has new tools for enhancing accuracy and customizing the model for your industry, domain, or use case.
In this video, Calum Barnes, Product Manager, Google Cloud, offers an overview of Google Cloud’s Speech-to-Text abilities, then he talks about how you can measure the accuracy of speech to text on your own data. He also discusses what you can do using Google Cloud tools to improve your Speech-to-Text accuracy levels.
Come learn how Google measures accuracy and how you can use its tools to customize your model and improve accuracy. Barnes will walk you through the basic concepts and introduce a lab that you can complete later on your time.
Largest Beauty Retailer in the US Powers Digital Transformation with Google Cloud Smart Analytics

9278
Of your peers have already read this article.
3:15 Minutes
The most insightful time you'll spend today!
Digital technology offers increasing flexibility and choice to consumers. As a result, the retail industry is dramatically shifting toward more tailored and personalized experiences for shoppers, and businesses are rethinking how they deliver value to customers.
This couldn’t be more true for the beauty retailing industry where leading companies are turning to digital technology to create customized shopping experiences.
At Google Cloud, we’re particularly excited about our work with Ulta Beauty, the largest beauty retailer in the United States with more than 1196 stores in all 50 states, and how the company is using Google Cloud technology solutions to power personalization and redefine beauty retailing.
Established in 1990, Ulta Beauty has had incredible success as a company, and as customers become more discerning and curious about their purchases, the company is finding new ways to meet their changing needs.
Recently, leaders at Ulta Beauty recognized a huge opportunity to complement and enhance the shopping experience by helping beauty enthusiasts navigate through more than 500 brands and 25,000 products carried in their stores and online channel.
They decided to leverage the data from Ulta Beauty’s successful Ultamate Rewards loyalty program to create and offer more unique and personalized user experiences.
With more than 30 million members generating data through sales, transactions, product reviews, and social media engagement, Ulta Beauty’s Loyalty Program creates a comprehensive data set, and the company sought the right technology partner to help organize, analyze and transform that data into valuable insights for its customers.
Ulta Beauty’s leaders knew they had an opportunity to leverage data analytics and machine learning to reach customers in new ways, enhance the guest experience, and continue to grow their active loyalty member base. After considering a number of cloud providers, they chose to expand their existing partnership with Google Cloud.
“Google Cloud listened to our needs and worked in tandem with our engineering team to address our challenges,” said Michelle Pacynski, vice president of digital innovation at Ulta Beauty. “The ease of working with the Google Cloud team and their breadth of experience made the decision a no-brainer, laying the foundation for a great partnership.”
In 2019, Ulta Beauty announced it was working with Google Cloud Platform to unify and organize its data, using:
- BigQuery to perform data analysis and generate dynamic content, personalized product recommendations, and event-based messages for customers.
- Cloud Storage to provide highly available, secure, resilient and cost-effective access to data across the entire enterprise.
- Compute Engine for the high-performance scalability needed to grow with customer demand while painlessly migrating existing applications to the cloud.
- Anthos to build a hybrid cloud foundation that allows their applications to take advantage of all this data, combining the power and flexibility of GKE with the ability to leverage their existing investment in secure infrastructure on-premises.
Our partnership with Ulta Beauty has enabled increased engagement with customers in store and online, and the creation of new tools and capabilities, including a new Virtual Beauty Advisor tool to deliver tailored recommendations and help shoppers choose the right products, and a Customer Conversation Platform that’s enabling deeper connections with guests, ultimately driving customer loyalty.
“It’s been a really efficient process so far due in part to the ease of working with the Google team,” said Michelle Pacynski, vice president of digital innovation at Ulta Beauty. “They’re experienced, approachable, and their can-do style makes for a great partnership. They listened to our needs and worked in tandem with our engineering team, figuring things out, and getting it done.”
Southwire Completes SAP Migration to Google Cloud as a First Step of its Tech Evolution

4948
Of your peers have already read this article.
1:30 Minutes
The most insightful time you'll spend today!
“Talk about tough times, right?”
That’s how Dan Stuart, Senior Vice President of IT Services at Southwire Company, refers to the months following a December 2019 ransomware event, and the COVID crisis that began in spring of 2020. Those events hit just as the company was preparing for an overhaul of their SAP environment. This comprehensive plan included three key elements. First, the company wanted to upgrade their SAP ECC environment to take advantage of the latest functionality available for this critical ERP system. Second, Southwire aimed to deploy SAP Business Warehouse on SAP HANA to accelerate vital reporting for all business users. Third, the company wanted to upgrade to the latest version of SAP Process Orchestration—an essential component that touches key manufacturing interfaces in all Southwire facilities.
Southwire had looked at multiple options for the upgrades, including remaining entirely on-premises, colocation, and full cloud migration. “Going to the cloud seemed a lot more compelling,” says Joe Schleupner, Southwire’s Senior Director of PMO & ITS planning and implementation. “We were going to the cloud eventually, so why take these intermediary steps? Let’s just get it done.”
After looking at several options, Southwire decided to migrate to Google Cloud. “We wanted to be on a platform for SAP that was flexible, scalable, and secure; that we could count on to get up and running quickly,” says Stuart. “We chose Google Cloud not only for those reasons, but also because we recognize that Google has other assets that we may be able to take advantage of down the line, such as technologies like artificial intelligence (AI).”
More stability, less worry
As one of the leading manufacturers of wire and cable used in the transmission and distribution of electricity, Southwire aids the delivery of power to millions of people worldwide. They have more than 30 manufacturing facilities across the United States running 24/7. Any downtime directly affects productivity and revenue. With help from Google Cloud and their implementation partner NIMBL, Southwire completed the SAP migration to Google Cloud over a planned maintenance weekend on July 4th.
The migration itself, while complex, went quickly and smoothly. “Just moving to the cloud was quite a feat because we were dealing with so much data, but in total the SAP system was down for only ~16 hours,” says Schleupner.
“As a project manager, I always felt that Google Cloud had my back” Schleupner says. The Process Orchestration (PO) migration was of particular concern, considering that it controlled all of Southwire’s manufacturing interfaces across the entire company. “Every critical piece of information that goes from SAP down to the manufacturing system goes through that system,” says Schleupner.
Even after migrating, Southwire discovered that making changes to the system was fast, easy, and resulted in no downtime. Normally, certain types of changes would have involved taking down SAP for at least an hour.
The Southwire team also appreciates the fact that the modern cloud architecture means spending less time on routine infrastructure maintenance. “It’s one less thing for me to worry about,” Stuart says, “I can focus on the business side of the house and move the technology and responsibilities to what we do within the Google Cloud Platform.”
What comes next?
While the cloud migration will increase stability, uptime, performance, and security, there is much more to come. Southwire is currently working on a disaster recovery implementation for their SAP environment on Google Cloud. Stuart and Schleupner are excited about where Google Cloud can further take Southwire. They are considering an SAP Hybris e-commerce implementation as well as connected factory and/or factory automation initiatives that can take advantage of artificial intelligence and machine learning.
To Stuart and Schleupner, the migration of Southwire’s SAP environment to Google Cloud, as important as it was, really represents the first step in the company’s tech evolution. Now that much of the heavy lifting is complete, Southwire’s digital transformation can begin in earnest. “There’s no shortage of areas where I think Google Cloud will come into play,” Stuart says, “and we intend to look at these things with an open mind to understand how we can leverage current investments to take our organization where we want to go.”
Learn more about Southwire’s SAP on Google Cloud deployment and how Google Cloud can transform the way you work with your SAP enterprise applications. Visit cloud.google.com/solutions/sap.
Leverage ML to Spot Anomalies in Real-time Forex Data

3110
Of your peers have already read this article.
6:00 Minutes
The most insightful time you'll spend today!
Let’s say you are a quantitative trader with access to real-time foreign exchange (forex) price data from your favorite market data provider. Perhaps you have a data partner subscription, or you’re using a synthetic data generator to prove value first. You know there must be thousands of other quants out there with your same goal. How will you differentiate your anomaly detector?
What if, instead of training an anomaly detector on raw forex price data, you detected anomalies in an indicator that already provides generally agreed buy and sell signals? Relative Strength Index (RSI) is one such indicator; it is often said that RSI going above 70 is a sell signal, and RSI going below 30 is a buy signal. As this is just a simplified rule, it means there could be times when the signal is inaccurate, such as a currency market correction, making it a prime opportunity for an anomaly detector.
This gives us the following high level components:

Of course, we want each of these components to handle data in real time, and scale elastically as needed. Dataflow pipelines and Pub/Sub are the perfect services for this. All we need to do is write our components on top of the Apache Beam sdk, and they’ll have the benefit of distributed, resilient and scalable compute.
Luckily for us, there are some great existing Google plugins for Apache Beam. Namely, a Dataflow time-series sample library that includes RSI calculations, and a lot of other useful time series metrics; and a connector for using AI Platform or Vertex AI inference within a Dataflow pipeline. Let’s update our diagram to match, where the solid arrows represent Pub/Sub topics.
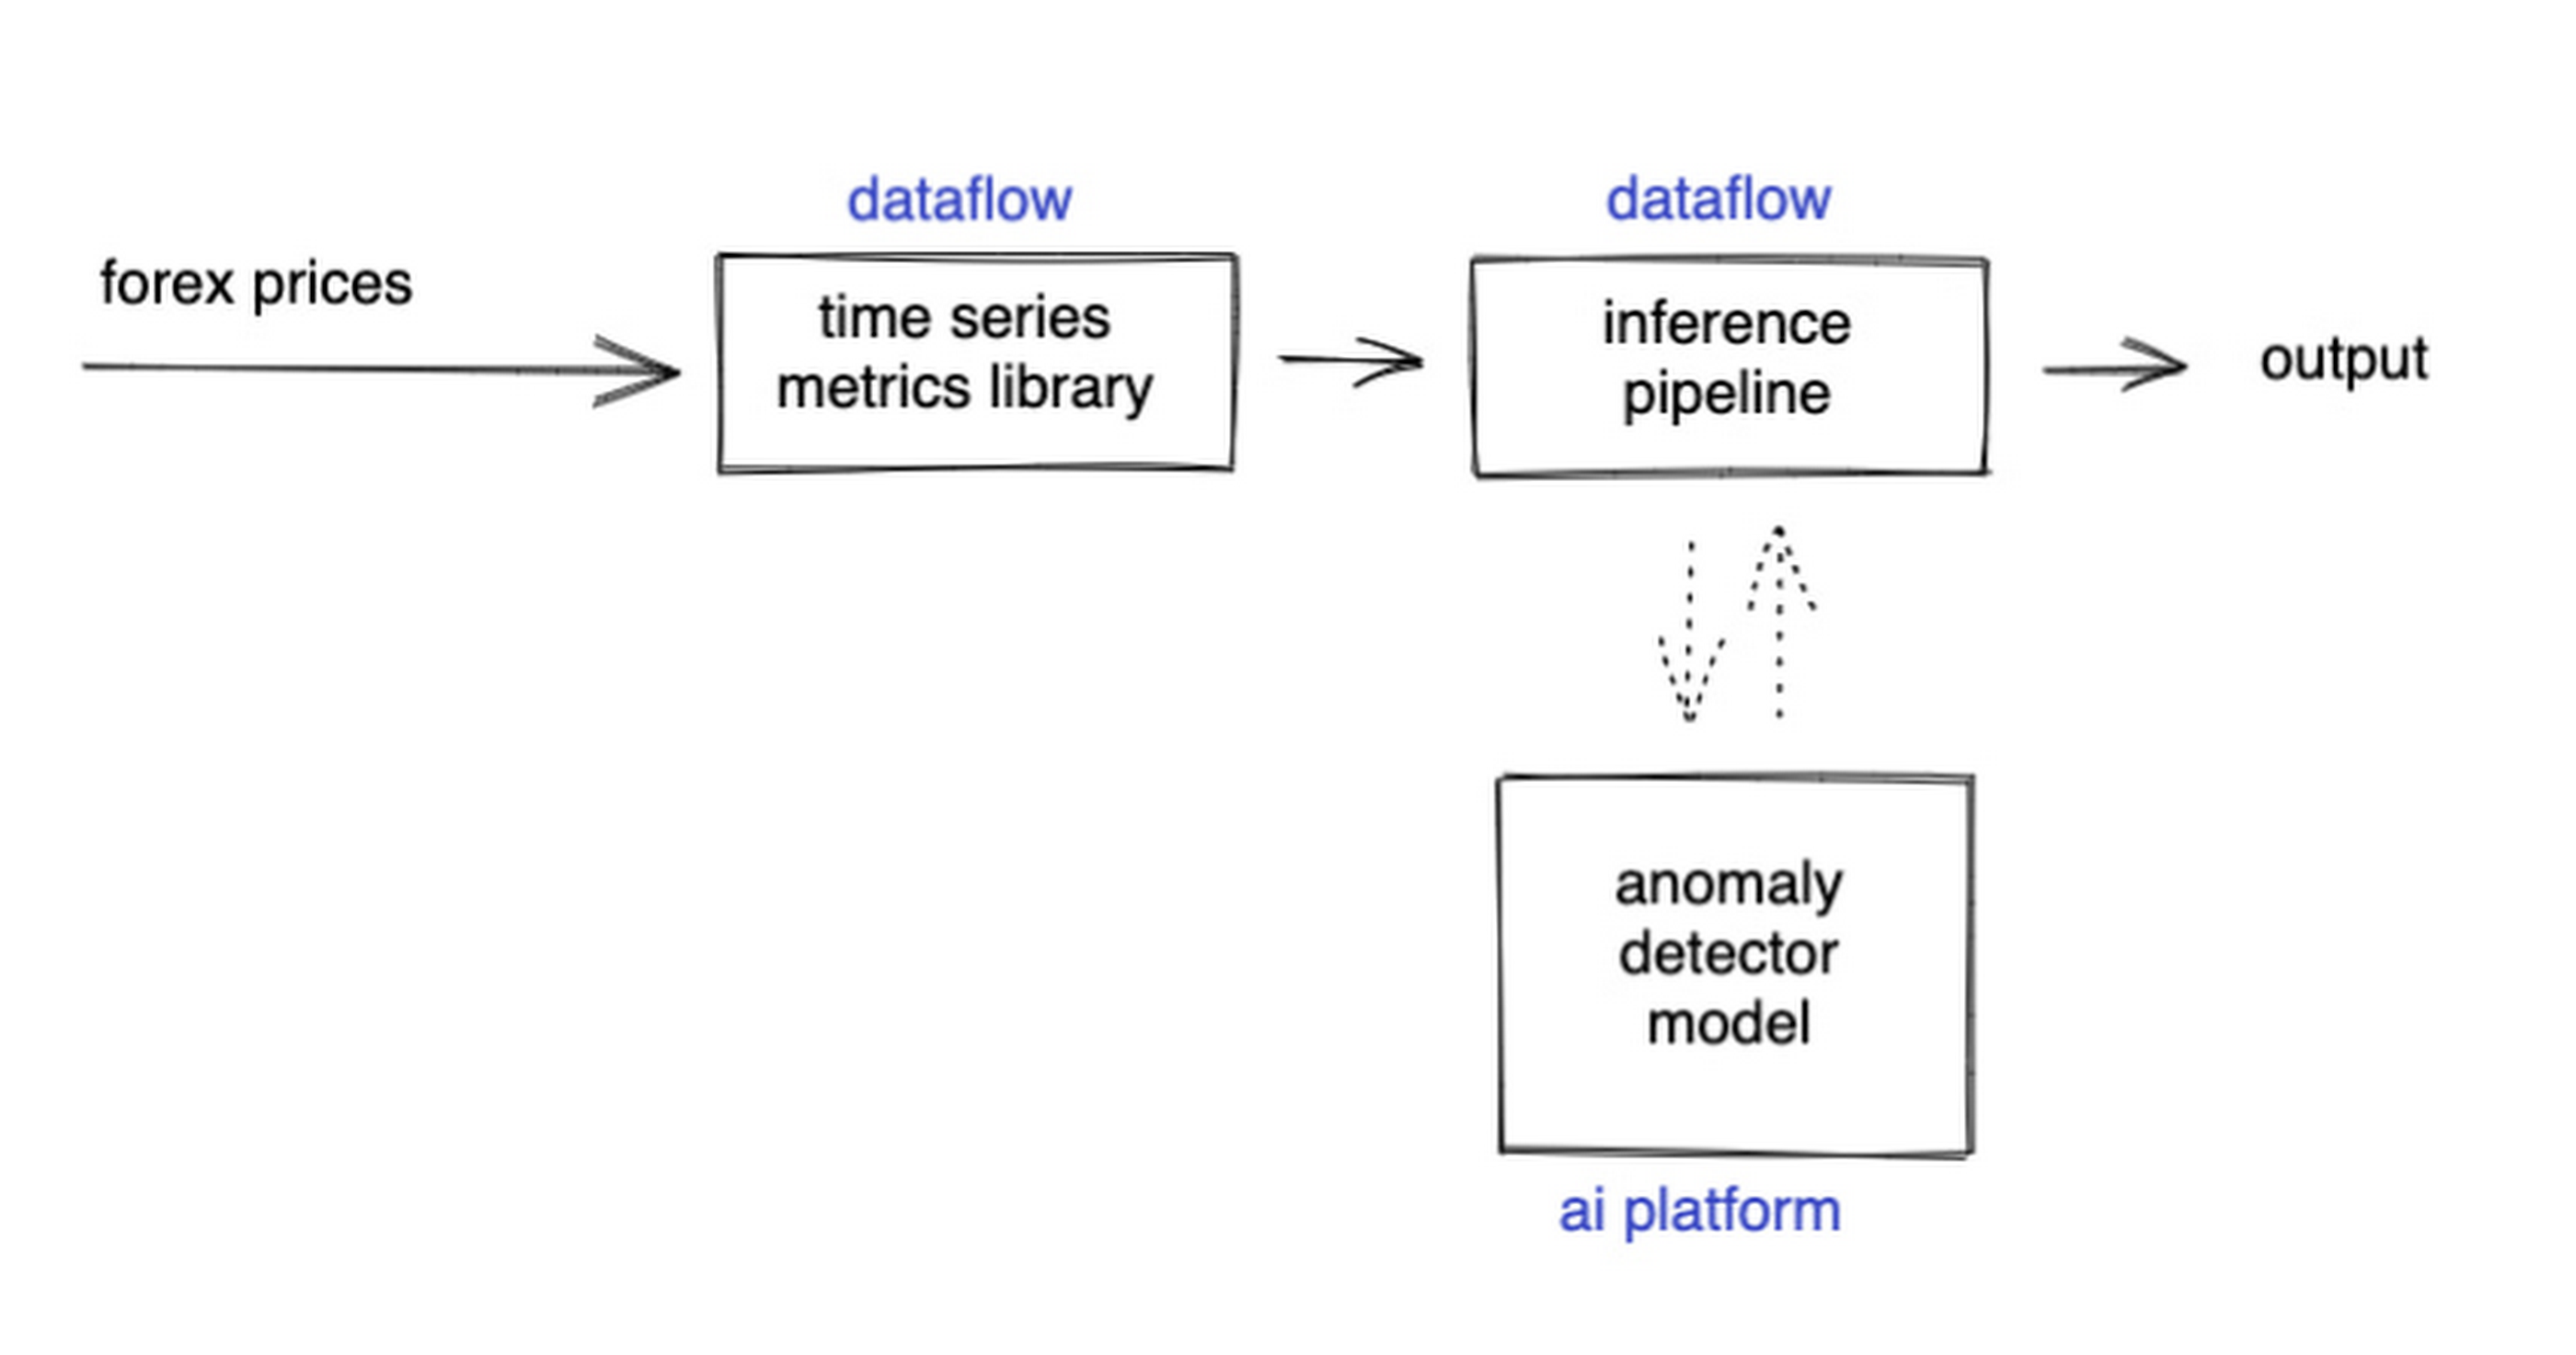
The Dataflow time-series sample library also provides us with gap-filling capabilities, which means we can rely on having contiguous data once the flow reaches our machine learning (ML) model. This lets us implement quite complex ML models, and means we have one less edge case to worry about.
So far we’ve only talked about the real time data flow, but for visualization and continuous retraining of our ML model, we’re going to want historical data as well. Let’s use BigQuery as our data warehouse, and Dataflow to plumb Pub/Sub into it. As this plumbing job is embarrassingly parallelizable, we wrote our pipeline to be generic across data types and share the same Dataflow job, such that compute resources can be shared. This results in efficiencies of scale both in cost savings and time required to scale-up.

Data Modeling
Let’s discuss data formats a bit further here. An important aspect of running any data engineering project at scale is flexibility, interoperability and ease of debugging. As such, we opted to use flat JSON structures for each of our data types, because they are human readable and ubiquitously understood by tooling. As BigQuery understands them too, it’s easy to jump into the BigQuery console and confirm each component of the project is working as expected.
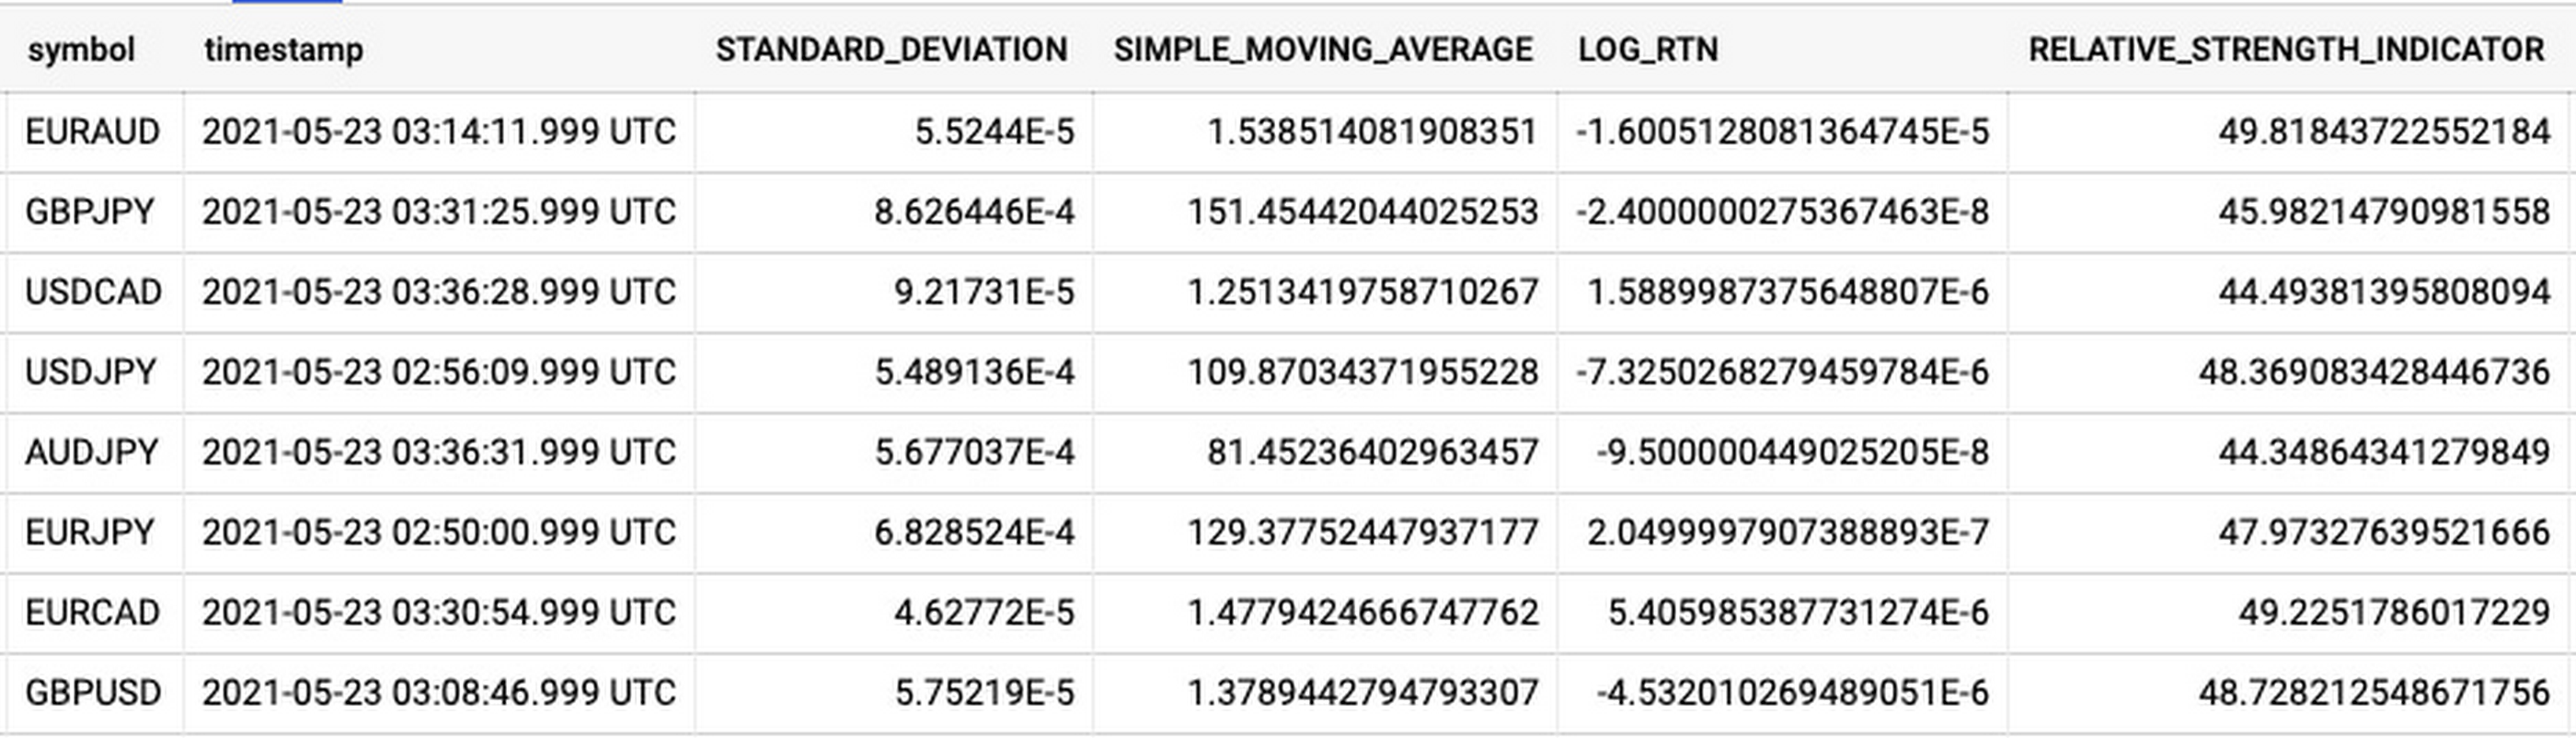
As you can see, the Dataflow sample library is able to generate many more metrics than RSI. It supports generating two types of metrics across time series windows, metrics which can be calculated on unordered windows, and metrics which require ordered windows, which the library refers to as Type 1 metrics and Type 2 metrics, respectively. Unordered metrics have a many-to-one relationship, which can help reduce the size of your data by reducing the frequency of points through time. Ordered metrics run on the outputs of the unordered metrics, and help to spread information through the time domain without loss in resolution. Be sure to check out the Dataflow sample library documentation for a comprehensive list of metrics supported out of the box.
As our output is going to be interpreted by our human quant, let’s use the unordered metrics to reduce the time resolution of our flow of real time data to one per second, or one hertz. If our output was being passed into an automated trading algorithm, we might choose a higher frequency. The decision for the size of our ordered metrics window is a little more difficult, but broadly determines the amount of time-steps our ML model will have for context, and therefore the window of time for which our anomaly detection will be relevant. We at least need it to be larger than our end-to-end latency, to ensure our quant will have time to act. Let’s set it to five minutes.
Data Visualization
Before we dive into our ML model, let’s work on visualization to give us a more intuitive feel for what’s happening with the metrics, and confirm everything we’ve got so far is working. We use the Grafana helm chart with the BigQuery plugin on a Google Kubernetes Engine (GKE) Autopilot cluster. The visualisation setup is entirely config-driven and provides out-of-the-box scaling, and GKE gives us a place to host some other components later on.
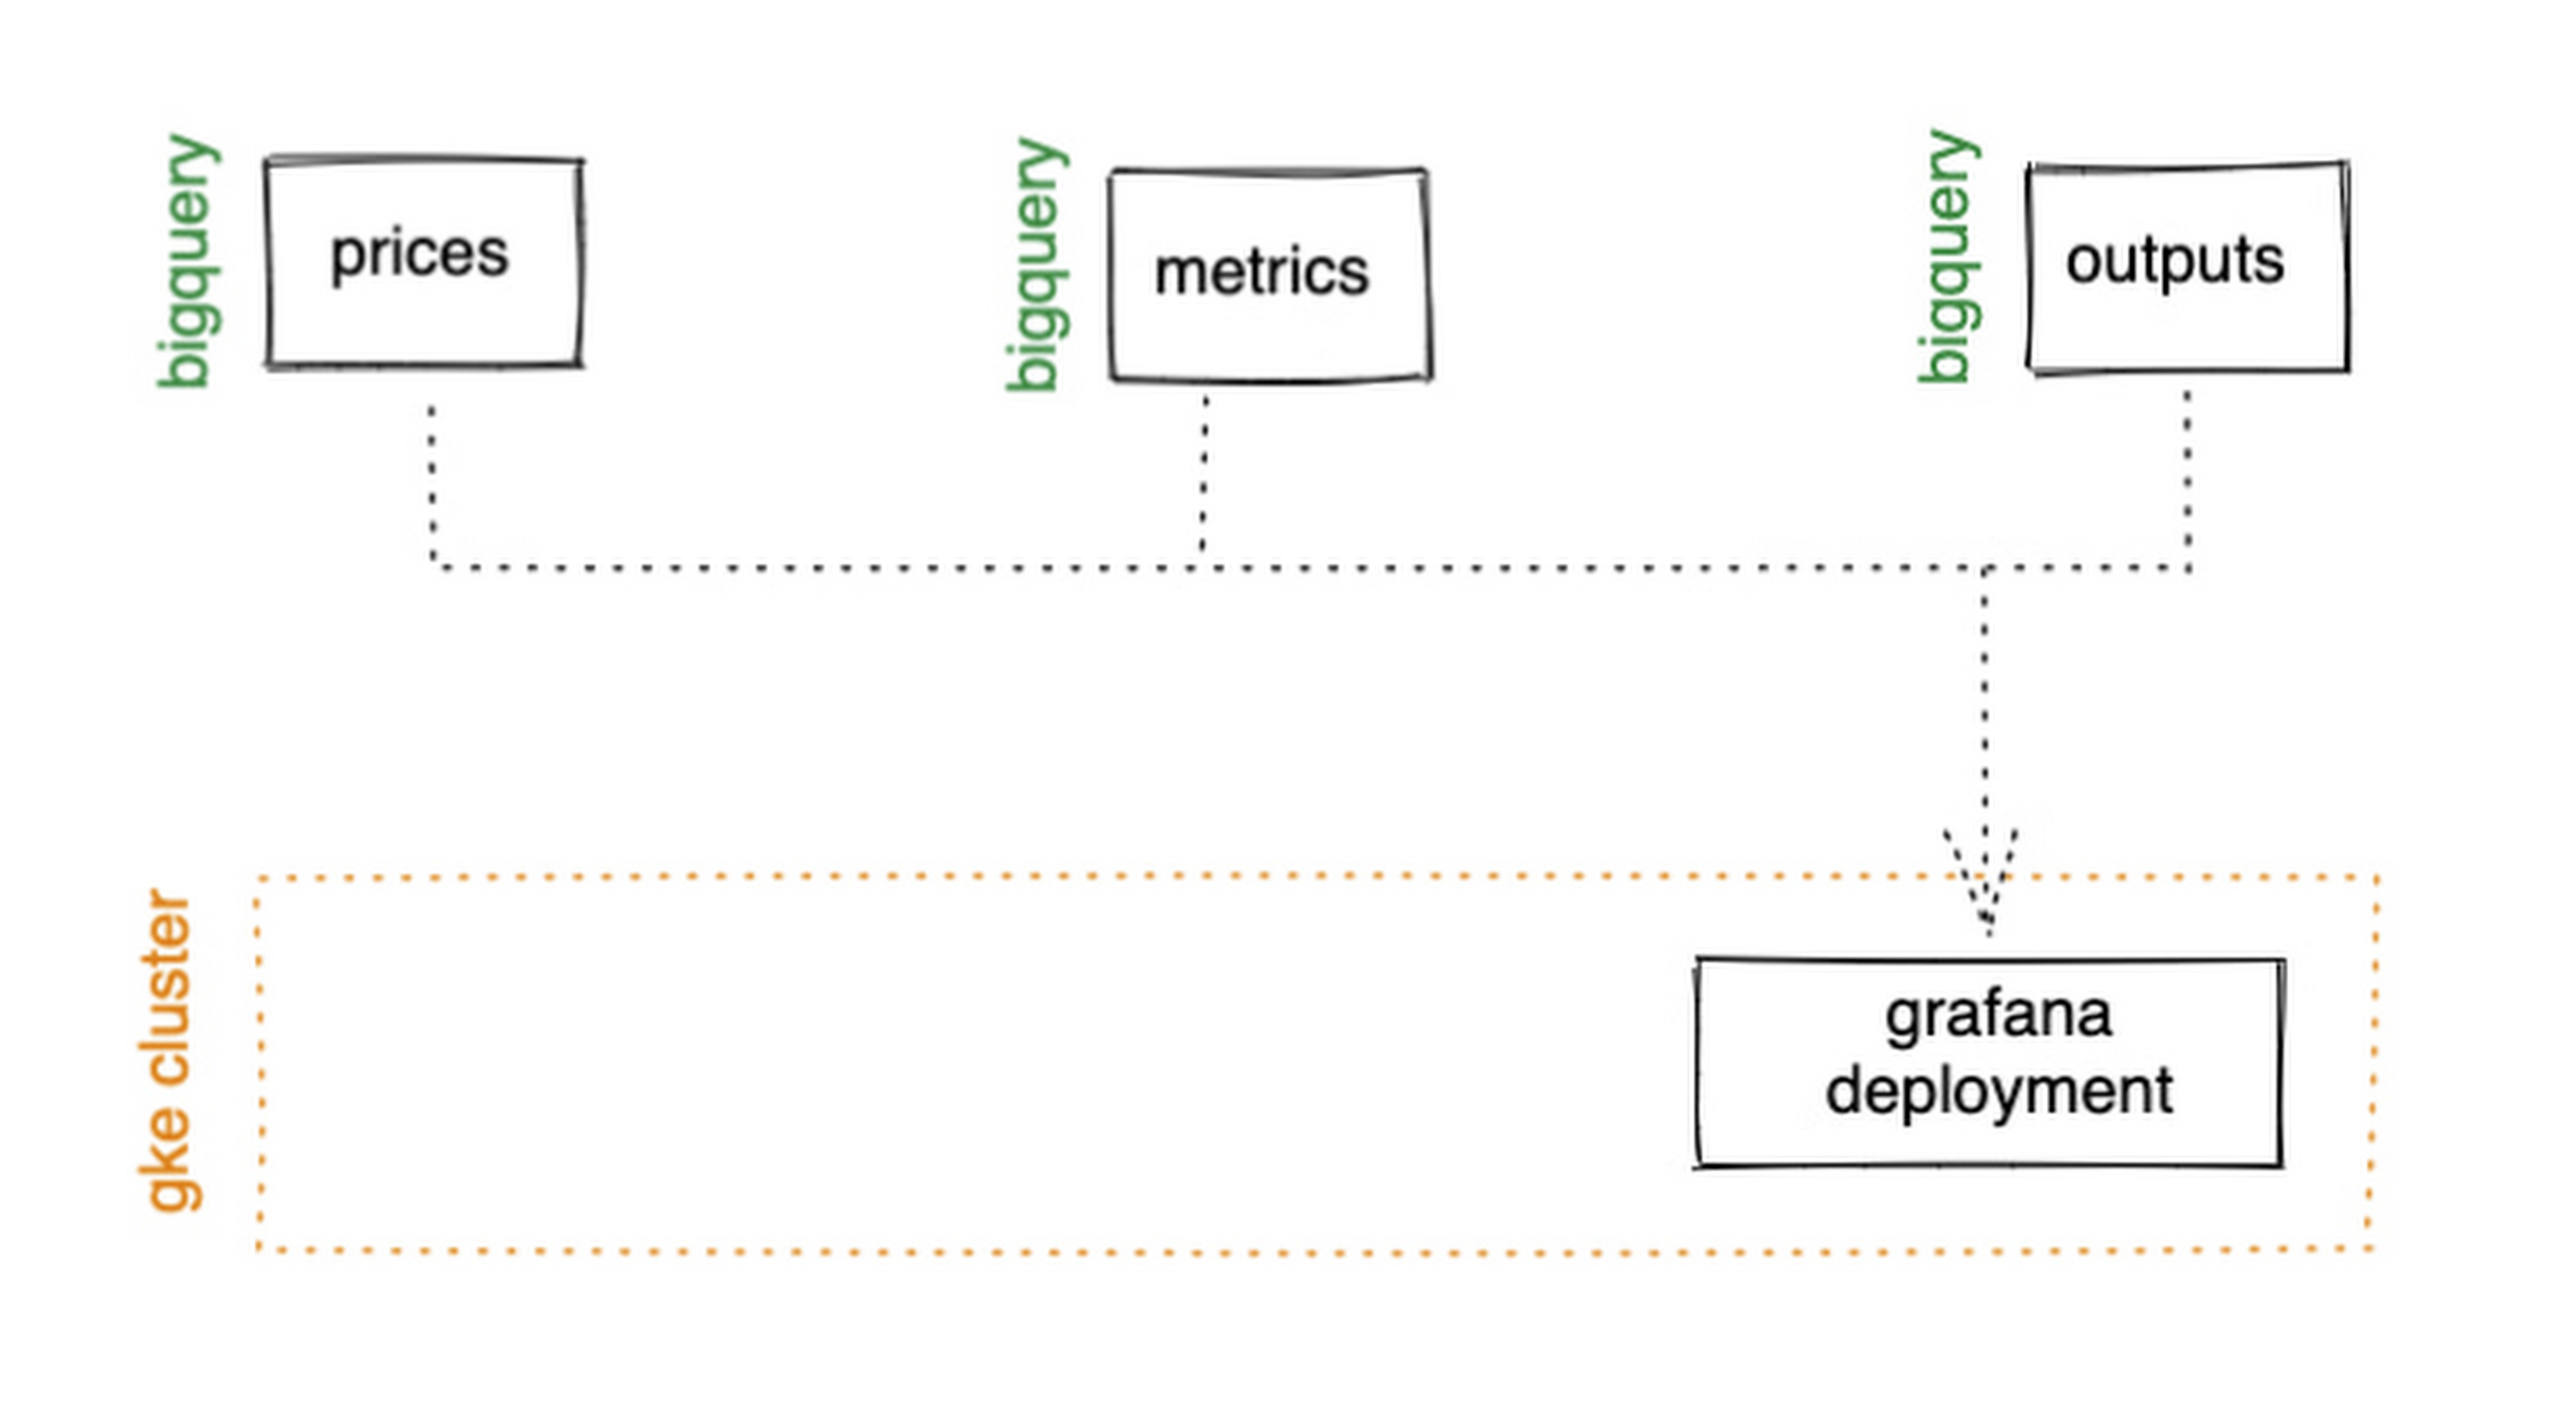
GKE Autopilot has Workload Identity enabled by default, which means we don’t need to worry about passing around secrets for BigQuery access, and can instead just create a GCP service account that has read access to BigQuery and assign it to our deployment through the linked Kubernetes service account.
That’s it! We can now create some panels in a Grafana dashboard and see the gap filling and metrics working in real time.

Building and deploying the Machine Learning Model
Ok, ML time. As we alluded to earlier, we want to continuously retrain our ML model as new data becomes available, to ensure it remains up to date with the current trend of the market. TensorFlow Extended (TFX) is a platform for creating end-to-end machine learning pipelines in production, and eases the process around building a reusable training pipeline. It also has extensions for publishing to AI Platform or Vertex AI, and it can use Dataflow runners, which makes it a good fit for our architecture. The TFX pipeline still needs an orchestrator, so we can host that in a Kubernetes job, and if we wrap it in a scheduled job, then our retraining happens on a schedule too!

TFX requires our data be in the tf.Example format. The Dataflow sample library can output tf.Examples directly, but this tightly couples our two pipelines together. If we want to be able to run multiple ML models in parallel, or train new models on existing historical data, we need our pipelines to only be loosely coupled. Another option is to use the default TFX BigQuery adaptor, but this restricts us to each row in BigQuery mapping to exactly one ML sample, meaning we can’t use recurrent networks.
As neither of the out-of-the-box solutions met our requirements, we decided to write a custom TFX component that did what we needed. Our custom TFX BigQuery adaptor enables us to keep our standard JSON data format in BigQuery and train recurrent networks, and it keeps our pipelines loosely coupled! We need the windowing logic to be the same for both training and inference time, so we built our custom TFX component using standard Beam components, such that the same code can be imported in both pipelines.
def window_elements(pipeline: beam.Pipeline,window_length: int,drop_irregular_windows: bool = True,sort_windows_by: str = "timestamp",):"""Window elements into regular windows of a given size.Assumes elements flow at a fixed rate of 1Hz."""def _sort_windows(window: Iterable[Dict[Text, Any]]) -> List[Dict[Text, Any]]:sorted_window = sorted(window, key=lambda e: e[sort_windows_by])return sorted_windowwindowed_elements = (pipeline| "AddConstantKey" >> beam.Map(lambda item: (0, item))| "WithSlidingWindow">> beam.WindowInto(beam.transforms.window.SlidingWindows(window_length, 1),trigger=beam.transforms.trigger.AfterCount(window_length),accumulation_mode=beam.transforms.trigger.AccumulationMode.DISCARDING,)| "CombineWindow" >> beam.GroupByKey()| "GetValues" >> beam.Values())if drop_irregular_windows:windowed_elements = windowed_elements | "EnforceWindowLengths" >> beam.Filter(lambda w: len(w) == window_length).with_output_types(List[Dict[Text, Any]])if sort_windows_by is not None:windowed_elements = windowed_elements | "Sort" >> beam.Map(_sort_windows).with_output_types(List[Dict[Text, Any]])return windowed_elements
With our custom generator done, we can start designing our anomaly detection model. An autoencoder utilising long-short-term-memory (LSTM) is a good fit for our time-series use case. The autoencoder will try to reconstruct the sample input data, and we can then measure how close it gets. That difference is known as the reconstruction error. If there is a large enough error, we call that sample an anomaly. To learn more about autoencoders, please consider reading chapter 14 from Deep Learning by Ian Goodfellow, Yoshua Bengio, and Aaron Courville.
Our model uses simple moving average, exponential moving average, standard deviation, and log returns as input and output features. For both the encoder and decoder subnetworks, we have 2 layers of 30 time step LSTMs, with 32 and 16 neurons, respectively.
In our training pipeline, we include z score scaling as a preprocessing transformer – which is usually a good idea when it comes to ML. However, there’s a nuance to using an autoencoder for anomaly detection. We need not only the output of the model, but also the input, in order to calculate the reconstruction error. We’re able to do this by using model serving functions to ensure our model returns both the output and preprocessed input as part of its response. As TFX has out-of-the-box support for pushing trained models to AI Platform, all we need to do is configure the pusher, and our (re)training component is complete.
Detecting Anomalies in real time
Now that we have our model in Google Cloud AI Platform, we need our inference pipeline to call to it in real time. As our data is using standard JSON, we can easily apply our RSI rule of thumb inline, ensuring our model only runs when needed. Using the reconstructed output from AI Platform, we are then able to calculate the reconstruction error. We choose to stream this directly into Pub/Sub to enable us to dynamically apply an anomaly threshold when visualising, but if you had a static threshold you could apply it here too.
with beam.Pipeline(options=pipeline_options) as pipeline:(pipeline| "ReadFromPubSub">> beam.io.ReadFromPubSub(topic=input_metrics,timestamp_attribute=timestamp_key,)| "DeserialiseJSON" >> beam.Map(pubsub_serialiser.to_json)| "FilterSymbol" >> beam.Filter(lambda m: m["symbol"] == symbol)| "FilterRSIThreshold">> beam.Filter(lambda m: m["RELATIVE_STRENGTH_INDICATOR"] > rsi_upper_thresholdor m["RELATIVE_STRENGTH_INDICATOR"] < rsi_lower_threshold)| "WindowElements" >> window_elements(window_length)| "RunAutoencoder">> run_windowed_inference(gcp_project_id,model_name,window_length,{f: "FLOAT" for f in feature_metrics},)| "CalcReconError" >> beam.Map(calc_reconstruction_err)| "ToJSON">> beam.Map(lambda re: {"symbol": symbol, "reconstruction_error": re})| "SerialiseJSON" >> beam.Map(pubsub_serialiser.from_json)| "WriteToPubSub">> beam.io.WriteToPubSub(topic=output_alerts,timestamp_attribute=timestamp_key,))
Summary
Here’s what the wider architecture looks like now:

More importantly though, does it fit for our use case? We can plot the reconstruction error of our anomaly detector against the standard RSI buy/sell signal, and see when our model is telling us that perhaps we shouldn’t blindly trust our rule of thumb. Go get ‘em, quant!
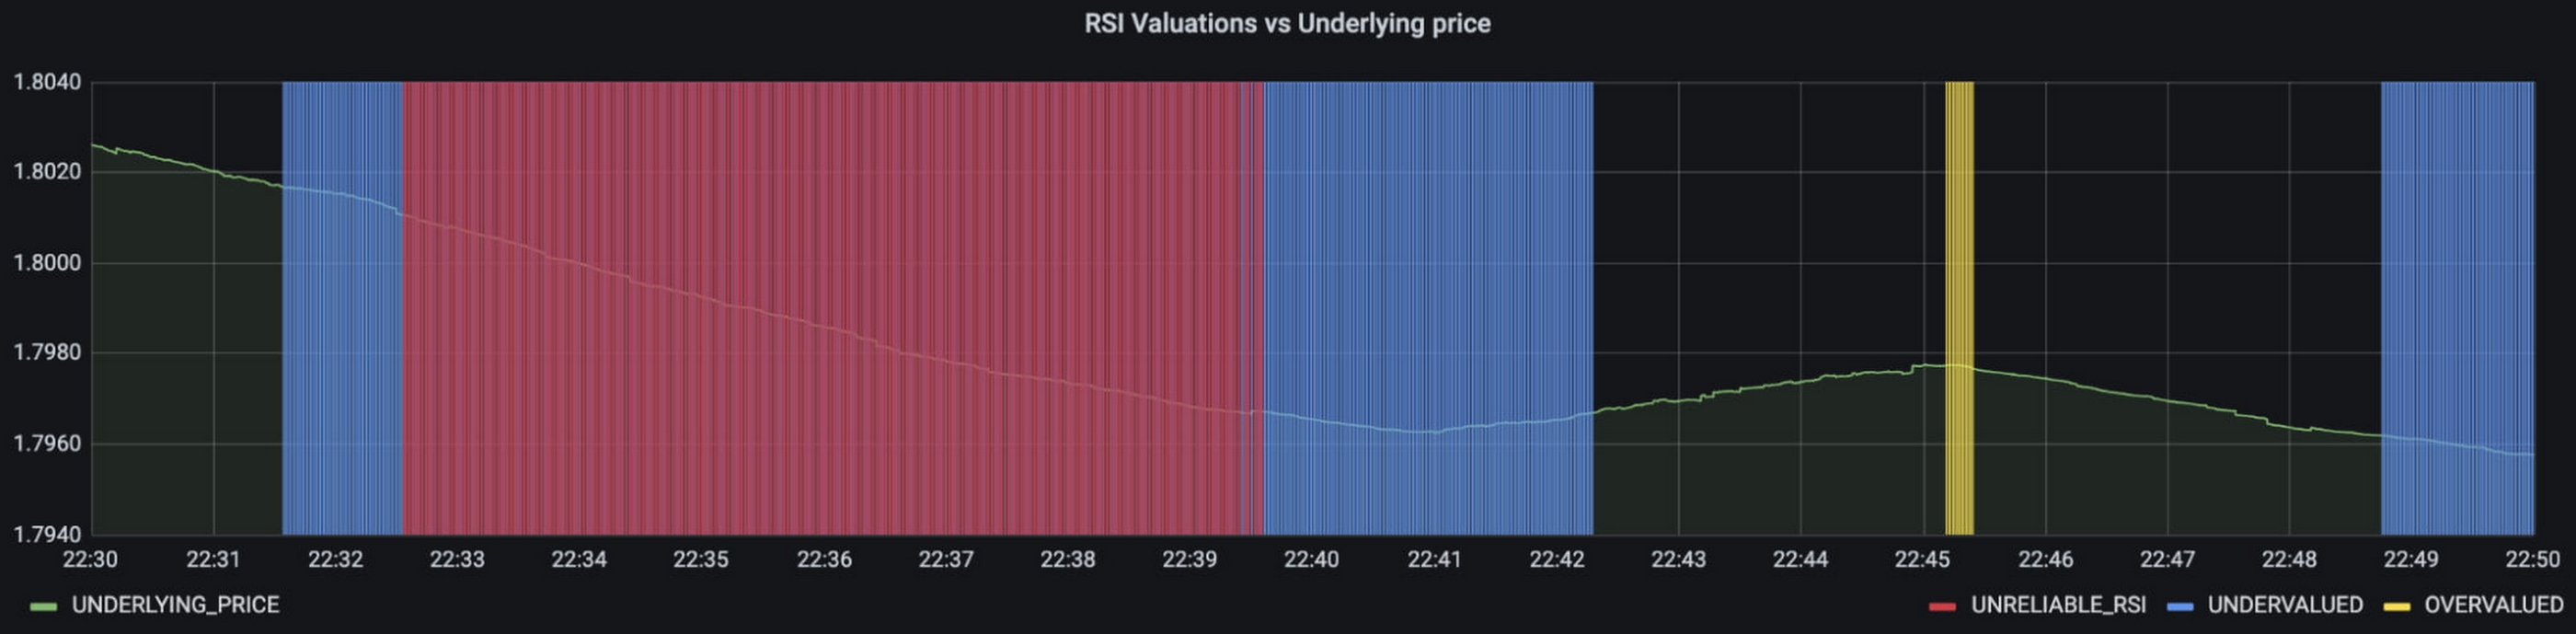
In terms of next steps, there are many things you could do to extend or adapt what we’ve covered. You might want to explore with multi-currency models, where you could detect when the price action of correlated currencies is unexpected, or you could connect all of the Pub/Sub topics to a visualization tool to provide a real-time dashboard.
Give it a try
To finish it all off, and to enable you to clone the repo and set everything up in your own environment, we include a data synthesizer to generate forex data without needing access to a real exchange. As you might have guessed, we host this on our GKE cluster as well. There are a lot of other moving parts – TFX uses a SQL database and all of the application code is packaged into a docker image and deployed along with the infra using Terraform and cloud build. But if you’re interested in those nitty gritty details, head over to the repo and get cloning!
Feel free to reach out to our teams at Google Cloud and Kasna for help in making this pattern work best for your company.
Datashare for Financial Services: Securing the Publishers and Consumers’ Access to Market Data

8599
Of your peers have already read this article.
4:30 Minutes
The most insightful time you'll spend today!
Access to the cloud has advanced the distribution and consumption of financial information on a global scale. In parallel, the global financial data landscape has been transformed by an influx of alternative data sources, including social media, meteorological data, satellite imagery, and other data. Exchanges and market data providers now find they need to include these new datasets to enrich their products and compete, which has meant they now must consider cloud-based models to keep up with the demands of their customers who expect easy, quick, flexible and cost-efficient ways to consume market data.
To address these needs, today we’re announcing the general availability of Datashare for financial services, a new Google Cloud solution that brings together the entire capital markets ecosystem—data publishers, and data consumers—to exchange market data securely and easily.
Datashare helps organize third-party financial information, making it accessible and useful to market data publishers and data consumers. We open-sourced the entire Datashare solution so market data publishers can now onboard their licensed datasets to Google Cloud securely, quickly and easily, while data consumers can consume that data as a service in tools of their preference, such as BigQuery.
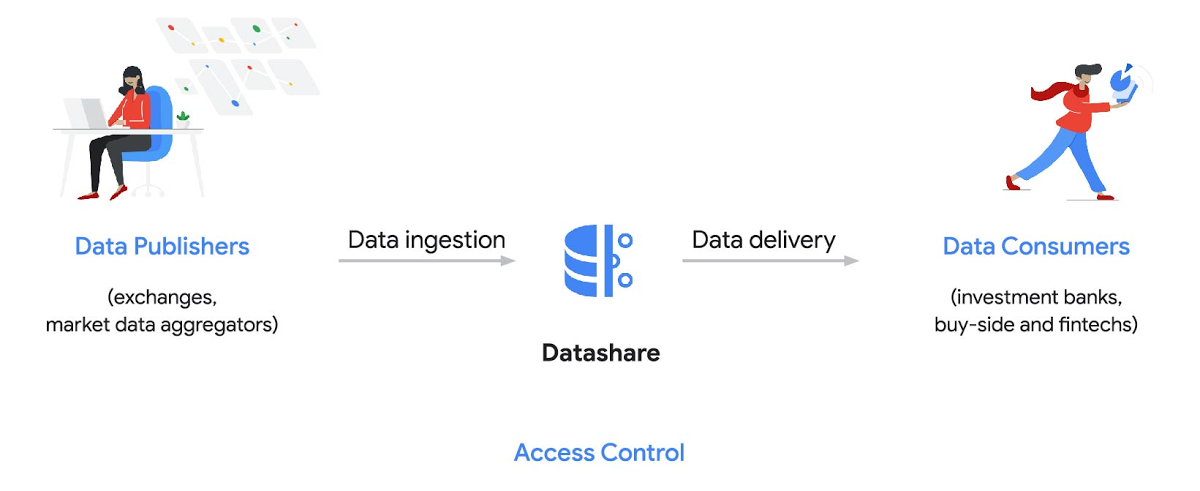
Three ways to distribute and consume your data
Batch data delivery
Datashare provides a batch data delivery mechanism for data publishers to deliver their reference data, historical tick data, alternative market data sources and more via BigQuery, reducing the administrative burden on data consumers to extract insights from data.
Real-time data streaming delivery
By using this event-based data delivery channel for rapidly changing instrument prices, tick data, orders, news and others via Pub/Sub, data consumers can reliably process individual messages or rewind to a point in time to replay a prior market scenario and test model changes.
Monetizing licensed datasets
Market data publishers can onboard their licensed datasets to Google Cloud and make them available via a one-stop-shop on Google Cloud Marketplace, enabling a new sales channel to expand market reach.
Reference architecture
Check out the diagram below to see how you can share your batch and real-time data directly to your Google Cloud customers with BigQuery and Pub/Sub.

As you can see in the above reference architecture, both publishers and consumers can derive several benefits from the solution:
Benefits for data publishers
- You no longer have to maintain your own delivery and licensing infrastructure.
- You can easily package and deliver granular data products and experiments with SQL.
- You can have a solution that scales with your business as data volumes and number of customers grow.
Benefits for data consumers
- Your data is ready for analysis and machine learning (ML)— you no longer have to maintain extract, transform, and load (ETL) pipelines to load files and transform data.
- You can avoid the expense and burden of maintaining multiple copies of large data files.
- You can be more targeted with consumption of data using BigQuery queries, improving performance, and compliance, and reducing cost.
Accessing the datasets
Google Cloud has been working with multiple industry firms on innovating in the market data space. By using Datashare for publishing, data publishers can make their entire datasets available on Google Cloud. Early adopters of Datashare include firms such as OneTick and Accern. OneTick’s datasets include reference and historical futures data (that can be accessed in our console with your login). Accern’s datasets include alternative data such as market sentiment and credit analysis data (that can be accessed in our console with your login).
To make it more helpful, we partnered with Accern to create a hypothetical scenario to describe the data acquisition and analytics process step-by-step.
Accern use case
As a sustainability analyst, you require an economic, social and governance (ESG) dataset to determine which sector is the most widely covered ESG sector by analysts, and to also identify the sector with the lowest ESG sentiment score. Now, you can discover and acquire an ESG dataset in Google Cloud.
Step 1. Navigate to the Financial Services solutions page in the Google Cloud console:

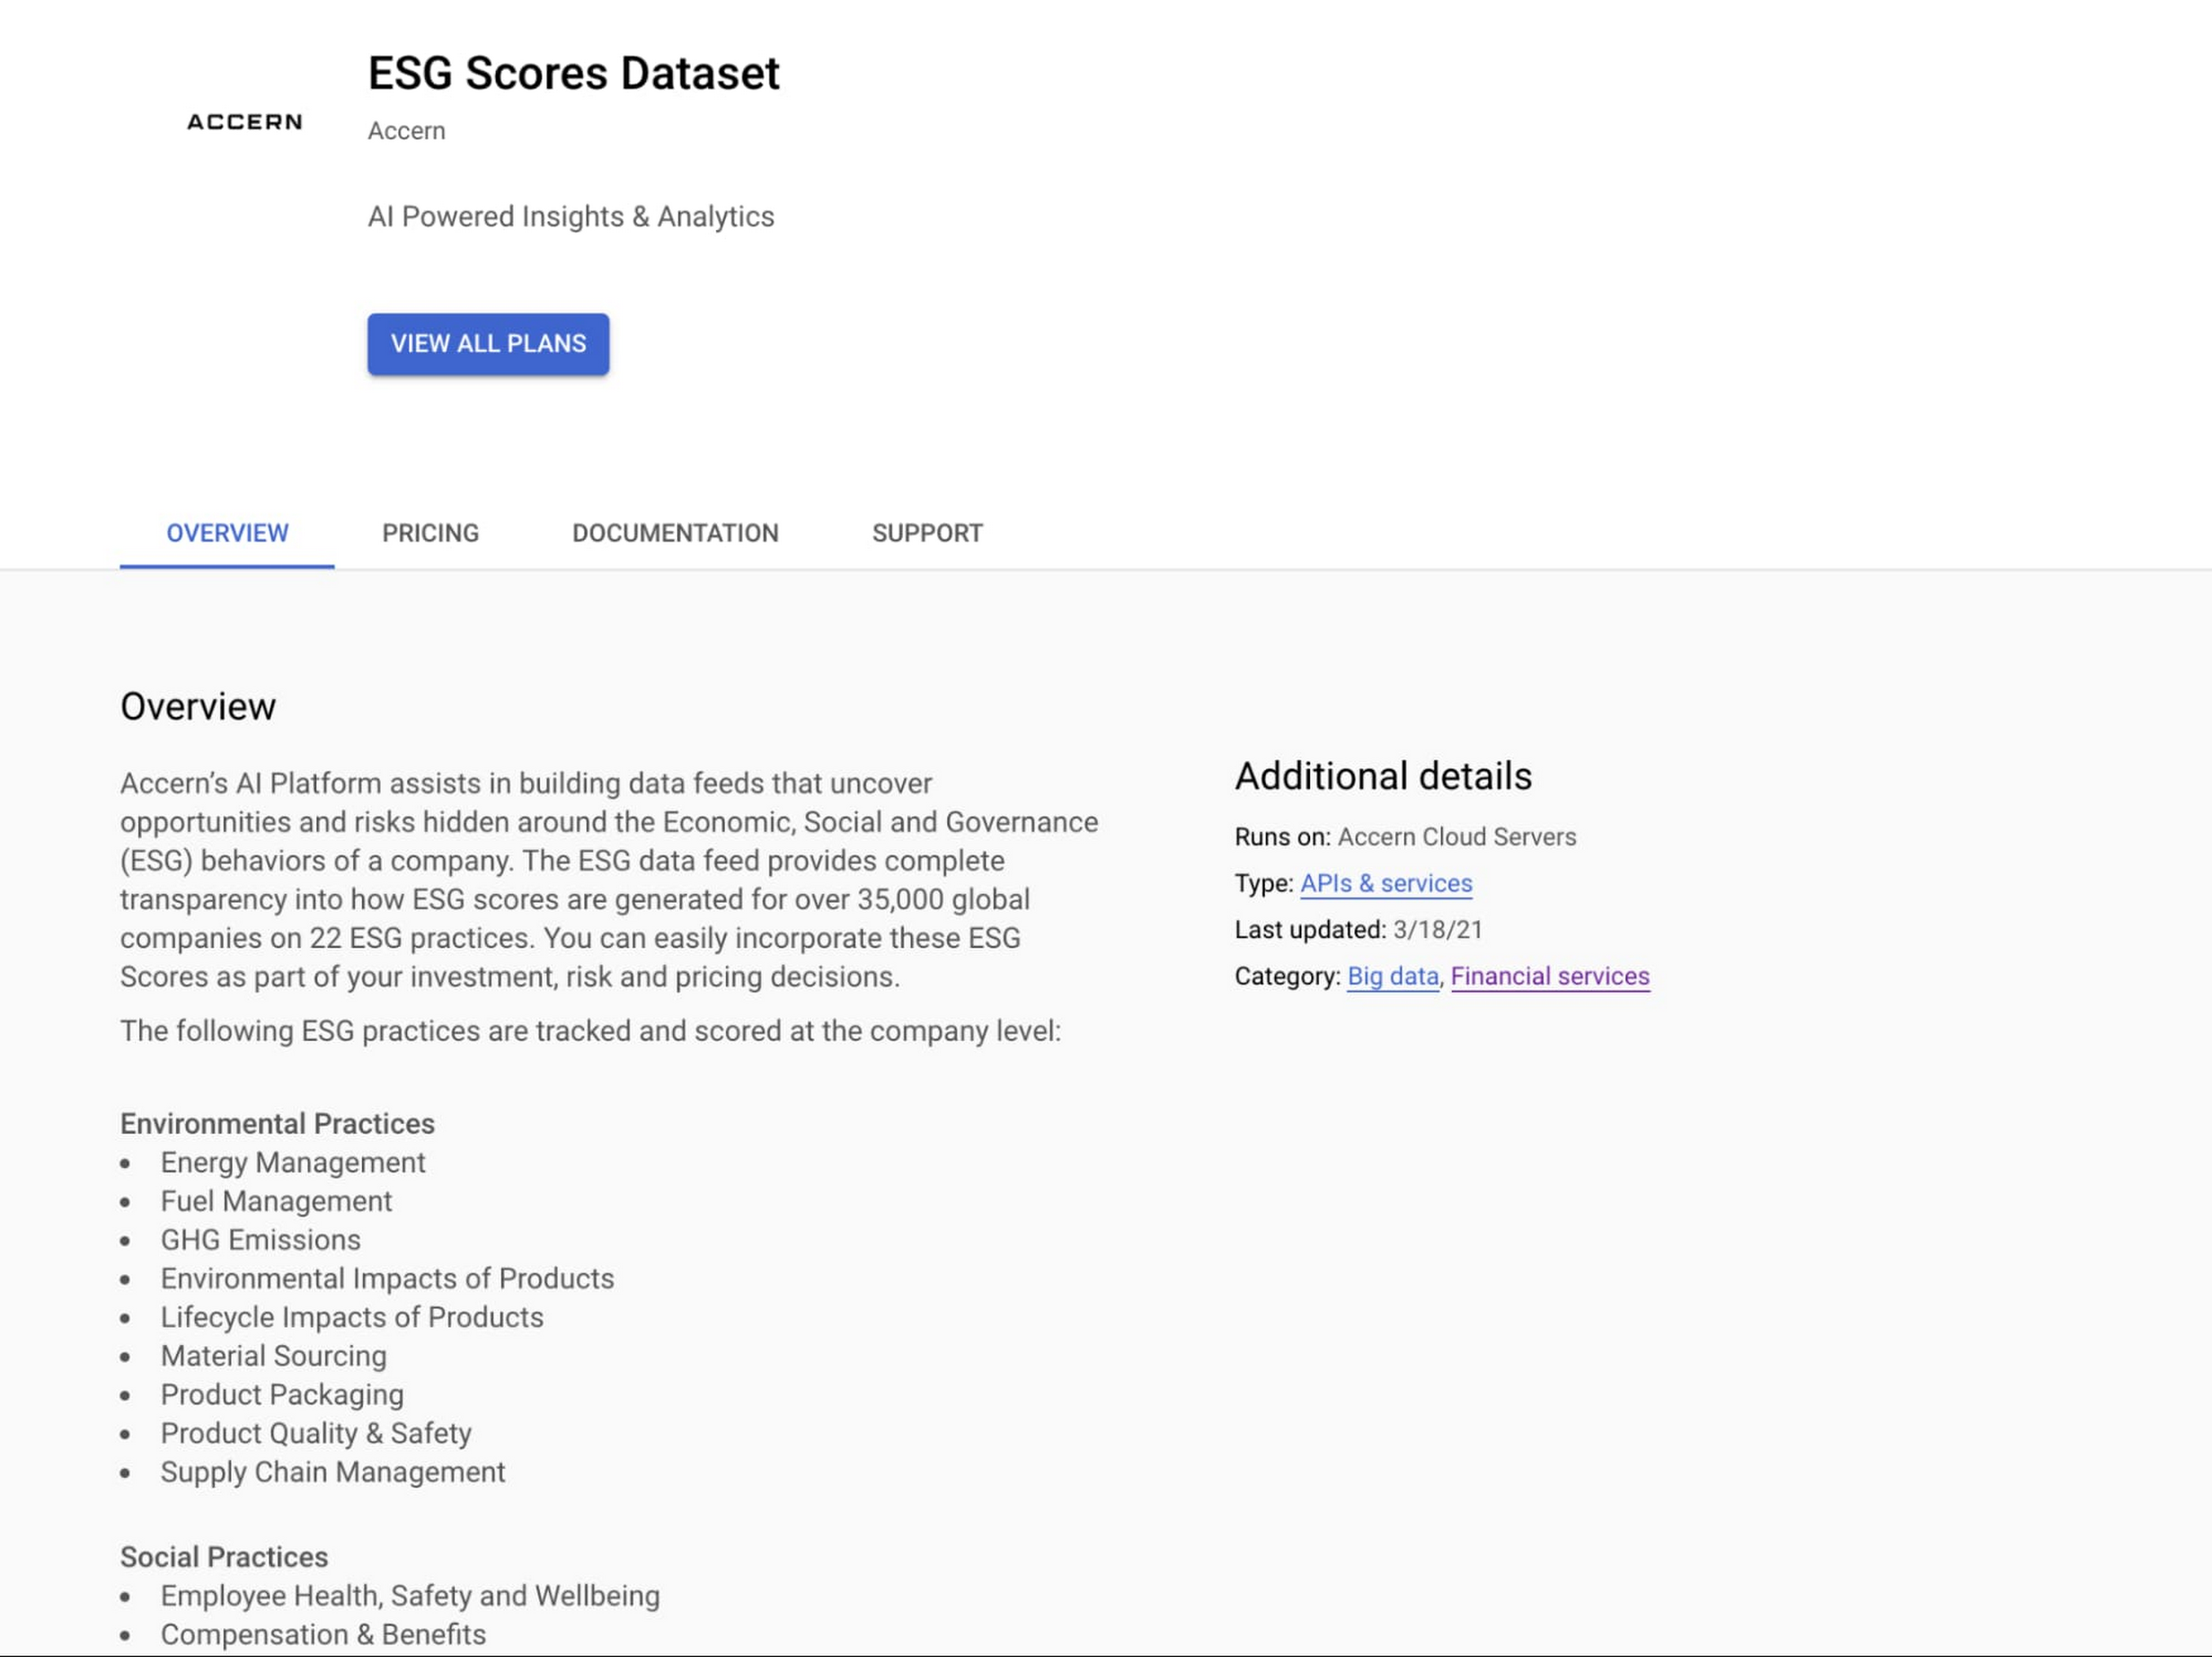
Step 2. Click a dataset, for example Accern AI-Generated ESG Insights, then review the overview details, plans and pricing, documentation and support information. To view the available pricing tiers, click ‘View All Plans’. Once you’ve decided on a tier that you would like to subscribe to, click ‘Select’, choose a billing account and review and accept the terms of service to complete the subscription. Once the steps are complete, click ‘Subscribe’ at the bottom. An overlay window will appear, click ‘Register with Accern’ to activate and complete the subscription.

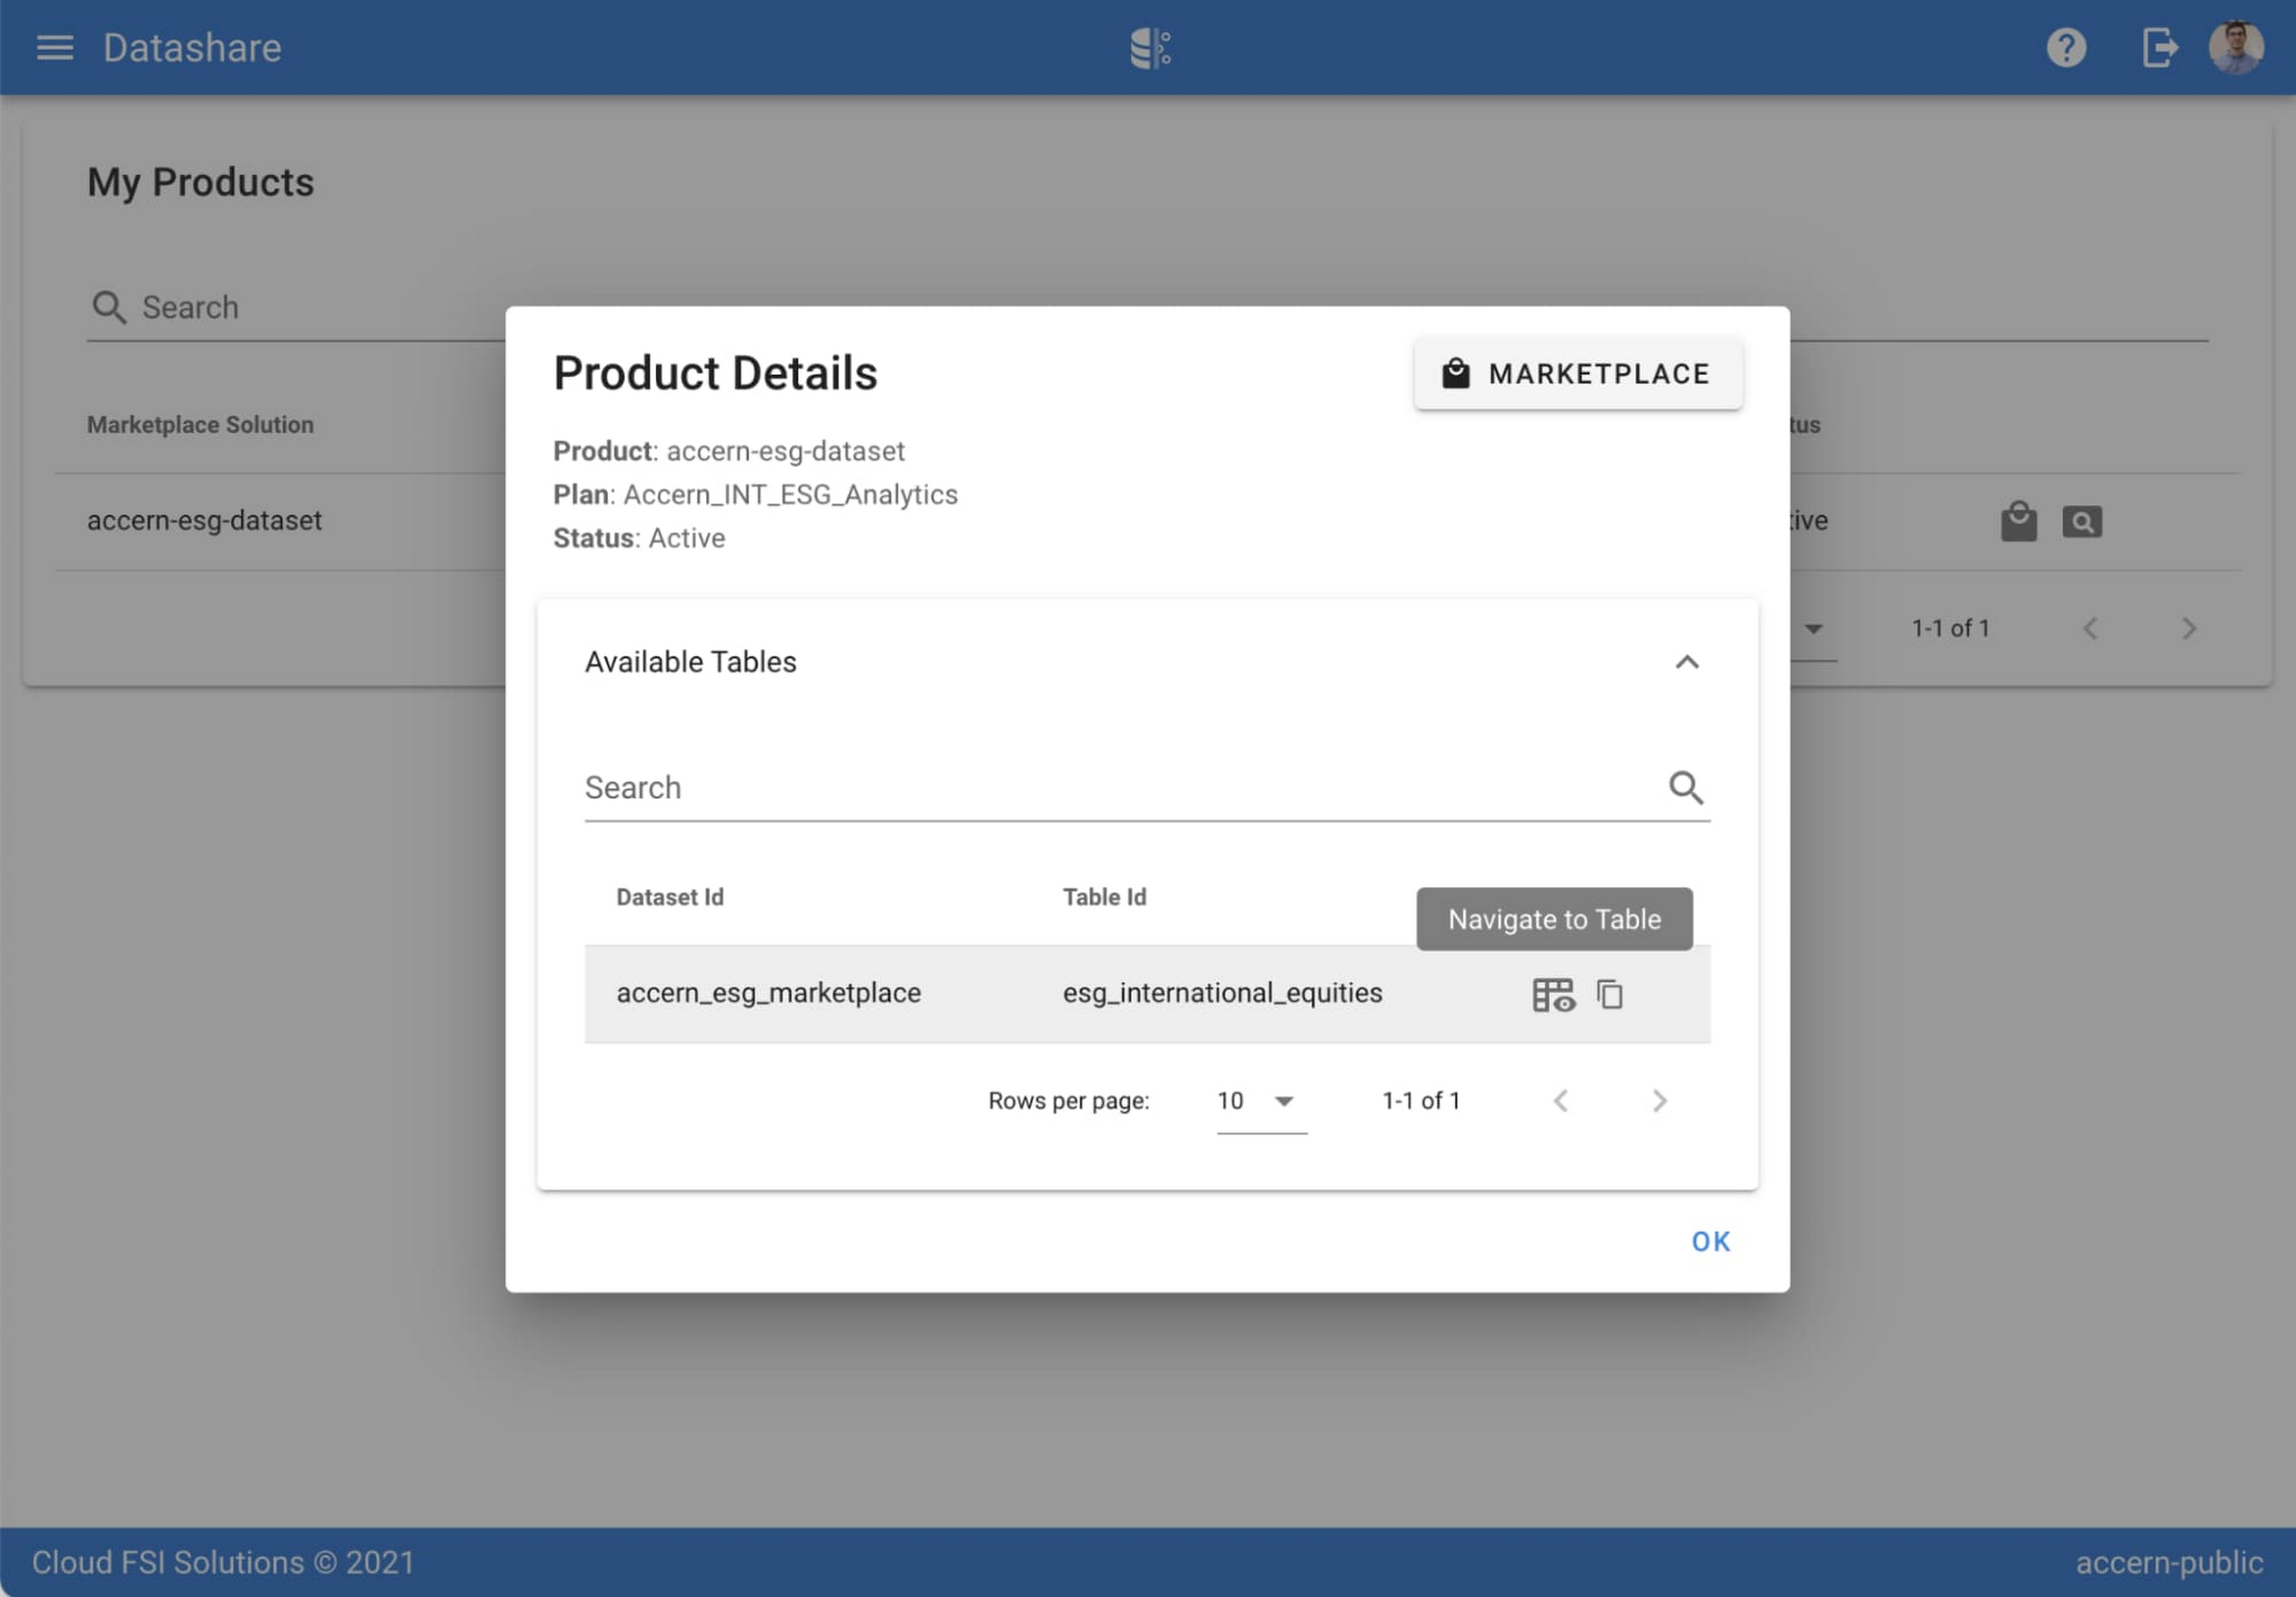
Step 3. Once activation is complete, you’ll be directed to the Datashare ‘My Products’ screen. Voila! You are now subscribed to Accern’s ESG Scores dataset and can access it in your Google Cloud instance using BigQuery. To access the data, click the hour glass icon on the corresponding ‘My Products’ record that you just purchased. An overlay will present you with the details on the dataset and/or table. Click the ‘Navigate to Table’ button to navigate through to the BigQuery console.


Step 4. Now that you have access and are in the BigQuery console, it’s time to generate data insights.
For this example, we’ve eliminated the company identifying information that is included as part of the subscription and aggregated company ESG in a view where each row represents a day, an industry sector, a specific identified ‘ESG Issues’ (event_group and event) and the respective ‘ESG Sentiment’ per issue.

For example, row 1 indicates that within the ‘Healthcare’ sector, there was a ‘Social – Civil Society’ issue identified and it had a negative ESG sentiment score of -15.35.
Step 5. Generate a report by exporting it to Data Studio to build visualizations and conduct additional analysis on the ESG data.
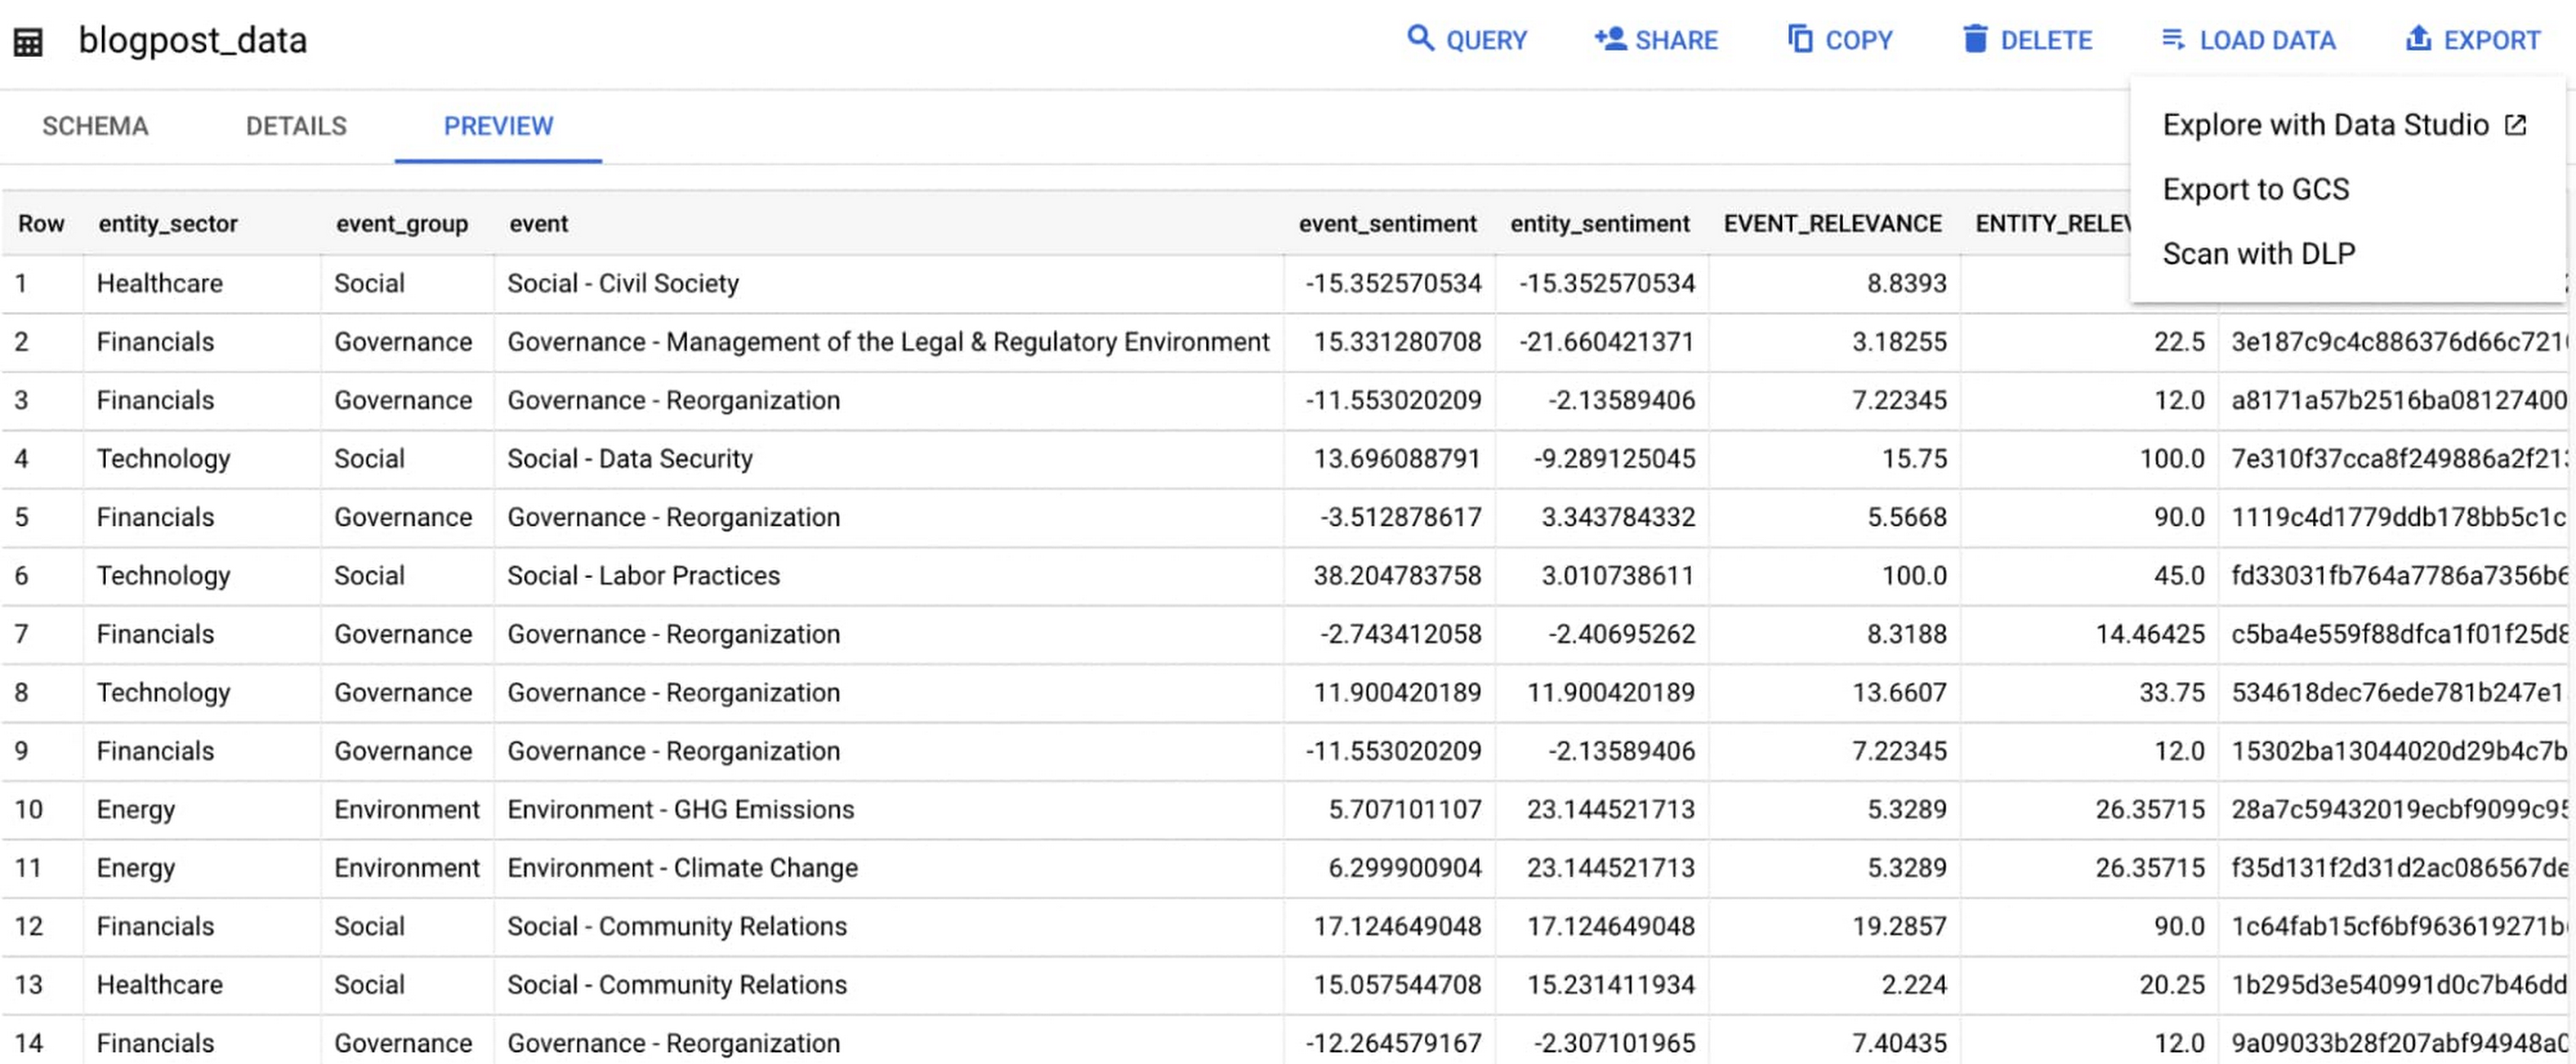
Select ‘Export’ and ‘Explore with Data Studio’.
Step 6. Build a simple/basic report.
Now that the ESG data appears in Data Studio, you can start by building a simple chart to help you understand which industry sectors have the highest volume of discussions around ESG and the overall ESG Sentiment per industry sector.
To build the chart:
- Select the chart type ‘Table’.
- Include
Entity_Sectoras your dimension to aggregate results by ‘Industry Sector.’ - Include
Signal_IDas a measure to count the number of ESG passages identified per ‘Industry Sector.’ - Include
AVG(Event_Sentiment)as a measure to display the overall ESG Sentiment per ‘Industry Sector’ across ESG Issues.

You can see sectors that are most discussed when it comes to ESG related topics and their corresponding ‘ESG Sentiment’ scores.
Step 7. Build your final report in Data Studio.
As a next step you can further drill into the data to understand ESG data specific to each ‘Industry Sector’ and identify positive and negative ESG practices.
Accern has built a more complex sample dashboard and made it available publicly here. You can interact with this report and play around with the data. The dashboard can help to identify material ESG insights for each sector to inform your investment and risk processes. If you have additional questions, you can reach out to Accern directly.

Discovering, accessing and analyzing licensed datasets is quick and easy. Stay tuned for more updates on new licensed datasets.
Publishing your data via Datashare
If you are a publisher of market data, alternative, or exotic data, you can use Datashare to get it published on Google Cloud Marketplace.
Start by joining the Partner Advantage program by registering for the Partner Advantage Portal and applying for the Partner Advantage Build Model engagement. Visit our getting started guide for information to get started on publishing licensed datasets in the Marketplace. Stay tuned for a future blog post about using Datashare to publish datasets in the Marketplace.
More solutions for capital markets
Check out other Google Cloud solutions for capital markets.
How Toyota’s Google Cloud-powered Voice Assistant Gives a Turboboost to Drivers’ Experience

4829
Of your peers have already read this article.
2:00 Minutes
The most insightful time you'll spend today!
Over the decades, technology has helped us organize large amounts of physical information in ways that are streamlined, efficient, and easily accessible. Rows upon rows of encyclopedias are no longer needed; simply punch in or speak a query into Google Search and find numerous results at your fingertips. There’s no need to haul around cases of CDs or cassettes either, when you can access hundreds of thousands of songs on music streaming services.
We wanted to bring that same level of accessibility to one specific type of publication: the printed car manual. Here’s how we shifted the paper manual to become an easy-to-access, voice-activated digital experience for owners of the all-new Sienna. It’s helped this resource become just as modern and useful as Toyotas themselves.
Putting cloud technology in the driver’s seat
Far too often, the printed car manual remains unused, collecting dust in the glove compartment—that is, until it’s needed during a roadside emergency or to solve the meaning of a mysterious light popping up on the dashboard. Even then, thumbing through hundreds of pages during high-stakes moments can be stressful. On top of that, these manuals can be expensive to print and update.
Digital versions, such as a PDF file, are a nice start. But, they’re often little more than reformatted flat documents. In poor visual conditions on the side of a road, the last thing a driver wants to do is squint at a phone or scroll through pages of tiny text. And similar to printed manuals, digital versions don’t facilitate ongoing, real-time conversations between drivers and automakers when it matters the most; they’re often only text and pictures, and at best, schematic drawings.
With that in mind, we set out to elevate and personalize the car manual by creating a voice-activated digital owner’s manual experience, all powered by Google Cloud. A voice-based assistant was the clear choice because, as it felt like the most intuitive, natural option, especially while driving. In fact, 51% of U.S. adults have used a voice assistant while driving, and 95% of all drivers expect to use a voice assistant in the next three years.
We’re now putting this technology on the road by powering the Toyota Driver’s Companion for the all-new 2021 Toyota Sienna model. Accessible through the existing Toyota app, this companion provides real-time assistance, any time of the day. Drivers can ask questions and the companion will efficiently provide helpful answers in convenient ways, from voice to 3D walkthroughs and explorable environments.
What a modern car manual should do
The Toyota Driver’s Companion has interactive features to help drivers discover the Sienna’s dashboard, set up the car’s interior and exterior appearance, better understand vehicle maintenance, and explore Dynamic Radar Cruise Control, Lane Departure Alert and other features.
Here are a few other additional key features to call out within the Toyota Driver’s Companion:
- An easily accessible virtual voice through the Toyota Driver’s Companion lets app users ask personal questions about their 2021 Sienna such as “what’s the height of my car?” and receive immediate answers either by voice, display or interactive input.
- The manual automatically connects with the purchased vehicle’s VIN number to create a completely personalized experience, curated specifically for the driver. For example, if an unfamiliar light on the dashboard pops up, the Toyota Driver’s Companion can help identify the light’s meaning.
- Interactive hotspots throughout the vehicle’s interior let drivers explore the cabin virtually. Drivers can discover button functionalities, find specific dials, and learn more about car functions, such as how to slide seats or open doors, to become acclimated with their new vehicle.
To bring this experience to life, we tapped into some of our key Google Cloud solutions:
- APIs powered by Google Cloud artificial intelligence technology make accessing specific vehicle information easy and effortless, by leveraging Google’s natural language processing:
- Google Cloud DialogFlow API serves as the decision tree that gives intelligence for both finding an answer for a question, i.e., how the Companion responds to the end user’s questions.
- One of our Text-to-Speech APIs—called Wavenet—creates the Companion’s realistic voice.
- And finally, our Speech-to-Text API “listens” to the user’s voice and finds the correct information to craft responses. That means a driver can ask a question multiple ways, and the Companion will still respond with the right answer.
Our Firebase mobile app dev platform gleans analytic insights that help improve the overall experience and services for OEMs and drivers alike.https://www.youtube.com/embed/66QxWS-PzIM?enablejsapi=1&
We’re encouraging better consumer experiences by providing faster access to fresh information, in a natural, accessible format—voice. But these new voice-activated experiences aren’t only an opportunity to help out drivers; it’s also about strengthening connections between drivers, their vehicles, and automakers, too.
Our hope is that through this information exchange, drivers can provide feedback on the most frequently misunderstood features, enabling OEMs to address questions early on. By understanding the most requested features, OEMs can also predict and inform driver questions about features. We’re incredibly excited to help make the driver’s experience more connected and helpful.
More Relevant Stories for Your Company


Can Your Data Warehouse Handle a 100-Trillion Row Query?
Today's enterprise demands from data go far beyond the capabilities of traditional data warehousing and for many leaders, the need to digitally transform their businesses is a key driver for data analytics spending. Businesses want to make real-time decisions from fresh information as well as make future predictions from their

KLM’s Doubles Bookings With the Same Spend With Machine Learning
GOALS Develop smarter, more effective media buying models through dataDrive relevant advertisingScale predictive modelling across all touchpoints in the customer journey APPROACH Combined contextual data to create a predictive model with granular layers Activated data in real-time RESULTS 40% lower cost per bookingMore than twice as many bookings at same

The Power of Personalization: Ocado Retail’s Strategy to Boost Revenue and Lower Churn
Retailers are becoming more skilled at making individual customers feel heard and valued. This is a necessity given the fact that 66% of respondents to a McKinsey survey stated that they expect email marketing messages to be tailored to their needs. While marketing personalization expertise is growing, it’s still difficult to manage,

What’s New in Retail: Bits from Google Cloud’s Retail & Consumer Goods Summit
Today we’re hosting our Retail & Consumer Goods Summit, a digital event dedicated to helping leading retailers and brands digitally transform their business. For me, this is a personally exciting moment, as I see tremendous opportunities for those companies that choose to focus on their customers and leverage technology to elevate
