





3102
Of your peers have already watched this video.
21:00 Minutes
The most insightful time you'll spend today!
Google Cloud’s AI Adoption Framework: Helping You Build a Transformative AI Capability
AI can help organizations improve the decision-making process across most business functions. However, building an effective AI capability encompasses more than just creating a technology platform.
To do this effectively requires alignment to business objectives, strong executive sponsorship, and collaboration between skilled employees and strategic partners.
Additionally, you need your initiatives to be powered by secure data management and cloud-native services to scale and automate ML workloads, and ensure all of this is underpinned by responsible AI principles.
Successfully adopting AI in your business is determined by your practices in these areas. Learn more about the AI journey and how you can gain value every step of the way.
How Toyota’s Google Cloud-powered Voice Assistant Gives a Turboboost to Drivers’ Experience

4828
Of your peers have already read this article.
2:00 Minutes
The most insightful time you'll spend today!
Over the decades, technology has helped us organize large amounts of physical information in ways that are streamlined, efficient, and easily accessible. Rows upon rows of encyclopedias are no longer needed; simply punch in or speak a query into Google Search and find numerous results at your fingertips. There’s no need to haul around cases of CDs or cassettes either, when you can access hundreds of thousands of songs on music streaming services.
We wanted to bring that same level of accessibility to one specific type of publication: the printed car manual. Here’s how we shifted the paper manual to become an easy-to-access, voice-activated digital experience for owners of the all-new Sienna. It’s helped this resource become just as modern and useful as Toyotas themselves.
Putting cloud technology in the driver’s seat
Far too often, the printed car manual remains unused, collecting dust in the glove compartment—that is, until it’s needed during a roadside emergency or to solve the meaning of a mysterious light popping up on the dashboard. Even then, thumbing through hundreds of pages during high-stakes moments can be stressful. On top of that, these manuals can be expensive to print and update.
Digital versions, such as a PDF file, are a nice start. But, they’re often little more than reformatted flat documents. In poor visual conditions on the side of a road, the last thing a driver wants to do is squint at a phone or scroll through pages of tiny text. And similar to printed manuals, digital versions don’t facilitate ongoing, real-time conversations between drivers and automakers when it matters the most; they’re often only text and pictures, and at best, schematic drawings.
With that in mind, we set out to elevate and personalize the car manual by creating a voice-activated digital owner’s manual experience, all powered by Google Cloud. A voice-based assistant was the clear choice because, as it felt like the most intuitive, natural option, especially while driving. In fact, 51% of U.S. adults have used a voice assistant while driving, and 95% of all drivers expect to use a voice assistant in the next three years.
We’re now putting this technology on the road by powering the Toyota Driver’s Companion for the all-new 2021 Toyota Sienna model. Accessible through the existing Toyota app, this companion provides real-time assistance, any time of the day. Drivers can ask questions and the companion will efficiently provide helpful answers in convenient ways, from voice to 3D walkthroughs and explorable environments.
What a modern car manual should do
The Toyota Driver’s Companion has interactive features to help drivers discover the Sienna’s dashboard, set up the car’s interior and exterior appearance, better understand vehicle maintenance, and explore Dynamic Radar Cruise Control, Lane Departure Alert and other features.
Here are a few other additional key features to call out within the Toyota Driver’s Companion:
- An easily accessible virtual voice through the Toyota Driver’s Companion lets app users ask personal questions about their 2021 Sienna such as “what’s the height of my car?” and receive immediate answers either by voice, display or interactive input.
- The manual automatically connects with the purchased vehicle’s VIN number to create a completely personalized experience, curated specifically for the driver. For example, if an unfamiliar light on the dashboard pops up, the Toyota Driver’s Companion can help identify the light’s meaning.
- Interactive hotspots throughout the vehicle’s interior let drivers explore the cabin virtually. Drivers can discover button functionalities, find specific dials, and learn more about car functions, such as how to slide seats or open doors, to become acclimated with their new vehicle.
To bring this experience to life, we tapped into some of our key Google Cloud solutions:
- APIs powered by Google Cloud artificial intelligence technology make accessing specific vehicle information easy and effortless, by leveraging Google’s natural language processing:
- Google Cloud DialogFlow API serves as the decision tree that gives intelligence for both finding an answer for a question, i.e., how the Companion responds to the end user’s questions.
- One of our Text-to-Speech APIs—called Wavenet—creates the Companion’s realistic voice.
- And finally, our Speech-to-Text API “listens” to the user’s voice and finds the correct information to craft responses. That means a driver can ask a question multiple ways, and the Companion will still respond with the right answer.
Our Firebase mobile app dev platform gleans analytic insights that help improve the overall experience and services for OEMs and drivers alike.https://www.youtube.com/embed/66QxWS-PzIM?enablejsapi=1&
We’re encouraging better consumer experiences by providing faster access to fresh information, in a natural, accessible format—voice. But these new voice-activated experiences aren’t only an opportunity to help out drivers; it’s also about strengthening connections between drivers, their vehicles, and automakers, too.
Our hope is that through this information exchange, drivers can provide feedback on the most frequently misunderstood features, enabling OEMs to address questions early on. By understanding the most requested features, OEMs can also predict and inform driver questions about features. We’re incredibly excited to help make the driver’s experience more connected and helpful.
5678
Of your peers have already watched this video.
56:20 Minutes
The most insightful time you'll spend today!
How Real Companies Are Innovating with AI Today—and the Benefits They’re Seeing
What do you get when you mix Target, women’s swim wear, and AI? “Joy!” says Mike McNamara, CIO and CDO, Target.
McNamara is just one of the many stories of real businesses conquering old challenges, and new disruptive industry challenges, with artificial intelligence.
McNamara, Nick Rockwell, CTO, The New York Times, Larry Colagiovanni, VP New Product Development, eBay, and Dirk John, CIO, LATAM Airlines, demonstrate how AI solutions allow businesses to find opportunity in chaos, innovation under tough conditions, and revenue in the most unlikely of places.
AI at Target
McNamara shows how AI is being applied to solve some of the most basic, yet critical, challenges that retailers like Target–and any business with large inventories—face. (start at 4:04)
AI at The New York Times
Nick Rockwell, CTO, The New York Times, shares how AI and big data tools are being used to leverage old assets and drive business ideas from them. (start at 12:18)
AI at eBay
Larry Colagiovanni, VP New Product Development, eBay, talks about how AI is helping eBay drive conversational commerce, help buyers sift through 1.1 billion items, and personalize the shopping experience.(start at 28:07)
AI at LATAM Airlines
Dirk John, CIO, LATAM Airlines, discusses how LATAM Airlines adopted advanced analytics tools in just a few weeks to accelerate the company’s understanding of their customers’ needs.(start at 35:58)
Ahead of the Curve: 5 Data and AI Trends Set to Shape 2023

2276
Of your peers have already read this article.
4:00 Minutes
The most insightful time you'll spend today!
How will your organization manage this year’s data growth and business requirements? Your actions and strategies involving data and AI will improve or undermine your organization’s competitiveness in the months and years to come. Our teams at Google Cloud have an eye on the future as we evolve our strategies to protect technology choice, simplify data integration, increase AI adoption, deliver needed information on demand, and meet security requirements.
Google Cloud worked with* IDC on multiple studies involving global organizations across industries in order to explore how data leaders are successfully addressing key data and AI challenges. We compiled the results in our 2023 Data and AI Trends report. In it, you’ll find the metrics-rich research behind the top five data and AI trends, along with tips and customer examples for incorporating them into your plans.

1: Show data silos the door
Given the increasing volumes of data we’re all managing, it’s no surprise that siloed transactional databases and warehousing strategies can’t meet modern demands. Organizations want to improve how they store, manage, analyze, and govern all their data, while reducing costs. They also want to eliminate conflicting insights from replicated data and empower everyone with fresh data.
A unified data cloud enables the integration of data and insights into transformative digital experiences and better decision making.
Andi Gutmans, GM and VP of Engineering for Databases, Google Cloud
In the report, you can learn how to adopt a unified data cloud that supports every stage of the data lifecycle so that you can improve data usage, accessibility, and governance. Inform your strategy by drawing on organizations’ examples such as a data fabric that improves customer experiences by connecting more than 80 data silos, as well as other unified data clouds that save money and simplify growth.

2: Usher in the age of the open data ecosystem
Data is the key to unlocking AI, speeding up development cycles, and increasing ROI. To protect against data and technology lock-in, more organizations are adopting open source software and open APIs.
Tweet this quote
Understand how you can simplify data integration, facilitate multicloud analytics, and use the technologies you want with an open data ecosystem, as described in the report. Learn from metrics about global open source adoption and public dataset usage. And explore how global companies adopted open data ecosystems to improve patient outcomes, increase website traffic by 25%, and cut operating costs by 90%.
3: Embrace the AI tipping point
Pulling useful information out of data is easier with AI and ML. Not only can you identify patterns and answer questions faster but the technologies also make it easier to solve problems at scale.
We’ve reached the AI tipping point. Whether people realize it or not, we’re already using applications powered by AI—every day. Social media platforms, voice assistants, and driving services are easy examples.
June Yang, VP, Cloud AI and Industry Solutions, Google Cloud
Organizations share how they’re reaching their goals using AI and ML by empowering “citizen data scientists” and having them focus on small wins first. Gain tips from Yang and other experts for developing your AI strategy. And read how organizations achieve outcomes such as a reduction of 7,400 tons per year in carbon emissions and a more than 200% increase in ROI from ad spend by using pattern recognition and other AI capabilities.

4: Infuse insights everywhere
Yesterday’s BI solutions have led to outdated insights and user fatigue with the status quo, based on generic metrics and old information. Research shows that as new tools come online, expectations for BI are changing, with companies revising their strategies to improve decision making, speed up the development of new revenue streams, and increase customer acquisition and retention by providing individuals with needed information on demand.
Organizations are equipping business decision-makers with the tools they need to incorporate required insights into their everyday workflows.
Kate Wright, Senior Director, Product Management, Google Cloud
In the report, you’ll discover why and how data leaders are rethinking their BI analytics strategies and applications to improve users’ trust and use of data in automated workflows, customizable dashboards, and on-demand reports. Global companies also share how they improve decision making with self-service BI, customer experiences with IoT analysis, and threat mitigation with embedded analytics.

5: Get to know your unknown data
Increasing data volumes can make it harder to know where and what data they store, which may create risk. Case in point: If a customer unexpectedly shares personally identifiable information during a recorded customer support call or chat session, that data might require specialized governance, which the standardized storage process may not provide.
If you don’t know what data you have, you cannot know that it’s accurately secured. You also don’t know what security risks you are incurring, or what security measures you need to take.
Anton Chuvakin, Senior Staff Security Consultant, Google Cloud
Check out the report to learn about data security risks that are often overlooked and how to develop proactive governance strategies for your sensitive data. You can also read how global organizations have increased customer trust and productivity by improving how they discover, classify, and manage their structured and unstructured data.
Be ready for what’s next
What’s exciting about these trends is that they’re enabling organizations across industries to realize very different goals using their choice of technologies. And although all the trends depend on each other, research shows you can realize measurable benefits whether you adopt one or all five.
Review the report yourself and learn how you can refine your organization’s data and AI strategies by drawing on the collective insights, experiences, and successes of more than 800 global organizations.
Trading and Investment Companies will Increase Consumption of Cloud Services: Study Confirms

4901
Of your peers have already read this article.
3:00 Minutes
The most insightful time you'll spend today!
While some traditional financial services companies have more slowly transitioned to the cloud, capital markets firms have embraced cloud computing across their entire value chains — front-, middle-, and back-office. We wanted to understand the dynamics behind this rapid adoption, the most common use cases, and the types of technology most in use, particularly as it relates to market data. Google Cloud commissioned Coalition Greenwich to survey 102 institutional capital markets professionals — at exchanges, trading systems, data aggregators, data producers, asset managers, hedge funds, and investment banks — in the United States, Canada, France, Germany, Italy, the Netherlands, Switzerland, and the United Kingdom.
Our research found that while there are many drivers, demand for easier accessibility is fueling widespread adoption of cloud-based market data services, and associated trading infrastructures, across the buy side and sell side. In fact, 68% of sell-side and buy-side users find it critical for market data providers to offer public cloud-based data services. At the same time, exchanges, market data providers, aggregators, and trading systems are embracing the cloud as a delivery model by offering access to data directly via their own cloud services, APIs or partners.
Here were five noteworthy takeaways from the study:
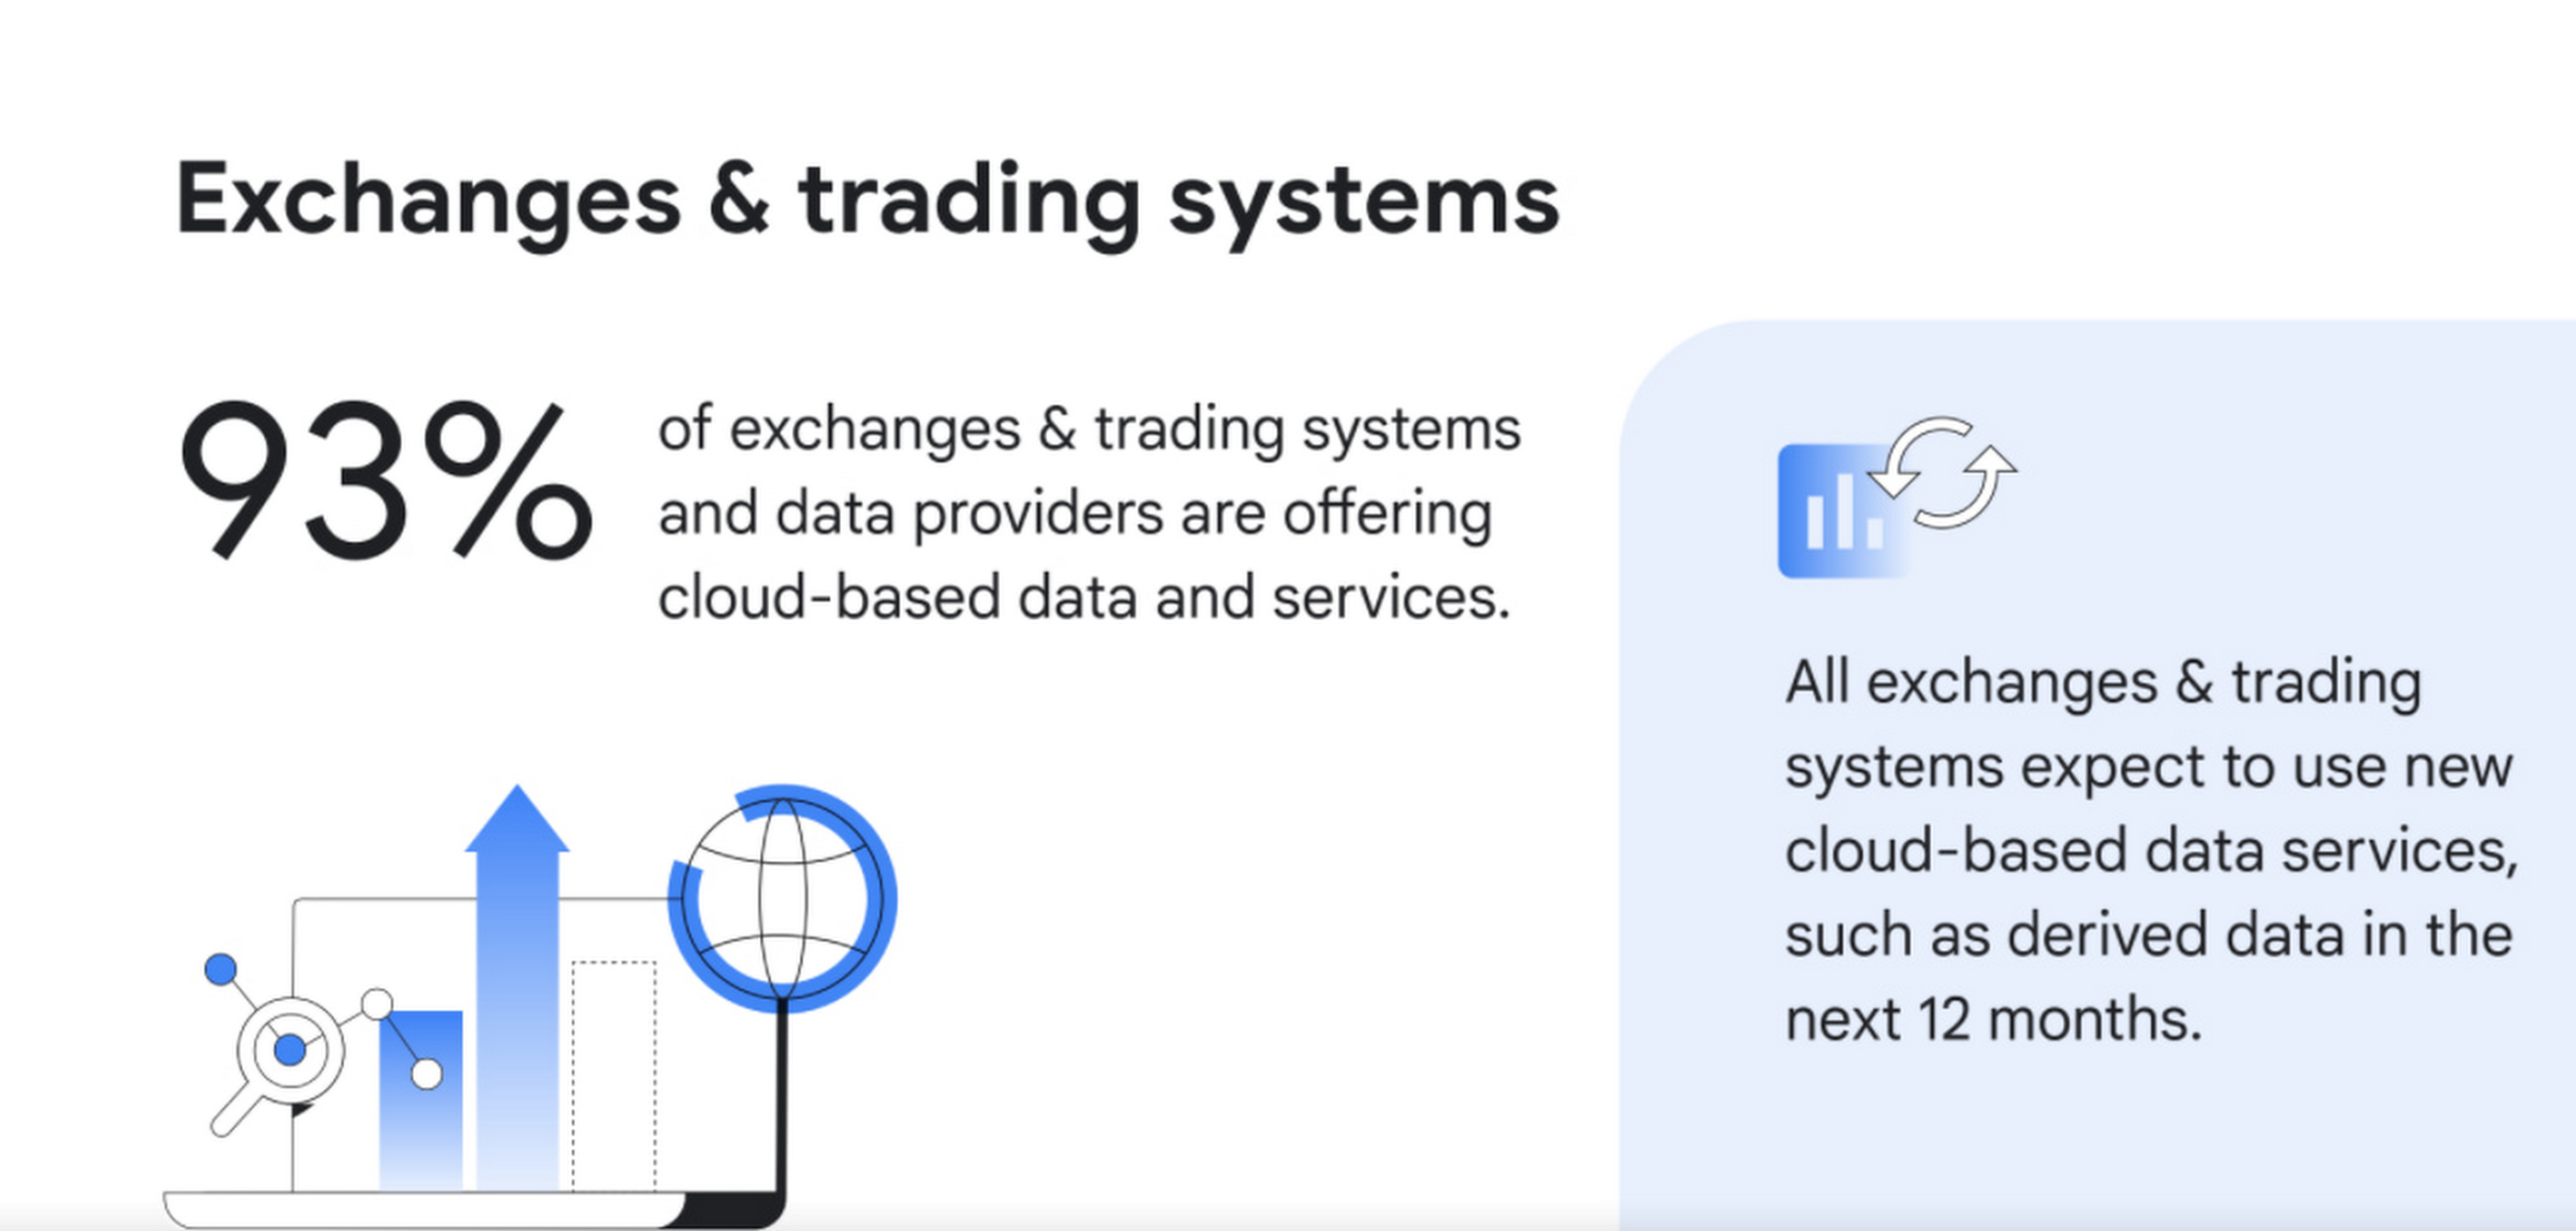
1. Cloud services are becoming ubiquitous for data delivery. Today, the cloud is pervasive, with 93% of exchanges, trading systems and data providers offering cloud-based data and services, according to surveyed executives. Moreover, 100% of those surveyed intend to offer new cloud-based services, such as derived data, in the next 12 months.
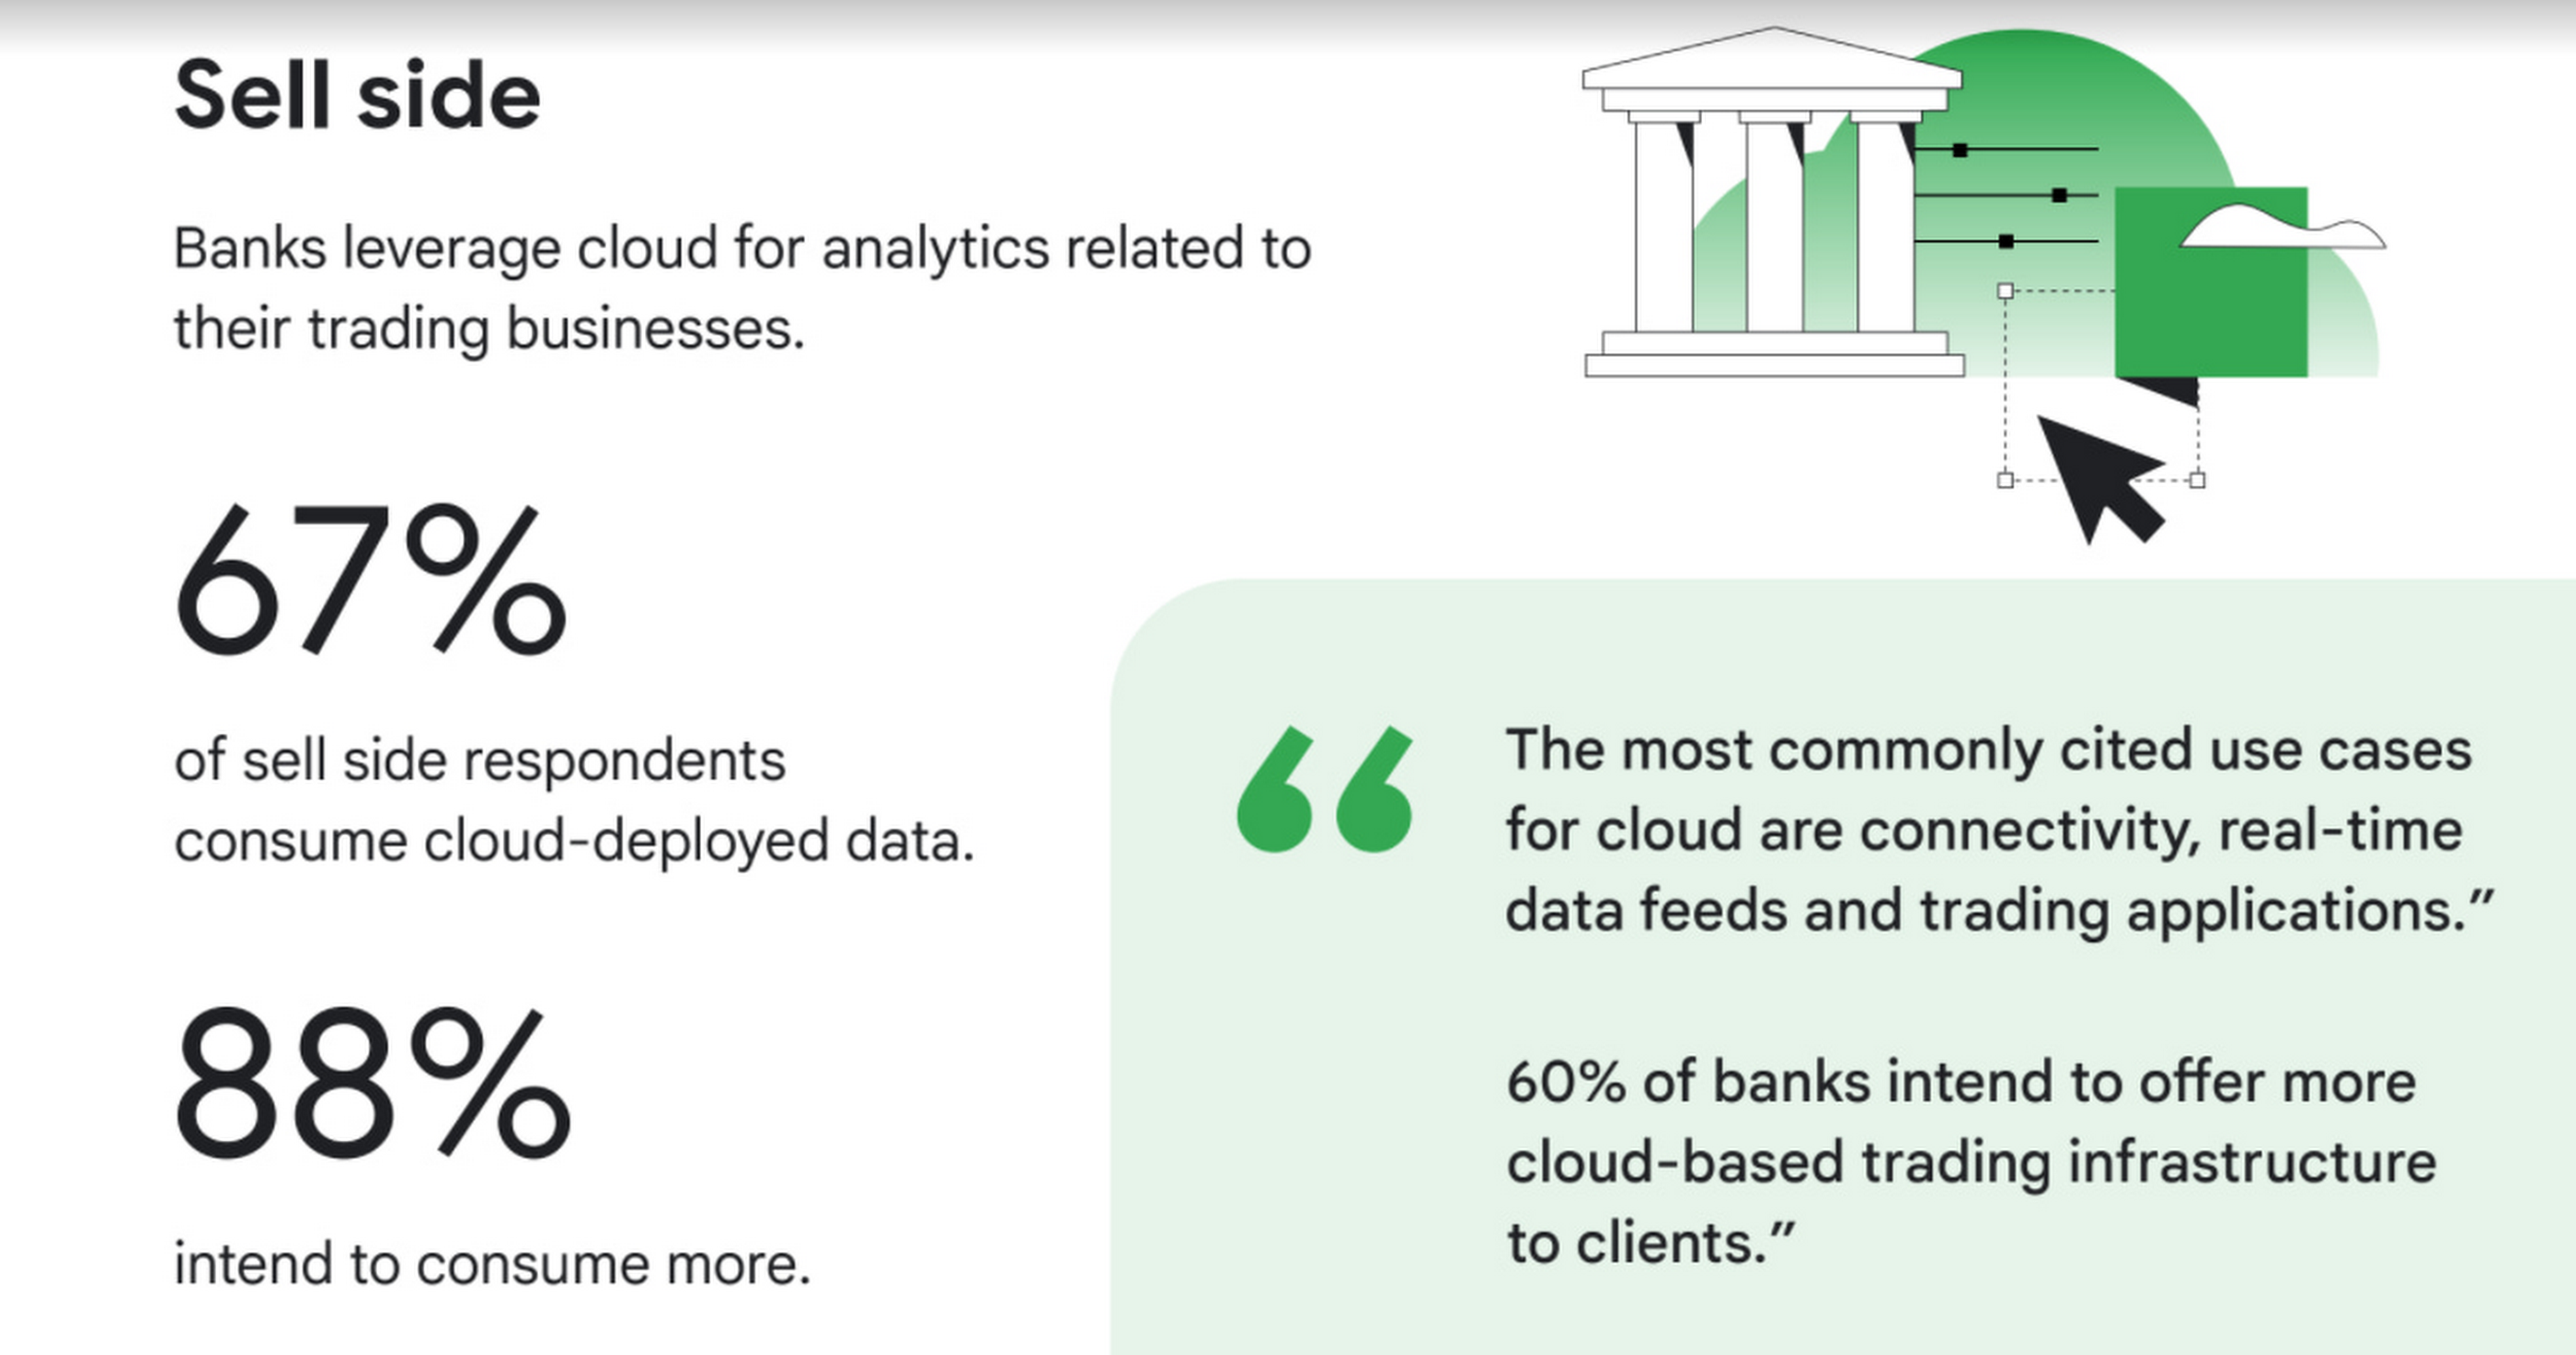
2. Commercial and investment banks are offering additional connectivity, real-time data feeds, and trading applications delivered via the cloud,demonstrating that it’s not only exchanges, trading systems, and data providers that are moving rapidly to the cloud. Internal use cases abound as well, with 67% of those surveyed consuming cloud-deployed market data, primarily for data analytics. 88% of surveyed sell-side firms intend to consume cloud-based market data services, with digital transformation, data science and quant research as the top use cases.
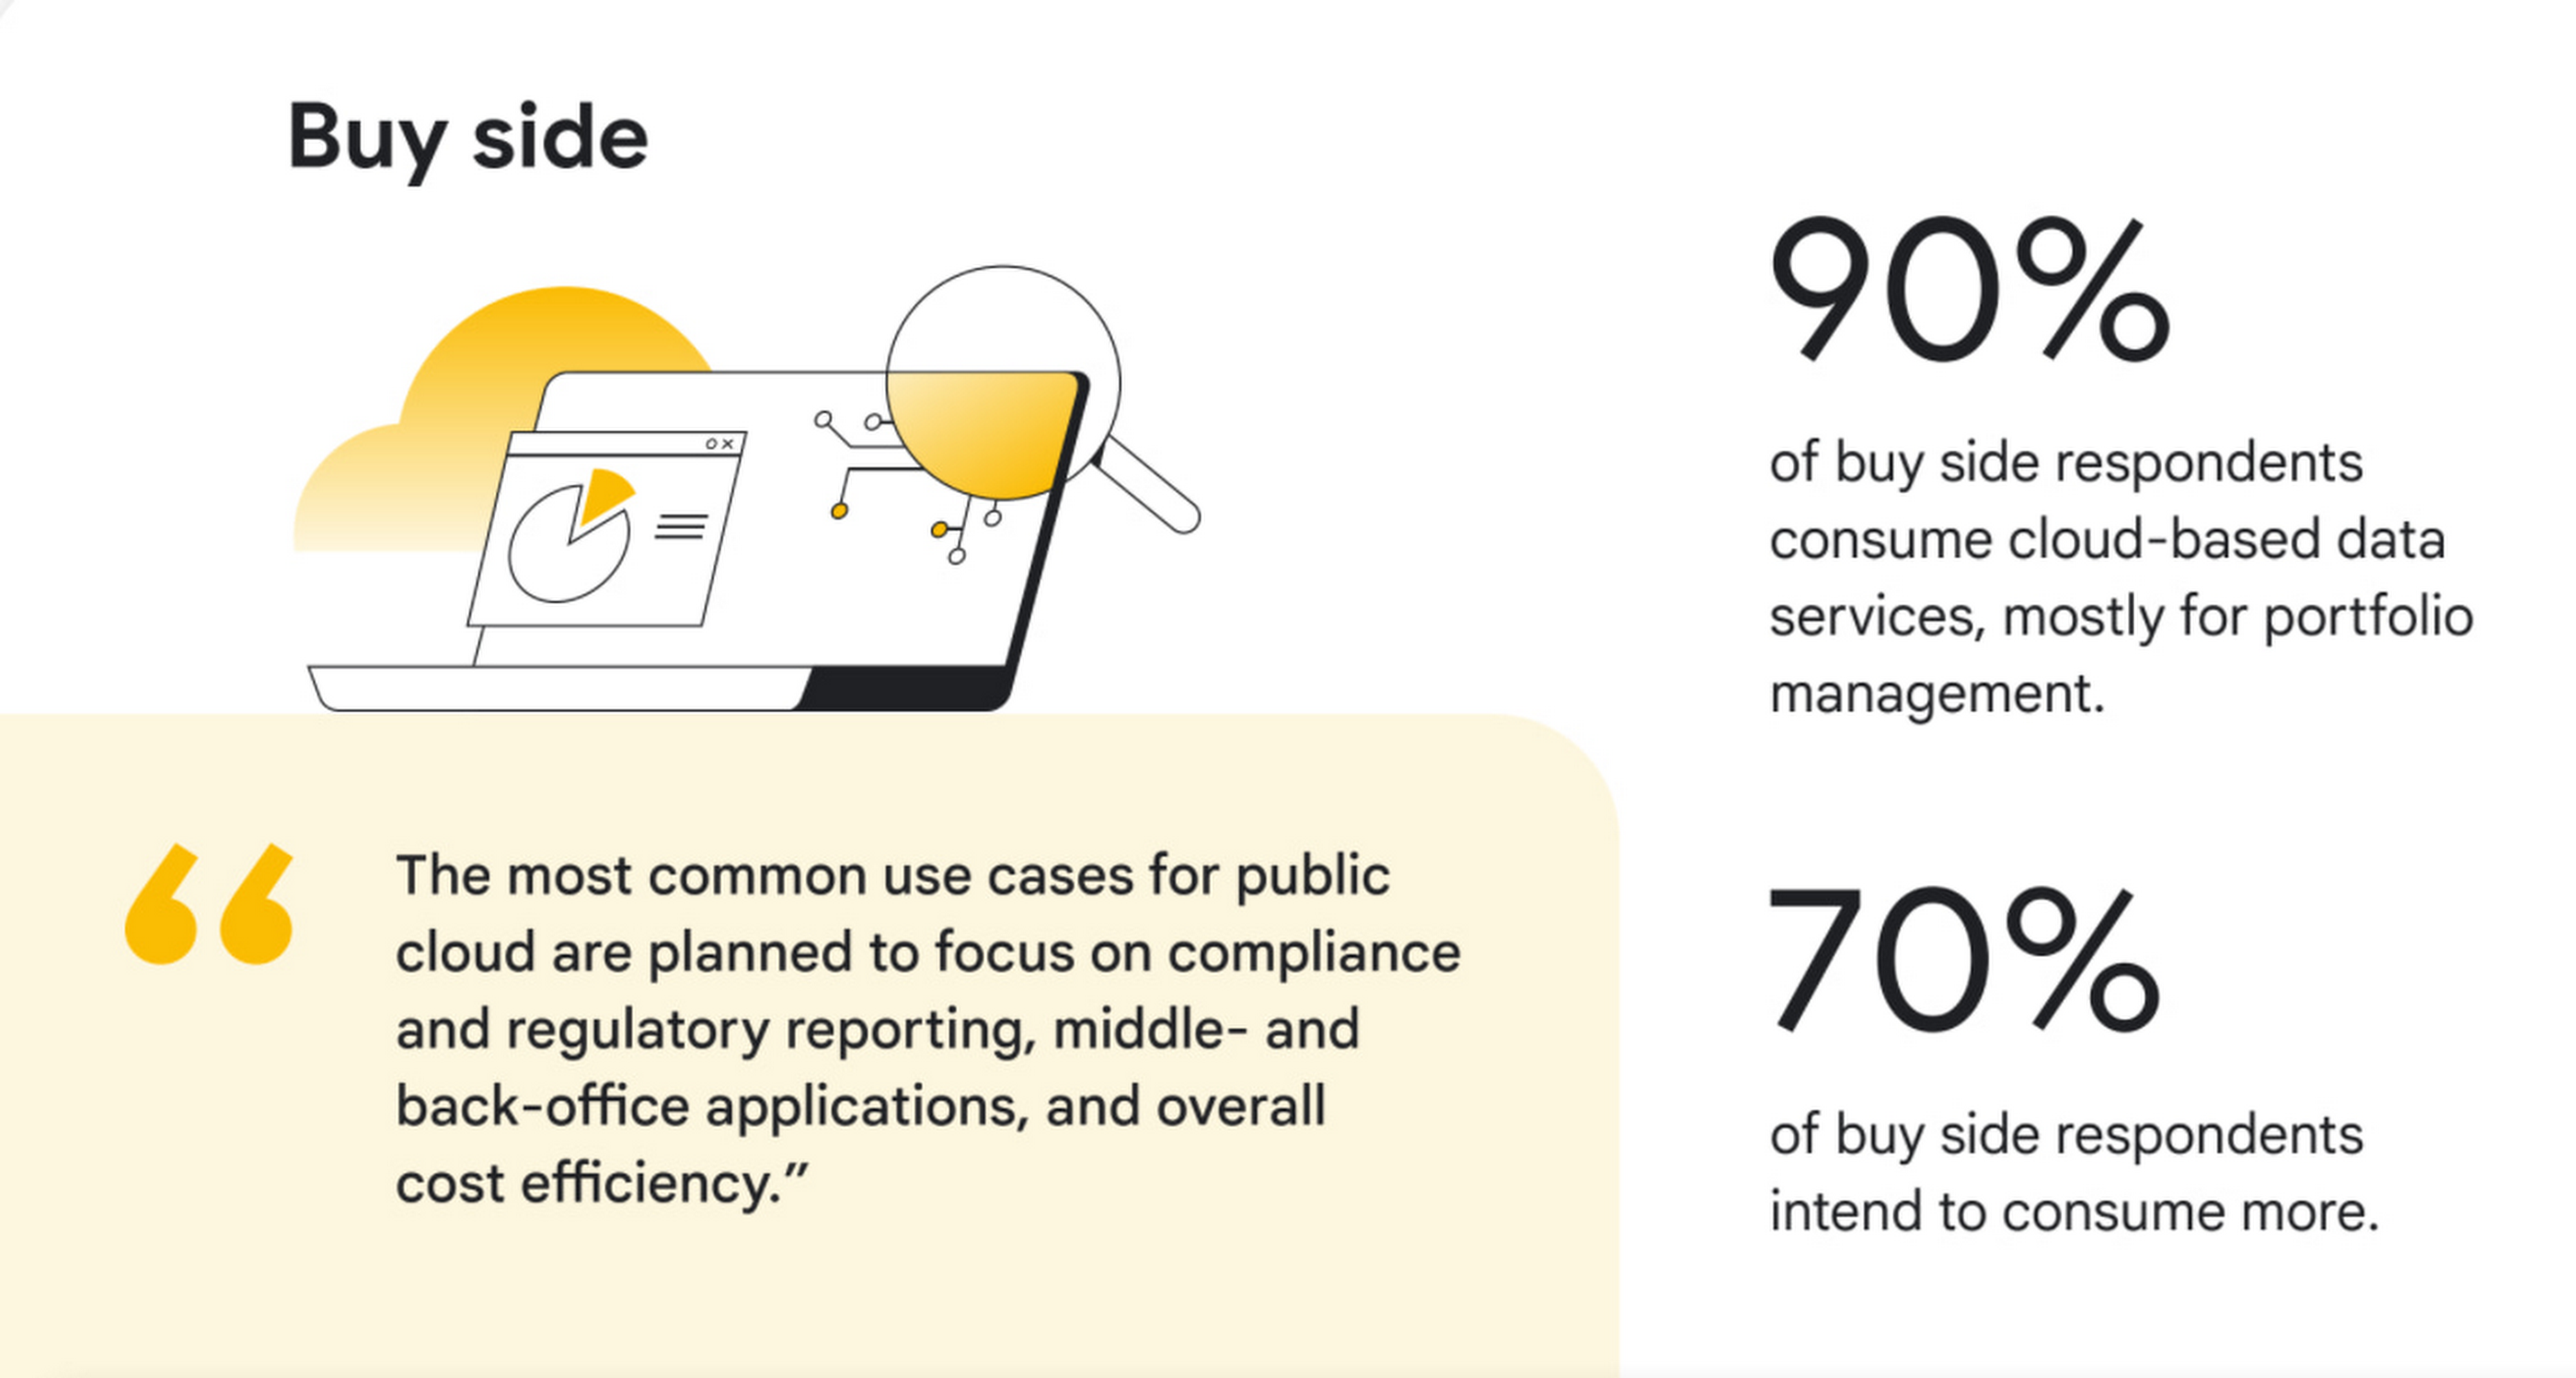
3. Buy side firms will consume even more cloud-deployed data. Today, 90% of surveyed buy-side firms are consuming cloud-deployed market data, mostly for portfolio management. 70% of buy-side firms intend to consume more public cloud-based market data services in the next 12 months, adding services such as compliance and regulatory reporting.
4. AI/ML, powered by cloud, is moving out of the pilot phase and into mainstream use. Today, 50% of exchanges, trading systems, and data providers are offering data products or services powered by AI/ML, and of those, 42% intend to offer AI-powered trade execution and trading analytics services in the next 12 months. Within commercial and investment banks, 55% said they are currently using AI/ML in the cloud, and while that was true for only 14% of overall buy-side respondents, 44% of large buy-side respondents are using it.

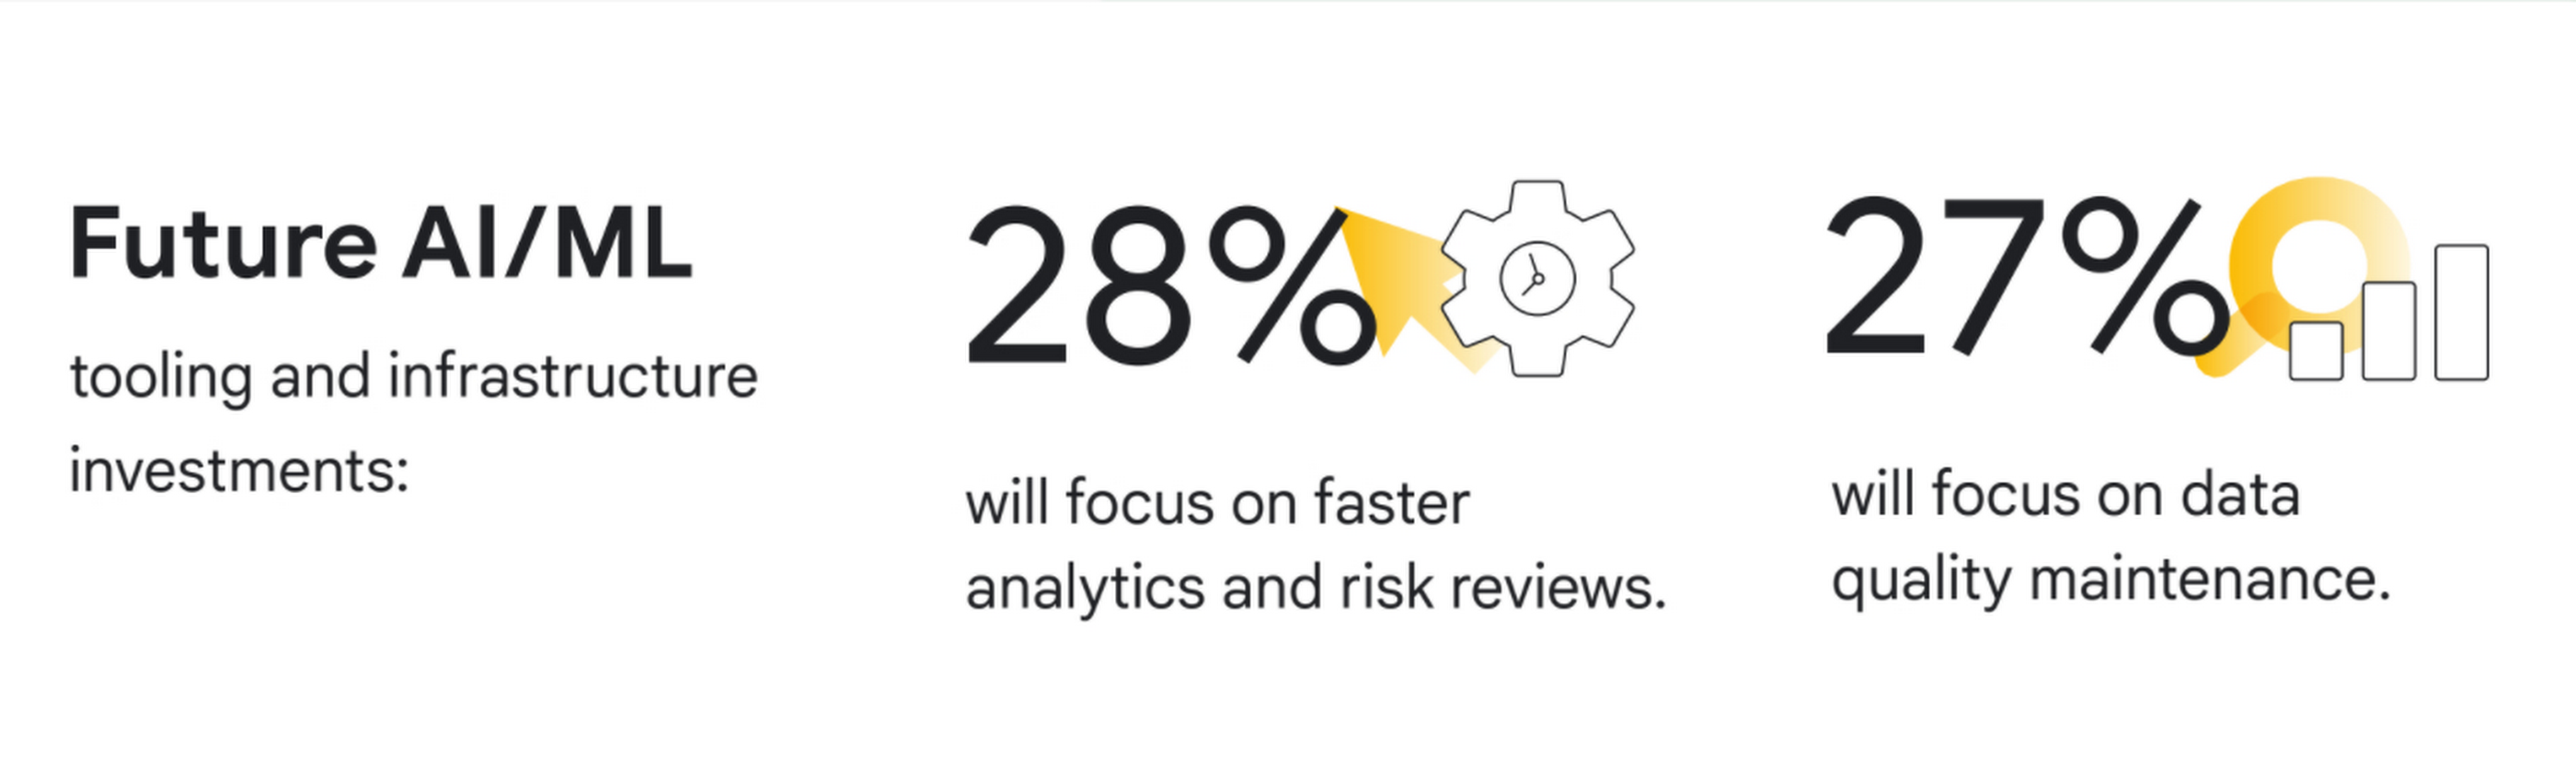
5. Exchanges, trading systems, and data providers are prioritizing public cloud for internal insights. 71% of these firms are using the public cloud, mostly for data transmission, processing, analysis, and long-term data storage. Over the next 12 months, 33% of new public cloud workloads will focus on data mining, data insights and advanced analytics, while 28% of new AI/ML tooling and infrastructure investments will focus on faster analytics and risk reviews, and 27% on data quality maintenance.
“We see new, dramatic shifts on the adoption of cloud across market data,” said David Easthope, Senior Analyst for Coalition Greenwich. “And we expect further proliferation of cloud-based services and greater consumption across the trading and investing lifecycle.”
Conclusions and future predictions
Based on the survey results, Coalition Greenwich predicts five following trends over the next 12 months:
- Exchanges and trading systems will continue to launch a wide array of new cloud-based and possibly cloud exclusive data services across derived data, end of day data, reference data and pricing data.
- Data providers will launch new data products such as pre-trade analytics powered by AI/ML in the cloud.
- Commercial and investment banks will offer additional connectivity, real-time data feeds, and trading applications delivered via the cloud.
- Buy-side firms will consume even more cloud-deployed data, including real-time market data, portfolio management data, and risk analytics.
- Exchanges, trading systems and data providers will explore proof-of-concepts around core systems on the cloud. Improvements to AI/ML tooling or infrastructure will ramp up as firms seek more rapid responses to risk initiatives.
To learn more about these findings, download our two full reports, The Future of market data: Distribution and consumption through cloud and AI and Exchanges and data providers: Prioritizing the cloud and AI for internal insights or our short infographic.
Research methodology
The survey was conducted online by Coalition Greenwich on behalf of Google Cloud from March 2021 to April 2021 among 102 executives in North America (n=82), EMEA (n=17) and other (n=3) who are employed full-time and who are participants or influencers in decisions around cloud and/or senior management with a role at a company which is an institutional asset manager, hedge fund, alternative investment manager, exchange and/or trading system, information provider, information aggregator, or other asset manager/asset owner. The survey included wide perspectives from a range of firm size and asset class focus, including equity, fixed income, FX, commodities, multi-asset, and other asset classes.
Foot Notes
1. We defined market data as direct feeds, consolidated feeds, terminal and desktop products, security and reference data, pricing data, historical data, alternative data, and index data.
BigQuery Explainable AI for Demystifying the Inner Workings of ML Models. Now GA!

6573
Of your peers have already read this article.
2:00 Minutes
The most insightful time you'll spend today!
Explainable AI (XAI) helps you understand and interpret how your machine learning models make decisions. We’re excited to announce that BigQuery Explainable AI is now generally available (GA). BigQuery is the data warehouse that supports explainable AI in a most comprehensive way w.r.t both XAI methodology and model types. It does this at BigQuery scale, enabling millions of explanations within seconds with a single SQL query.
Why is Explainable AI so important? To demystify the inner workings of machine learning models, Explainable AI is quickly becoming an essential and growing need for businesses as they continue to invest in AI and ML. With 76% of enterprises now prioritizing artificial intelligence (AI) and machine learning (ML) over other initiatives in 2021 IT budgets, the majority of CEOs (82%) believe that AI-based decisions must be explainable to be trusted according to a PwC survey.
While the focus of this blogpost is on BigQuery Explainable AI, Google Cloud provides a variety of tools and frameworks to help you interpret models outside of BigQuery, such as with Vertex Explainable AI, which includes AutoML Tables, AutoML Vision, and custom-trained models.
So how does Explainable AI in BigQuery work exactly? And how might you use it in practice?
Two types of Explainable AI: global and local explainability
When it comes to Explainable AI, the first thing to note is that there are two main types of explainability as they relate to the features used to train the ML model: global explainability and local explainability.
Imagine that you have a ML model that predicts housing price (as a dollar amount), based on three features: (1) number of bedrooms, (2) distance to the nearest city center, and (3) construction date.
Global explainability (a.k.a. global feature importance) describes the features’ overall influence on the model and helps you understand if a feature had a greater influence than other features over the model’s predictions. For example, global explainability can reveal that the number of bedrooms and distance to city center typically has a much stronger influence than the construction date on predicting housing prices. Global explainability is especially useful if you have hundreds or thousands of features and you want to determine which features are the most important contributors to your model. You may also consider using global explainability as a way to identify and prune less important features to improve the generalizability of their models.
Local explainability (a.k.a. feature attributions) describes the breakdown of how each feature contributes towards a specific prediction. For example, if the model predicts that house ID#1001 has a predicted price of $230,000, local explainability would describe a baseline amount (e.g. $50,000) and how each of the features contributes on top of the baseline towards the predicted price. For example, the model may say that on top of the baseline of $50,000, having 3 bedrooms contributed an additional $50,000, close proximity to the city center added $100,000, and construction date of 2010 added $30,000, for a total predicted price of $230,000. In essence, understanding the exact contribution of each feature used by the model to make each prediction is the main purpose of local explainability.
What ML models does BigQuery Explainable AI apply to?
BigQuery Explainable AI applies to a variety of models, including supervised learning models for IID data and time series models. The documentation for BigQuery Explainable AI provides an overview of the different ways of applying explainability per model. Note that each explainability method has its own way of calculation (e.g. Shapley values), which are covered more in-depth in the documentation.

Examples with BigQuery Explainable AI
In this next section, we will show three examples of how to use BigQuery Explainable AI in different ML applications:
Regression models with BigQuery Explainable AI
Let’s use a boosted tree regression model to predict how much a taxi cab driver will receive in tips for a taxi ride, based on features such as number of passengers, payment type, total payment and trip distance. Then let’s use BigQuery Explainable AI to help us understand how the model made the predictions in terms of global explainability (which features were most important?) and local explainability (how did the model arrive at each prediction?).
The taxi trips dataset comes from the BigQuery public datasets and is publicly available in the table: bigquery-public-data.new_york_taxi_trips.tlc_yellow_trips_2018.
First, you can train a boosted tree regression model.
CREATE OR REPLACE MODEL bqml_tutorial.taxi_tip_regression_modelOPTIONS (model_type='boosted_tree_regressor',input_label_cols=['tip_amount'],max_iterations = 50,tree_method = 'HIST',subsample = 0.85,enable_global_explain = TRUE) ASSELECTvendor_id,passenger_count,trip_distance,rate_code,payment_type,total_amount,tip_amountFROM`bigquery-public-data.new_york_taxi_trips.tlc_yellow_trips_2018`WHERE tip_amount >= 0LIMIT 1000000
Now let’s do a prediction using ML.PREDICT, which is the standard way in BigQuery ML to make predictions without explainability.
SELECT *FROMML.PREDICT(MODEL bqml_tutorial.taxi_tip_regression_model,(SELECT"0" AS vendor_id,1 AS passenger_count,CAST(5.85 AS NUMERIC) AS trip_distance,"0" AS rate_code,"0" AS payment_type,CAST(55.56 AS NUMERIC) AS total_amount))

But you might wonder—how did the model generate this prediction of ~11.077?
BigQuery Explainable AI can help us answer this question. Instead of using ML.PREDICT, you use ML.EXPLAIN_PREDICT with an additional optional parameter top_k_features. ML.EXPLAIN_PREDICT extends the capabilities of ML.PREDICT by outputting several additional columns that explain how each feature contributes to the predicted value. In fact, since ML.EXPLAIN_PREDICT includes all the output from ML.PREDICT anyway, you may want to consider using ML.EXPLAIN_PREDICT every time instead.
SELECT *FROMML.EXPLAIN_PREDICT(MODEL bqml_tutorial.taxi_tip_regression_model,(SELECT"0" AS vendor_id,1 AS passenger_count,CAST(5.85 AS NUMERIC) AS trip_distance,"0" AS rate_code,"0" AS payment_type,CAST(55.56 AS NUMERIC) AS total_amount),STRUCT(6 AS top_k_features))

The way to interpret these columns is:
Σfeature_attributions + baseline_prediction_value = prediction_value
Let’s break this down. The prediction_value is ~11.077, which is simply the predicted_tip_amount. The baseline_prediction_value is ~6.184, which is the tip amount for an average instance. top_feature_attributions indicates how much each of the features contributes towards the prediction value. For example, total_amount contributes ~2.540 to the predicted_tip_amount.
ML.EXPLAIN_PREDICT provides local feature explainability for regression models. For global feature importance, see the documentation for ML.GLOBAL_EXPLAIN.
Classification models with BigQuery Explainable AI
Let’s use a logistic regression model to show you an example of BigQuery Explainable AI with classification models. We can use the same public dataset as before: bigquery-public-data.new_york_taxi_trips.tlc_yellow_trips_2018.
Train a logistic regression model to predict the bracket of the percentage of the tip amount out of the taxi bill.
CREATE OR REPLACE MODEL bqml_tutorial.taxi_tip_classification_modelOPTIONS(model_type='logistic_reg',input_label_cols=['tip_bucket'],enable_global_explain=true) ASSELECTvendor_id,passenger_count,trip_distance,rate_code,payment_type,total_amount,CASEWHEN tip_amount > total_amount*0.20 THEN '20% or more'WHEN tip_amount > total_amount*0.15 THEN '15% to 20%'WHEN tip_amount > total_amount*0.10 THEN '10% to 15%'ELSE '10% or less'END AS tip_bucketFROM`bigquery-public-data.new_york_taxi_trips.tlc_yellow_trips_2018`WHERE tip_amount >= 0LIMIT 1000000
Next, you can run ML.EXPLAIN_PREDICT to get both the classification results and the additional information for local feature explainability. For global explainability, you can use ML.GLOBAL_EXPLAIN. Again, since ML.EXPLAIN_PREDICT includes all the output from ML.PREDICT anyway, you may want to consider using ML.EXPLAIN_PREDICT every time instead.
SELECT *FROMML.EXPLAIN_PREDICT(MODEL bqml_tutorial.taxi_tip_classification_model,(SELECT"0" AS vendor_id,1 AS passenger_count,CAST(5.85 AS NUMERIC) AS trip_distance,"0" AS rate_code,"0" AS payment_type,CAST(55.56 AS NUMERIC) AS total_amount),STRUCT(6 AS top_k_features))

Similar to the regression example earlier, the formula is used to derive the prediction_value:
Σfeature_attributions + baseline_prediction_value = prediction_value
As you can see in the screenshot above, the baseline_prediction_value is ~0.296. total_amount is the most important feature in making this specific prediction, contributing ~0.067 to the prediction_value, though followed by trip_distance. The feature passenger_count contributes negatively to prediction_value by -0.0015. The features vendor_id, rate_code, and payment_type did not seem to contribute much to the prediction_value.
You may wonder why the prediction_value of ~0.389 doesn’t equal the probability value of ~0.359. The reason is that unlike for regression models, for classification models, prediction_value is not a probability score. Instead, prediction_value is the logit value (i.e., log-odds) for the predicted class, which you could separately convert to probabilities by applying the softmax transformation to the logit values. For example, a three-class classification has a log-odds output of [2.446, -2.021, -2.190]. After applying the softmax transformation, the probability of these class predictions is [0.9905, 0.0056, 0.0038].
Time-series forecasting models with BigQuery Explainable AI

Explainable AI for forecasting provides more interpretability into how the forecasting model came to its predictions. Let’s go through an example of forecasting the number of bike trips in NYC using the new_york.citibike_trips public data in BigQuery.
You can train a time-series model ARIMA_PLUS:
CREATE OR REPLACE MODEL bqml_tutorial.nyc_citibike_arima_modelOPTIONS(model_type = 'ARIMA_PLUS',time_series_timestamp_col = 'date',time_series_data_col = 'num_trips',holiday_region = 'US') ASSELECTEXTRACT(DATE from starttime) AS date,COUNT(*) AS num_tripsFROM`bigquery-public-data.new_york.citibike_trips`GROUP BY dateNext, you can first try forecasting without explainability using ML.FORECAST:SELECT*FROMML.FORECAST(MODEL bqml_tutorial.nyc_citibike_arima_model,STRUCT(365 AS horizon, 0.9 AS confidence_level))
This function outputs the forecasted values and the prediction interval. Plotting it in addition to the input time series gives the following figure.

But how does the forecasting model arrive at its predictions? Explainability is especially important if the model ever generates unexpected results.
With ML.EXPLAIN_FORECAST, BigQuery Explainable AI provides extra transparency into the seasonality, trend, holiday effects, level (step) changes, and spikes and dips outlier removal. In fact, since ML.EXPLAIN_FORECAST includes all the output from ML.FORECAST anyway, you may want to consider using ML.EXPLAIN_FORECAST every time instead.
SELECT*FROMML.EXPLAIN_FORECAST(MODEL bqml_tutorial.nyc_citibike_arima_model,STRUCT(365 AS horizon, 0.9 AS confidence_level))

Compared to the previous figure which only shows the forecasting results, this figure shows much richer information to explain how the forecast is made.
First, it shows how the input time series is adjusted by removing the spikes and dips anomalies, and by compensating the level changes. That is:
time_series_adjusted_data = time_series_data - spikes_and_dips - step_changes
Second, it shows how the adjusted input time series is decomposed into different components such as both weekly and yearly seasonal components, holiday effect component and trend component. That is
time_series_adjusted_data = trend + seasonal_period_yearly + seasonal_period_weekly + holiday_effect + residual
Finally, it shows how these components are forecasted separately to compose the final forecasting results. That is:
time_series_data = trend + seasonal_period_yearly + seasonal_period_weekly + holiday_effect
For more information on these time series components, please see the documentation here.
Conclusion
With the GA of BigQuery Explainable AI, we hope you will now be able to interpret your machine learning models with ease.
Thanks to the BigQuery ML team, especially Lisa Yin, Jiashang Liu, Amir Hormati, Mingge Deng, Jerry Ye and Abhinav Khushraj. Also thanks to the Vertex Explainable AI team, especially David Pitman and Besim Avci.
More Relevant Stories for Your Company

NLP in Healthcare Can Unlock Clinical Insights beyond Typical Data Format Barriers
Aches and pains. What, if anything, is the difference between those? And do you know a “myocardial infarction” from a “heart attack”? What about an “MI”? Is that shorthand, or part of the address of a hospital in Michigan? For people, it can be easy to understand the distinctions and

How Google Cloud Helps RecruitMilitary Connect More Veterans to Jobs
Editor’s note: Today’s post is by Mike Francomb, Senior Vice President of Technology, RecruitMilitary and a U.S. Army Veteran. RecruitMilitary is a wholly owned subsidiary of Bradley-Morris, Inc. (BMI), the largest military-focused recruiting company in the United States. RecruitMilitary uses Google Cloud Talent Solution to power its job search experience and

Google’s Intelligent Products Essentials Assist Manufacturers in Product Development Journey
Expectations for both consumer and commercial products have changed. Consumers want products that evolve with their needs, adapt to their preferences, and stay up-to-date over time. Manufacturers, in turn, need to create products that provide engaging customer experiences not only to better compete in the marketplace, but also to provide

Building Unique Customer Experiences with Speed & Scale: Sprinklr & Google Cloud
Enterprises are increasingly seeking out technologies that help them create unique experiences for customers with speed and at scale. At the same time, customers want flexibility when deciding where to manage their enterprise data, particularly when it comes to business-critical applications. That’s why I’m thrilled that Sprinklr, the unified customer
