





This Chart, from Home Depot, Dramatically Demonstrates the Power of a Cloud Data Warehouse

7607
Of your peers have already read this article.
2:30 Minutes
The most insightful time you'll spend today!
The Home Depot (THD) is the world’s largest home-improvement chain, growing to more than 2,200 stores and 700,000 products in four decades. Much of that success was driven through the analysis of data. This included developing sales forecasts, replenishing inventory through the supply chain network, and providing timely performance scorecards.
However, to compete in today’s business world, THD has taken this data-driven approach to an entirely new level of success on Google Cloud, providing capabilities not practical on legacy technologies.
The pressures of contemporary growth that drove much of the work are familiar to many businesses. In addition to everything it was doing, THD needed to better integrate the complexities in its related businesses, like tool rental and home services. It needed to better empower teams, including a fast-growing data analysis staff and store associates with mobile computing devices. It wanted to better use online commerce and artificial intelligence to meet customer needs, while maintaining better security.
Even before addressing these new challenges, THD’s existing on-premises data warehouse was under stress as more data was required for analytics and data analysts were utilizing the data with increasingly complex use cases. This drove rapid growth of the data warehouse, but also created constant challenges for the team in managing priorities, performance, and cost.
In order to add capacity to the environment, it was a major planning, architecture, and testing effort. In one case, adding on-premises capacity took six months of planning and a three-day service outage. Within a year, capacity was again scarce, impacting performance and ability to execute all the reporting and analytics workloads required. The capacity refresh cycles were shrinking, and the expecations for data were growing. There had to be a better way.
Still, THD did not take its move to the cloud lightly. A large-scale enterprise data warehouse migration involves tremendous effort among people, process, and technology. After careful consideration, THD chose Google Cloud’s BigQuery for its cloud enterprise data warehouse.
BigQuery, a scalable serverless data warehouse, was better on cost, infrastructure agility, and analytics capability, driving better insights with improved performance. There are no service interruptions when capacity is added, and that capacity can be added within a week (and soon same day). It doesn’t require complex system administration, and its standard SQL support means people can easily ramp up quickly. Valuable BigQuery products like Identity and Access Management meant THD could create many separate Google Cloud projects, while ensuring that different teams weren’t interfering with each other or accessing protected data.
THD also utilizes BigQuery’s flat-rate monthly pricing model that allows teams to budget their capacity based on need and provides billing predictability. The capacity not being used by a given project is available for enterprise use. This ensures no surprises when the monthly bill arrives and provides all analytical users access to significant computing power.
While THD’s legacy data warehouse contained 450 terabytes of data, the BigQuery enterprise data warehouse has over 15 petabytes. That means better decision-making by utilizing new datasets like website clickstream data and by analyzing additional years of data.
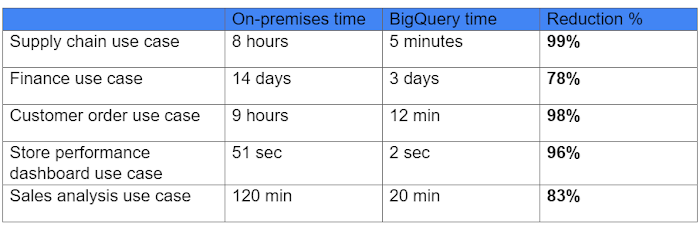
As for performance, look at this chart:
With the cloud EDW migration complete, and the legacy on-premises data warehouse retired, analysts now execute more complex and demanding workloads that they would not have been able to complete before, such as utilizing Datalab for orchestrating analytics through Python Notebooks, utilizing BigQuery ML for machine learning directly against the BigQuery data (no movement of large datasets), and AutoML to help determine the best model for predictions.
Additionally, engineers at THD have adapted BigQuery to monitor, analyze, and act on application performance data across all its stores and warehouses in real time, something that was not practical in the on-premises system.
With over 600 projects that THD now has on Google Cloud, the BigQuery story is just one of the many ways that Google Cloud is working with THD to deliver meaningful business results, every day.
The Right Datawarehouse Helps Fight Climate Change, While Improving Customer Experience

7070
Of your peers have already read this article.
4:30 Minutes
The most insightful time you'll spend today!
When you think about climate change, you might not consider a daily commute to work or a drive around town as big contributing factors. And yet, transport is the fastest growing source of CO2 emissions from fossil fuel, which in turn is the largest contributor to climate change. This is the key insight behind the mission of Spanish carbon-neutral multinational Acciona. The group, which provides sustainable solutions for infrastructure and renewable energy projects across 65 countries, launched an electric scooter sharing service called Acciona Mobility in 2018.
Aiming to contribute to the decarbonization of the transport sector while helping relieve traffic congestion within cities, Acciona Mobility enables users to rent electric scooters powered 100% by energy from renewable sources. Users can find, reserve, and rent the scooters at the tap of their mobile screens via the Acciona Mobility application and pay on the basis of minutes spent riding. The app, which is available free to download online, is also the gateway through which new users can register for the service, which welcomes anyone with a valid driver’s license for motorbikes. After having their right to drive, identity, and card details validated, citizens can start enjoying the service, available 24 hours a day, every day of the year.
“We needed to deploy a reliable infrastructure for a new service before understanding exactly what its scale and demand would be. Our strategy was to adopt a serverless architecture that can grow with us to sustain our long-term vision. This kind of thinking led us directly to Google Cloud.”
—Jose Luis Rosell, CIO Services Division, Acciona
“Acciona Mobility is exciting because it stems from our vision to make people’s lives easier in a sustainable way,” says Jose Luis Rosell, CIO of Acciona’s Services Division. “40% of the pollution near cities comes from private transportation. We want to help solve that problem with zero-carbon, electric, multimodal transportation that’s also convenient for people to use.”
However, Jose Luis says that building the appropriate IT infrastructure to bring the new service to life required external support. “We needed to deploy a reliable infrastructure for a new service before understanding exactly what its scale and demand would be. Our strategy was to adopt a serverless architecture that can grow with us to sustain our long-term vision,” he explains. “This kind of thinking led us directly to Google Cloud.”
Developing the transportation platform of the future
Because Acciona was already a Google Cloud customer, Jose Luis and his team reached the decision to develop the new service on Google Cloud with ease, as he explains: “We had a very positive experience working closely with the Google Cloud team during Acciona’s first project on Google Cloud, and that collaborative mentality is very important for us. We feel Google Cloud is a trustworthy partner that is willing to take risks with us and is flexible enough to lead us through business uncertainty with the right technology,” he says. “So we were confident that its technology and people could help us bring the Acciona Mobility service from theory to reality.”
This time, Acciona partnered with cloud consultancy Altostratus as well, to consult on a selection of Google Cloud products that would help develop the application quickly by making use of managed services. Acciona’s strategy was to launch the new services first in Madrid, where the company is headquartered, and then spread the vision across more cities later, if the idea worked out well in practice. Due to the scale of the project and its data needs, BigQuery was chosen as the primary data warehouse to store all the information related to the service, such as the location of scooters and their availability status. With all its data readily available on BigQuery, Acciona is able to run specific queries that help it to gain insights such as which urban areas have the highest volume of scooters being rented. Knowing this, Acciona can reorganize availability to make sure there are always enough scooters in that specific location.
Integrating it with Pub/Sub and Dataflow, Acciona ensures that the data generated by scooters is ingested and processed in real time so that users searching for scooters nearby, using the Acciona Mobility application on their phones, can always have up-to-date information at hand. Using Google Maps Platform APIs such as the Directions API, Acciona’s mobile app translates the geographical coordinates of scooters into an easy-to-read address displayed beside a visual map. Using Cloud SQL, Acciona automates the storage capacity management of the database as the number of scooters and active users grow.
Meanwhile, Google Cloud Armor protects the service against cyber breaches and distributed denial of service attacks to keep it running uninterrupted. In addition, Google Cloud itself helps to reinforce the cyber security measures with secure-by-default managed services, such as data encryption. “The managed services mean more resilience and more uptime, because we don’t need to worry about maintenance or external threats,“ says Jose Luis of the solutions protecting all information generated by the new service, which as CIO is a topic he holds dearly. “I face cybersecurity issues more confidently as a Google Cloud partner,” he adds.
“Today, we have data coming in every 15 seconds from 10,000 electric scooters around Europe. BigQuery and Cloud SQL-managed services help us handle that data very carefully and with precision so that our users don’t experience any lags when searching for scooters or returning them.”
—Jose Luis Rosell, CIO Services Division, Acciona
Expanding an 100% sustainable transport solution throughout Spain
Within two months of the decision to deploy Acciona Mobility on Google Cloud, the service was ready for launch, filling the streets of Madrid with 500 electric scooters that run 100% on renewable energy. By 2020, the number of scooters has grown to 10,000 and the service has scaled to multiple cities in and outside of Spain, including Lisbon, Milan, and Rome. To date, more than 3.5 million intracity rides have used the Acciona Mobility app, reducing CO2 emissions by more than 1,000 tons.
“Today, we have data coming in every 15 seconds from 10,000 electric scooters around Europe. BigQuery and Cloud SQL-managed services help us handle that data very carefully and with precision so that our users don’t experience any lags when searching for scooters or returning them,” says Jose Luis of the fast-growing scale of the project.
“Google Cloud enables us to keep our services always available and to scale quickly to respond to its growing demand. Our ratings have been very positive as a result. More importantly, our vision of transportation as a cleaner, more sustainable commodity is really spreading and resonating with the public.”
—Jose Luis Rosell, CIO Services Division, Acciona
Set to continue expanding, Acciona is using Google Kubernetes Engine to make sure the Acciona Mobility application has the computing capacity it needs to continue scaling to reach new markets and serve more users. On that note, Google operations tools (formerly Stackdriver) are also being deployed to help monitor, troubleshoot, and improve the performance of the application as it scales.
“Google Cloud enables us to keep our services always available and to scale quickly to respond to its growing demand. Our ratings have been very positive as a result. More importantly, our vision of transportation as a cleaner, more sustainable commodity is really spreading and resonating with the public,” he concludes.

Customer Voices: How Firms from Across Industries Leverage Google Cloud
DOWNLOAD CASE STUDY14111
Of your peers have already downloaded this article
1:30 Minutes
The most insightful time you'll spend today!
From powering everyday operations and accelerating application innovation, to providing tools for specific business needs and executing on big ideas, to advancing the security of technology solutions, companies from across industries have leveraged Google Cloud for business benefits.
Companies from across industries have turned to Google Cloud for transforming their business, modernizing their infrastructure, and gleaning intelligence from data. For instance:
- Johnson & Johnson achieved a 41% increase in search results from high-quality job applicants, significantly improving the company’s ability to quickly hire top talent.
- Sony Network Communications now processes 10 billion monthly queries faster, which advances data analysis.
- University College Dublin saw significant 6-figure savings by eliminating legacy hardware, software, and maintenance.
And there are many such examples. Read the collection of case studies to find out how companies from across industries and geographies leveraged Google Cloud for measurable business benefits and for solving complex problems.
Predictive Model Built on Google Cloud Helps You Get a 7-day Mosquito Forecast Report!
4767
Of your peers have already read this article.
3:00 Minutes
The most insightful time you'll spend today!
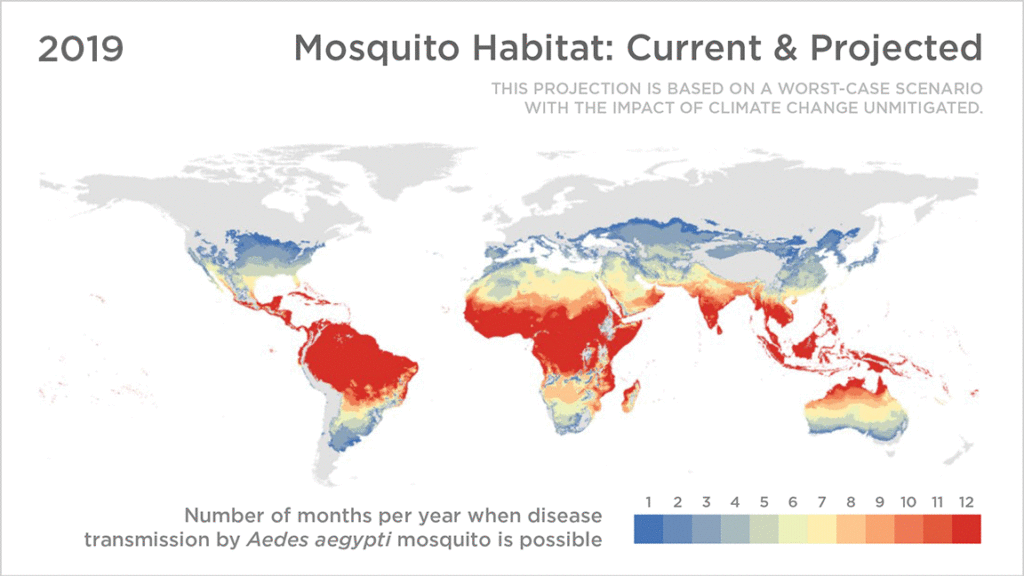
Mosquitoes aren’t just the peskiest creatures on Earth; they infect more than 700 million people a year with dangerous diseases like Zika, Malaria, Dengue Fever, and Yellow Fever. Prevention is the best protection, and stopping mosquito bites before they happen is a critical step.
SC Johnson—a leading developer and manufacturer of pest control products, consumer packaged goods, and other professional products—has an outsized impact in reducing the transmission of mosquito-borne diseases. That’s why Google Cloud was honored to team up with one of the company’s leading pest control brands, OFF!®, to develop a new publicly available, predictive model of when and where mosquito populations are emerging nationwide.
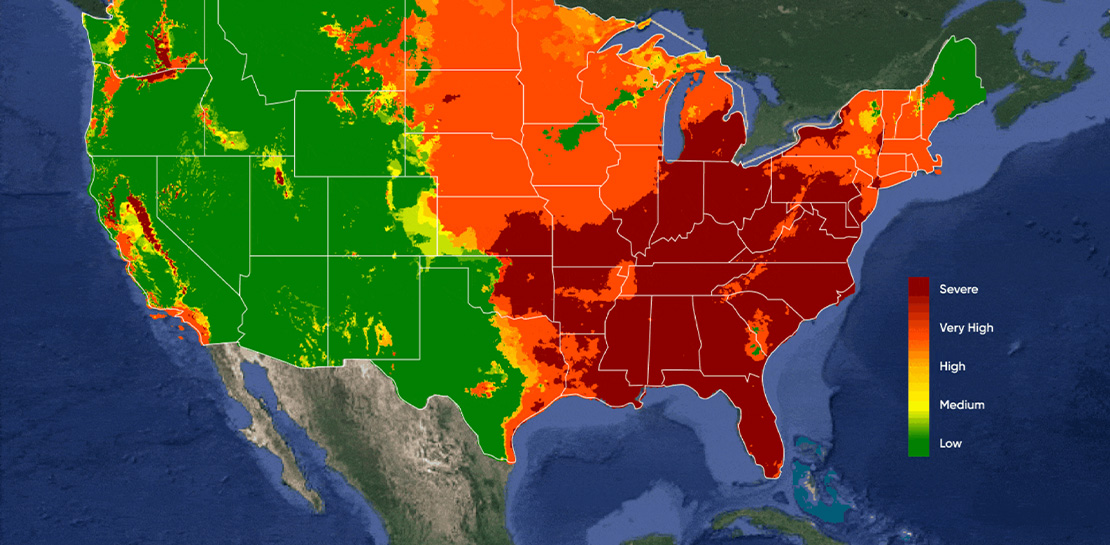
As the planet warms and weather changes, OFF! noticed month-to-month and year-to-year fluctuations in consumer habits at a regional level, due to changes in mosquito populations. Because of these rapid changes, it’s difficult for people to know when to protect themselves. The OFF!Cast Mosquito Forecast™, built on Google Cloud and available today, will predict mosquito outbreaks across the United States, helping communities protect themselves from both the nuisance of mosquitoes and the dangers of mosquito-borne diseases—with the goal of expanding to other markets, like Brazil and Mexico, in the near future.
With the OFF!Cast Mosquito Forecast™, anyone can get their local mosquito prediction as easily as a daily weather update. Powered by Google Cloud’s geospatial and data analytics technologies, OFF!Cast Mosquito Forecast is the world’s first public technology platform that predicts and shares mosquito abundance information. By applying data that is informed by the science of mosquito biology, OFF!Cast accurately predicts mosquito behavior and mosquito populations in specific geographical locations.
Starting today, anyone can easily explore OFF!Cast on a desktop or mobile device and get their local seven-day mosquito forecast for any zip code in the continental United States. People can also sign up to receive a weekly forecast. To make this forecasting tool as helpful as possible, OFF! modeled its user interface after popular weather apps, a familiar frame of reference for consumers.

The technology behind the OFF!Cast Mosquito Forecast
To create this first-of-its-kind forecast, OFF! stood up a secure and production-scale Google Cloud Platform environment and tapped into Google Earth Engine, our cloud-based geospatial analysis platform that combines satellite imagery and geospatial data with powerful computing to help people and organizations understand how the planet is changing.
The OFF!Cast Mosquito Forecast is the result of multiple data sources coming together to provide consumers with an accurate view of mosquito activity. First, Google Earth Engine extracts billions of individual weather data points. Then, a scientific algorithm co-developed by the SC Johnson Center for Insect Science and Family Health and Climate Engine experts translates that weather data into relevant mosquito information. Finally, the collected information is put into the model and distilled into a color-coded, seven-day forecast of mosquito populations. The model is applied to the lifecycle of a mosquito, starting from when it lays eggs to when it could bite a human.
The SC Johnson Center for Insect Science and Family Health is one the world’s leading entomology research centers, studying advanced science of insect biology, insect-borne disease prevention and effective product solutions for consumer use. The science behind brands like OFF! is grounded in knowledge from world-class entomologists who have devoted their careers to SC Johnson’s mission of eradicating diseases like Malaria and Zika.
“We are putting the power in consumers’ hands in providing them with a tool to help predict their exposure and prevent mosquito bites,” said Maude Meier, SC Johnson entomologist. “It’s an exciting time to be working in the field of insect science as we find new opportunities to combine science and technology, like Google Earth Engine, to be a force for good in our mission to prevent the spread of insect-borne diseases.”
It takes an ecosystem to battle mosquitos
Over the past decade, academics, scientists and NGOs have used Google Earth Engine and its earth observation data to make meaningful progress on climate research, natural resource protection, carbon emissions reduction and other sustainability goals. It has made it possible for organizations to monitor global forest loss in near real-time and has helped more than 160 countries map and protect freshwater ecosystems. Google Earth Engine is now available in preview with Google Cloud for commercial use.
Our partner, Climate Engine, was a key player in helping make the OFF!Cast Mosquito Forecast a reality. Climate Engine is a scientist-led company that works with Google Cloud and our customers to accelerate and scale the use of Google Earth Engine, in addition to those of Google Cloud Storage and BigQuery, among other tools. With Climate Engine, OFF! integrated insect data from VectorBase, an organization that collects and counts mosquitoes and is funded by the U.S. National Institute of Allergy and Infectious Diseases.
The model powering the OFF!Cast Mosquito Forecast combines three inputs—knowledge of a mosquito’s lifecycle, detailed climate data inputs, and mosquito population counts from more than 5,000 locations provided by VectorBase. The model’s accuracy was validated against precise mosquito population data collected over six years from more than 33 million mosquitoes across 141 different species at more than 5,000 unique trapping locations.
A better understanding of entomology, especially things like degree days and how they affect mosquito populations, and helping communities take action is critically important to improving public health. Learn more about OFF!Cast Mosquito Forecast and see here to learn more about Google Earth Engine on Google Cloud.
Rubin Observatory Leverages Google Cloud to Power Astronomical Research

6072
Of your peers have already read this article.
2:00 Minutes
The most insightful time you'll spend today!
This week, the Vera C. Rubin Observatory is launching the first preview of its new Rubin Science Platform (RSP) for an initial cohort of astronomers. The observatory, which is located in Chile but managed by the U.S. National Science Foundation’s NOIRLab in Tucson, AZ and SLAC in California, is jointly funded by the NSF and the U.S. Department of Energy. The platform provides an easy-to-use interface to store and analyze the massive datasets of the Legacy Survey of Space and Time (LSST), which will survey a third of the sky each night for ten years, detecting billions of stars and galaxies, and millions of supernovae, variable stars, and small bodies in our Solar System.
The LSST datasets are unprecedented in size and complexity, and will be far too large for scientists to download to their personal computers for analysis. Instead, scientists will use the RSP to process, query, visualize, and analyze the LSST data archives through a mixture of web portal, notebook, and other virtual data analysis services. An initial launch with simulated data, called Data Preview 0, builds on the Rubin Observatory’s three-year partnership with Google to develop an Interim Data Facility (IDF) on Google Cloud to prototype hosting of the massive LSST dataset. This agreement marks the first time a cloud-based data facility has been used for an astronomy application of this magnitude.
Bringing the stars to the cloud
For Data Preview 0, the IDF leverages Cloud Storage, Google Kubernetes Engine (GKE), and Compute Engine to provide the Rubin Observatory user community access to simulated LSST data in an early version of the RSP. The simulated data were developed over several years by the LSST Dark Energy Science Collaboration to imitate five years of an LSST-like survey over 300 square degrees of the sky (about 1,500 times the area of the moon). The resulting images are very realistic: they have the same instrumental characteristics, such as pixel size and sensitivity to photons, that are expected from the Rubin Observatory’s LSST Camera, and they were processed with an early version of the LSST Science Pipelines that will eventually be used to process LSST data. “This will be the first time that these workloads have ever been hosted in a cloud environment. Researchers will have an opportunity to explore an early version of this platform,” says Ranpal Gill, senior manager and head of communications at the Rubin Observatory.
Broadening access for more researchers
Over 200 scientists and students with Rubin Observatory data rights were selected to participate in Data Preview 0 from a pool of applicants that represents a wide range of demographic criteria, regions, and experience level. Participants will be supported with resources such as tutorials, seminars, communication channels, and networking opportunities—and they will be free to pursue their own science at their own pace using the data in the RSP.
“The revolutionary nature of the future LSST dataset requires a commensurately innovative system for data access and analysis paired with robust support for scientists,” says Melissa Graham, lead community scientist for the Rubin Observatory and research scientist in the astronomy department at the University of Washington. “I’m personally excited to enhance my own skills by using the RSP’s tools for big data analysis, while also helping others to learn and to pursue their LSST-related science goals during Data Preview 0.”
At the same time, the fact that the RSP is hosted in the cloud provides researchers at smaller institutions access to state-of-the-art astronomy infrastructure that is comparable to that of the largest national research centers.
The launch benefits the observatory too: the development team can learn what researchers are interested in while also testing and debugging the platform. Graham says that “the platform is still in active development so researchers using it will be able to follow along in the progress, and provide feedback on ways that we can optimize the development of the tools.”
Next steps
The LSST aims to begin the ten-year survey in 2023-24 and expects it to include 500 petabytes of data. Through the cloud, Google aims to help make this extraordinary project scalable and accessible to researchers everywhere. To learn more about Data Preview 0, watch this video.
Want to ramp up your own research in the cloud? We offer research credits to academics using Google Cloud for qualifying projects in eligible countries. You can find our application form on Google Cloud’s website or contact our sales team.
A Breakdown of Cloud-based Data Ingestion Practices

8828
Of your peers have already read this article.
3:00 Minutes
The most insightful time you'll spend today!
Businesses around the globe are realizing the benefits of replacing legacy data silos with cloud-based enterprise data warehouses, including easier collaboration across business units and access to insights within their data that were previously unseen. However, bringing data from numerous disparate data sources into a single data warehouse requires you to develop pipelines that ingest data from these various sources into your enterprise data warehouse. Historically, this has meant that data engineering teams across the organization procure and implement various tools to do so. But this adds significant complexity to managing and maintaining all these pipelines and makes it much harder to effectively scale these efforts across the organization. Developing enterprise-grade, cloud-native pipelines to bring data into your data warehouse can alleviate many of these challenges. But, if done incorrectly, these pipelines can present new challenges that your teams will have to spend their time and energy addressing.
Developing cloud-based data ingestion pipelines that replicate data from various sources into your cloud data warehouse can be a massive undertaking that requires significant investment of staffing resources. Such a large project can seem overwhelming and it can be difficult to identify where to begin planning such a project. We have defined the following principles for data pipeline planning to begin the process. These principles are intended to help you answer key business questions about your effort and begin to build data pipelines that address your business and technical needs. Each section below details a principle of data pipelines and certain factors your teams should consider as they begin developing their pipelines.
Principle 1: Clarify your objectives
The first principle to consider for pipeline development is clarify your objectives. This can be broadly defined as taking a holistic approach to pipeline development that encompasses requirements from several perspectives: technical teams, regulatory or policy requirements, desired outcomes, business goals, key timelines, available teams and their skill sets, and downstream data users. Clarifying your objectives clearly identifies and defines requirements from each key stakeholder at the beginning of the process and continually checks development against these requirements to ensure the pipelines built will meet these requirements.This is done by first clearly defining the desired end state for each project in a way that addresses a demonstrated business need of downstream data users. Remember that data pipelines are almost always the means to accomplish your end state, rather than the end state itself. An example of an effectively defined end-state is “enabling teams to gain a better understanding of our customers by providing access to our CRM data within our cloud data warehouse” rather than “move data from our CRM to our cloud data warehouse”. This may seem like a merely semantic difference, but framing the problem in terms of business needs helps your teams make technical decisions that will best meet these needs.
After clearly defining the business problem you are trying to solve, you should facilitate requirement gathering from each stakeholder and use these requirements to guide the technical development and implementation of your ingestion pipelines. We recommend gathering stakeholders from each team, including downstream data users, prior to development to gather requirements for the technical implementation of the data pipeline. These will include critical timelines, uptime requirements, data update frequency, data transformation, DevOps needs, and security, policy, or regulatory requirements by which a data pipeline must meet.
Principle 2: Build your team
The second principle to consider for pipeline development is build your team. This means ensuring you have the right people with the right skills available in the right places to develop, deploy, and maintain your data pipelines. After you have gathered your pipeline requirements, you can begin to develop a summary architecture that will be used to build and deploy your data pipelines. This will help you identify the human talent you will need to successfully build, deploy, and manage these data pipelines and identify any potential shortfalls that would require additional support from either third-party partners or new team members.
Not only do you need to ensure you have the right people and skill sets available in aggregate, but these individuals need to be effectively structured to empower them to maximize their abilities. This means developing team structures that are optimized for each team’s responsibilities and their ability to support adjacent teams as needed.
This also means developing processes that prevent blockers to technical development whenever possible, such as ensuring that teams have all of the appropriate permissions they need to move data from the original source to your cloud data warehouse without violating the concept of least privilege. Developers need access to the original data source (depending on your requirements and architecture) in addition to the destination data warehouse. Examples of this are ensuring that developers have access to develop and/or connect to a Salesforce Connected App or read access to specific Search Ads 360 data fields.
Principle 3: Minimize time to value
The third principle to consider for pipeline development is minimize time to value. This means considering the long-term maintenance burden of a data pipeline prior to developing and deploying it in addition to being able to deploy a minimum viable pipeline as quickly as possible. Generally speaking, we recommend the following approach to building data pipelines to minimize their maintenance burden: Write as little code as possible. Functionally, this can be implemented by:
1. Leveraging interface-based data ingestion products whenever possible. These products minimize the amount of code that requires ongoing maintenance and empower users who aren’t software developers to build data pipelines. They can also reduce development time for data pipelines, allowing them to be deployed and updated more quickly.
- Products like Google Data Transfer Service and Fivetran allow for managed data ingestion pipelines by any user to centralize data from SaaS applications, databases, file systems, and other tooling. With little to no code required, these managed services enable you to connect your data warehouse to your sources quickly and easily.
- For workloads managed by ETL developers and data engineers, tools like Google Cloud’s Data Fusion provide an easy-to-use visual interface for designing, managing and monitoring advanced pipelines with complex transformations.
2. Whenever interface-based products or data connectors are insufficient, use pre-existing code templates. Examples of this include templates available for Dataflow that allow users to define variables and run pipelines for common data ingestion use cases, and the Public Datasets pipeline architecture that our Datasets team uses for onboarding.
3. If neither of these options are sufficient, utilize managed services to deploy code for your pipelines. Managed services, such as Dataflow or Dataproc, eliminate the operational overhead of managing pipeline configuration by automatically scaling pipeline instances within predefined parameters.
Principle 4: Increase data trust and transparency
The fourth principle to consider for pipeline development is increase data trust and transparency. For the purposes of this document, we define this as the process of overseeing and managing data pipelines across all tools. Numerous data ingestion pipelines that each leverage different tools or are not developed under a coordinated management plan can result in “tech sprawl”, which significantly increases the management overhead of data ingestion pipelines as the quantity of data pipelines increases. This becomes especially cumbersome if you are subject to service-level agreements, or legal, regulatory, or policy requirements for overseeing data pipelines. Preventing tech sprawl is, by far, the best strategy for dealing with it by developing streamlined pipeline management processes that automate reporting. Although this can theoretically be achieved by building all of your data pipelines using a single cloud-based product, we do not recommend doing so because it prevents you from taking advantage of features and cost optimizations that come with choosing the best product for your use case.
A monitoring service such as Google Cloud Monitoring Service or Splunk that automates metrics, events, and metadata collection from various products, including those hosted in on-premise and hybrid computing environments, can help you centralize reporting and monitoring of your data pipelines. A metadata management tool such as Google Cloud’s Data Catalog or Informatica’s Enterprise Data Catalog can help you better communicate the nuances of your data so users better understand which data resources are best fit for a given use case. This significantly reduces your pipeline’s governance burden by eliminating manual reporting processes that often result in inaccuracies or lagging updates.
Principle 5: Manage costs
The fifth principle to consider for pipeline development is manage costs. This encompasses both the cost of cloud resources and the staffing costs necessary to design, develop, deploy, and maintain your cloud resources. We believe that your goal should not necessarily be to minimize cost, but rather maximizing the value of your investment. This means maximizing the impact of every dollar spent by minimizing waste in cloud resource utilization and human time. There are several factors to consider when it comes to managing costs:
- Use the right tool for the job – Different data ingestion pipelines will have different requirements for latency, uptime, transformations, etc. Similarly, different data pipeline tools have different strengths and weaknesses. Choosing the right tool for each data pipeline can help your pipelines operate significantly more efficiently. This can reduce your overall cost, free up staffing time to focus on the most impactful projects, and make your pipelines much more efficient.
- Standardize resource labeling – Implement and utilize a consistent labeling schema across all tools and platforms to have the most comprehensive view of your organization’s spending. One example is requiring all resources to be labeled by the cost center or team at time of creation. Consistent labeling allows you to monitor your spend across different teams and calculate the overall value of your cloud spending.
- Implement cost controls – If available, leverage cost controls to prevent errors that result in unexpectedly large bills.
- Capture cloud spend – Capture your spend on all cloud resource utilization for internal analysis using a cloud data warehouse and a data visualization tool. Without it, you won’t understand the context of changes in cloud spend and how they correlate with changes in business.
- Make cost management everyone’s job – Managing costs should be part of the responsibilities of everyone who can create or utilize cloud resources. To do this well, we recommend making cloud spend reporting more transparent internally and/or implementing chargebacks to internal cost centers based on utilization.
Long-term, the increased granularity in cost reporting available within Google Cloud can help you better measure your key performance indicators. You can shift from cost-based reporting (i.e. – “We spent $X on BigQuery storage last month”) to value-based reporting (i.e. – “It costs $X to serve customers who bring in $Y revenue”).
To learn more about managing costs, check out Google Cloud’s “Understanding the principles of cost optimization” white paper.
Principle 6: Leverage continually improving services
The sixth principle is leverage continually improving services. Cloud services are consistently improving their performance and stability, even if some of these improvements are not obvious to users. These improvements can help your pipelines run faster, cheaper, and more consistently over time. You can take advantage of the benefits of these improvements by:
- Automating both your pipelines and pipeline management: Not only should data pipelines be automated, but almost all aspects of managing your pipelines can also be automated. This includes pipeline/data lineage tracking, monitoring, cost management, scheduling, access management and more. This helps reduce long-term operational costs of each data pipeline that can significantly alter your value proposition and prevent any manual configurations from negating the benefits of later product improvements.
- Minimizing pipeline complexity whenever possible: While ingestion pipelines are relatively easy to develop using UI-based or managed services, they also require continued maintenance as long as they are in use. The most easily maintained data ingestion pipelines are typically the ones that minimize complexity and leverage automatic optimization capabilities. Any transformation in a data ingestion pipeline is a manual optimization of the pipeline that may struggle to adapt or scale as the underlying services improve. You can minimize the need for such transformations by building ELT (extract, load, transform) pipelines rather than ETL (extract, transform, load) pipelines. This pushes transformations down to the data warehouse that is use a specifically optimized query engine to transform your data rather than manually configured pipelines.
Next steps
If you’re looking for more information about developing your cloud-based data platform, check out our Build a modern, unified analytics data platform whitepaper. You can also visit our data integration site to learn more and find ways to get started with your data integration journey.
Once you’re ready to begin building your data ingestion pipelines, learn more about how Cloud Data Fusion and Fivetran can help you make sure your pipelines address these principles.
More Relevant Stories for Your Company

Seven-Eleven Japan Leverages Google Cloud’s Performance and Speed for Real-time Business Insights
With the rise of technologies like smartphones, retailers have felt the pressure to meet evolving consumer needs and expectations. Seven-Eleven Japan(“SEJ”) has long been on the forefront of this thanks to the way they develop and invest in IT. However, in recent years, Japan’s leading convenience store chain has struggled

Largest Beauty Retailer in the US Powers Digital Transformation with Google Cloud Smart Analytics
Digital technology offers increasing flexibility and choice to consumers. As a result, the retail industry is dramatically shifting toward more tailored and personalized experiences for shoppers, and businesses are rethinking how they deliver value to customers. This couldn’t be more true for the beauty retailing industry where leading companies are

Best Practices for ML Engineering: 43 Rules from the World’s Best
To make great products: do machine learning like the great engineer you are, not like the great machine learning expert you aren’t. Most of the problems you will face are, in fact, engineering problems. Even with all the resources of a great machine learning expert, most of the gains come

Google Cloud and Univision Partnership to Up the Ante in UX for Spanish-speaking Audience
The past year has given everyone lots to think about—about our priorities as people and as businesses. As the world retreated behind closed doors, we saw how shared interests and experiences can bring us together. As the world grappled with a common enemy, we witnessed just how differently individuals, communities
