





AirAsia Flies High With Data Analytics and AI

6649
Of your peers have already read this article.
11:30 Minutes
The most insightful time you'll spend today!
AirAsia’s vision is simple: allow everyone to fly. Founded in 2001, the airline and sister company AirAsia X have grown to service 150+ destinations in 25 markets, using 274 aircraft to operate 11,000+ weekly flights from 23 hubs across the region. While the airline is known as a provider of low-cost airfares to locations across Asia, this is only one part of its value proposition. AirAsia also aims to deliver innovative, personalized products and services that meet the needs of each of its passengers.
Technology is key to AirAsia’s success and, with strong support from Group Chief Executive Officer Tony Fernandes, in 2016 the airline began a five-year program to become a data-first business and a digital airline.
“We wanted to better ensure we were using data correctly to become more agile, efficient, and customer oriented,” says Lye Kong Wei, Chief of Data Science, Group Head at AirAsia.
AirAsia needed technologies and services that could capture, process, analyze, and report on data, while delivering value for money and meeting its speed and availability requirements. The airline also wanted to minimize infrastructure management and system administration demands on its technology team.
“We knew data was a big part of making decisions in the future. So we needed a platform that could scale to meet our growing appetite for it. Google Cloud—in particular BigQuery—was ideal for this task.”
—Lye Kong Wei, Chief of Data Science, Group Head, AirAsia
Google Cloud the best fit
AirAsia realized only a cloud service could meet its needs and began evaluating the market. The airline then conducted a proof of concept and found Google Cloud was the best fit for its business. It was already familiar with Google Cloud, having deployed G Suite collaboration and productivity applications to its workforce in all countries except China. According to Kong Wei, products such as Forms, Docs, Sheets, and Gmail delivered a considerable improvement in collaboration between various departments, as well as streamlining and automating a range of processes.
The business was particularly excited by the potential of the BigQuery analytics data warehouse to power its digital transformation. “We knew data was a big part of making decisions in the future,” says Kong Wei. “So we needed a platform that could scale to meet our growing appetite for it. Google Cloud—in particular BigQuery—was ideal for this task.”
“With BigQuery, we could process queries and requests much faster than previously and tackle more complex problems.”
—Lye Kong Wei, Chief of Data Science, Group Head, AirAsia
The AirAsia technology team was impressed by the ease and flexibility with which it could extract, transform, and load customer data from its systems, websites, and mobile applications into BigQuery for analysis. Data, reports, and dashboards were delivered and visualized through Google Data Studio.
BigQuery also scaled seamlessly to support data growth and, as a managed service, required minimal administration from the airline’s technology team. “In addition, with BigQuery, we could process queries and requests much faster than previously and tackle more complex problems,” says Kong Wei. “As a result, we could be more innovative about realizing opportunities,” he adds, citing the benefits of being able to view and understand historical measures of booking curves—a measure of how long it took customers to book before a flight. This improves the airline’s ability to manage revenues.
A broad ecosystem
BigQuery and Data Studio are just two components of a broad ecosystem—powered largely by Google Cloud services—deployed by AirAsia. Pub/Sub provides a scalable message queue that enables AirAsia developers to integrate systems hosted on Google Cloud or externally. Apache Airflow enables the business to create, schedule, and monitor workflows, while Cloud Composer manages the dependencies of PHP and related libraries. App Engine allows AirAsia personnel to develop and host web applications. “Thanks to App Engine, we’ve easily been able to create new applications, services, and APIs powered by the data we have been collecting,” says Kong Wei.
AirAsia is also running the middleware for its APIs in a managed Google Kubernetes Engine environment for increased scalability, resource optimization, and reliability, while Cloud Storage provides storage for data from a range of systems and sources. Dataflow enables the business to transform and process data in stream and batch modes from its website search page as customers look for flights.
“With a minimal number of people involved, we can very quickly transform an idea or thought process into a deliverable. Prior to Google Cloud, bringing those ideas to fruition would have been impossible.”
—Lye Kong Wei, Chief of Data Science, Group Head, AirAsia
Faster deployment and testing
The stability of Google Cloud service means AirAsia has a reliable base from which to launch new products and features. “If we have consistent reliability from our core systems—and Google Cloud incorporates monitoring tools such Cloud Monitoring that enable us to identify issues quickly—developers and product engineers can focus on turning ideas into reality,” says Kong Wei. “With a minimal number of people involved, we can very quickly transform an idea or thought process into a deliverable. Prior to Google Cloud, bringing those ideas to fruition would have been impossible.”
Robust security
AirAsia is also relying on Security Health Analytics, a product that integrates with Security Command Center, to identify misconfigurations and compliance violations in its Google Cloud resources and take action. Security Health Analytics ensures the airline’s budgets go to keeping customers’ travel costs low rather than recovering from security breaches.
The product enables AirAsia to check that resources are configured properly and are compliant with CIS benchmarks as its critical workloads run in Google Kubernetes Engine and App Engine.
“Being able to go to the new Security Health Analytics dashboard eliminates the guesswork of what we have running and if it is secure,” says Muhammad Faeez Bin Azmi, Information Security and Automation Solution Architect. “Now anyone on our team, even non-security professionals, can go to this dashboard and see a list of the misconfigured assets and compliance violations across all of our Google Cloud resources. We can also see the severity of misconfigurations, which helps us prioritize our response.”
“Security Health Analytics has really helped us reduce the amount of time we spend trying to figure out what’s wrong with our resources. It’s allowed us to use our time more effectively to identify and resolve more security issues than we could before.”
A new identity solution
AirAsia had also used a legacy on-premises directory for many years. However, as the company grew and expanded to new markets and regions, it had to manage multiple servers across a number of on-premises data centers and the public cloud, which proved costly and time-consuming.
Its Allstars—the airline’s name for its employees—needed to easily access a number of legacy on-premises apps in addition to a growing number of SaaS apps. As a business, it also needed a more seamless integration between its HR system of record and its identity solution for user provisioning and life cycle management. Solving these challenges with its existing on-premises directory was simply not feasible.
AirAsia brought up its identity concerns with the Google Cloud team, and after a number of conversations, decided to deploy Cloud Identity, Google’s cloud-based Identity and Access Management solution, to help address the identity challenges it was facing.
The airline chose Cloud Identity for a number of reasons—first, it was eager to move to the cloud as quickly as possible. Moving identity management to the cloud was a key enabler of this and the airline’s broader digital transformation. Managing identities from the cloud also enabled the airline to have a single identity and set of credentials for each employee, which they could use to access all the applications they need to be productive, both in the cloud and on-premises.
In addition, deploying Cloud Identity was a key step towards enabling the zero trust security model, which the airline felt was the best approach to strengthen its security posture and fight modern threats. Cloud Identity also integrated seamlessly with its existing technologies, which include not only Google Cloud products like G Suite and Chrome OS but also third-party tools like Citrix, Papercut, and others.
And finally, Cloud Identity offered significant cost and resource savings. With Cloud Identity in place, AirAsia’s IT department could spend less time worrying about managing multiple on-premises directory servers and and could instead focus on delivering value to Allstar employees.
Machine learning employed to increase ancillary revenue
In March 2018, AirAsia established the groundwork to use machine learning to optimize pricing for a range of services and began by using AI Platform to sort and predict demand for ancillary services such as baggage, seats, and meals. “By using AI Platform, we can sort based on data about history to predict the future,” says Kong Wei.
Dialogflow in wide use
With Google Cloud well established within the business, AirAsia is using Dialogflow, a voice and conversational interface development suite (and one of the core components of Contact Center AI) that enables businesses to create engaging AI powered voice- and text-based interfaces such as chatbots and voice apps—to streamline operations and reduce costs
“Tony Fernandes, our Group Chief Executive Officer, motivated us to create a range of metrics that would enable us to respond more quickly and efficiently to customers,” says Yuashini Vellasamy, Product Manager at AirAsia.
This resulted in the initial deployment of Dialogflow in AirAsia’s operational areas, from crew scheduling to internal business tasks.
With Dialogflow, AirAsia is able to provide pilots, crew, catering, and other teams with flight times, capacity and any other relevant information about their assignments. Another bot accepts medical certificates and updates from pilots and crew members unable to make rostered assignments and switches those assignments to other pilots and crews. “This improves our on-time performance and operational efficiency, as we are able to optimize the creation of crew schedules,” says Vellasamy.
AirAsia also uses Dialogflow to power a “safety bot” for airport ground staff. “We tried a lot of tools to encourage staff to advise us when they saw a safety issue—but employee usage was low,” says Vellasamy. “However, when we set up the safety bot, which asks users just four questions about an issue they have observed, we saw an increase in employee interaction, which helps ensure proper safety measures.
Beyond crew optimization and overall safety, AirAsia’s HR department in Asia uses a Dialogflow-powered bot to run a post-orientation engagement program for new employees. The bot follows up with employees about issues from parking to AirAsia’s onboarding buddy program, saving HR employees time from scheduling one-on-one meetings. Dialogflow also powered an employee satisfaction survey of 3,000 team members, resulting in a 30% increase in response rate compared to the previous year.
One of Dialogflow’s benefits is its language coverage, which the airline’s marketing team uses to target customers and prospects across a region with diverse languages and cultures. “For weekly campaigns and promotions, our sales and marketing teams simply update the campaign materials and the changes are reflected automatically in Dialogflow and consequently to users,” says Vellasamy. “This enables us to quickly scale and reach our customers globally.”
An upward trajectory
AirAsia is poised to reap further benefits from Google Cloud as its deployment matures. “On the data side, we’re more advanced, while on the application and programming side we have a long way to go,” says Kong Wei. “We’re on a trajectory upwards—we’re looking at a lot of new ideas and how to embrace and deploy them so we can further our data-first and digital airline agendas.”
6425
Of your peers have already watched this video.
1:30 Minutes
The most insightful time you'll spend today!
Value Realization with Google Cloud for Retail SAP Data
Retail engagements have changed drastically over the last few years, and by the virtue of COVID-19 pandemic, retail data and customers’ expectations plummeted. To drive value and transformation across the entire value-chain retailers can make most of Google Cloud’s secure, reliable IaaS by migrating their SAP systems and taking advantage of integrations, insights and innovations. In times of change retail companies can gain maximum visibility of SAP data unlocking Google Cloud’s infrastructure modernization and Big Data and analytics capabilities. Watch the video to understand how Google Cloud and SAP partnership is a golden handshake for retail businesses’ future.
Making Streaming Analytics Simpler and More Cost-Effective With Cloud Dataflow

3884
Of your peers have already read this article.
8:30 Minutes
The most insightful time you'll spend today!
Streaming analytics helps businesses to understand their customers in real time and adjust their offerings and actions to better serve customer needs. It’s an important part of modern data analytics, and can open up possibilities for faster decisions.
For streaming analytics projects to be successful, the tools have to be easy to use, familiar, and cost-effective. Since its launch in 2015, Cloud Dataflow, Google’s fully managed streaming analytics service, has been known for its powerful API available in Java and Python. Businesses have almost unlimited customization capabilities for their streaming pipelines when they use these two languages, but these capabilities come at the cost of needing programming skills that are sometimes hard to find.
To advance Google Cloud’s streaming analytics further, Google Cloud is announcing new features available in the public preview for Cloud Dataflow SQL, as well as the general availability of Cloud Dataflow Flexible Resource Scheduling (FlexRS) for a very cost-effective way of batch processing of events. These new features make streaming analytics easier and more accessible to data engineers, particularly those with database experience.
Here’s more detail about each of these new features:
Cloud Dataflow SQL to create streaming (and batch) pipelines using SQL
We know that SQL is the standard for defining data transformations, and that you want more GUI-based tools for creating pipelines. With that in mind, several months ago we launched a public preview of Cloud Dataflow SQL, an easy way to use SQL queries to develop and run Cloud Dataflow jobs from the BigQuery web UI. Today, we are launching several new features in Cloud Dataflow SQL, including Cloud Storage file support and a visual schema editor.
Cloud Dataflow SQL allows you to join Cloud Pub/Sub streams with BigQuery tables and Cloud Storage files. It also provides several additional features:
- Using Streaming SQL extensions for defining time windows and calculating window-based statistics;
- Integration with Cloud Data Catalog for storing the schema of Cloud Pub/Sub topics and Cloud Storage file sets—a key enabler for using SQL with streaming messages;
- A simple-to-use graphical editor available in the BigQuery web UI. If you are familiar with BigQuery’s SQL editor, you can create Cloud Dataflow SQL jobs.
To switch the BigQuery web UI to Cloud Dataflow SQL editing mode, open the BigQuery web UI, go to More>Query settings and select “Cloud Dataflow” as the query engine.
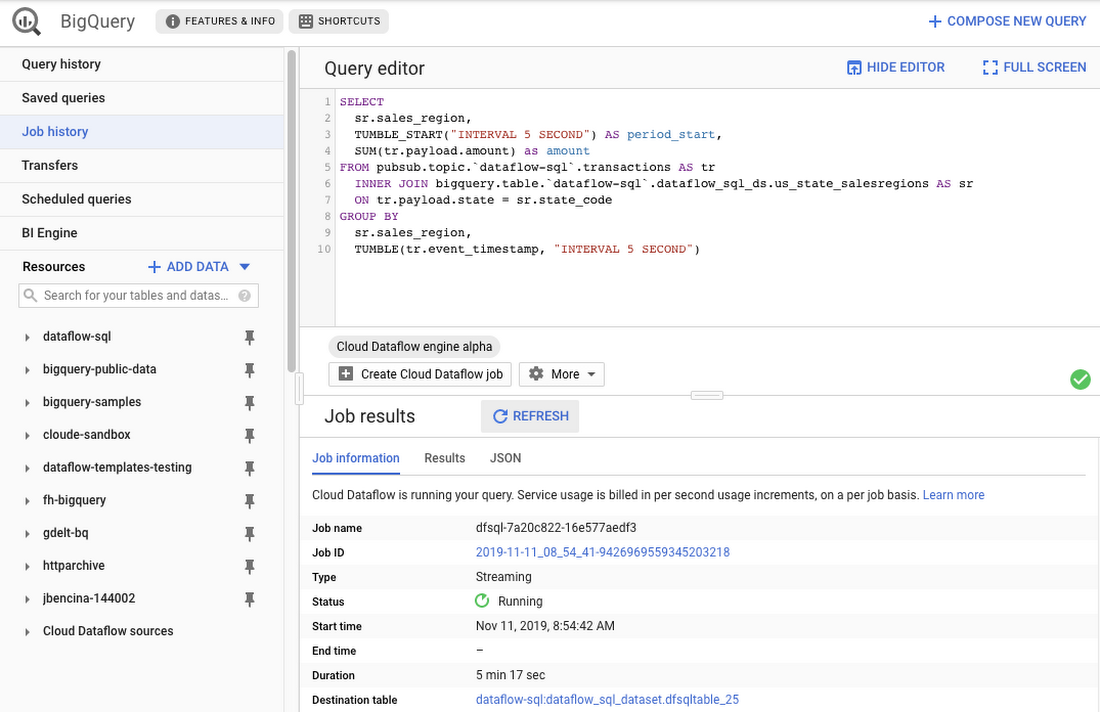
As an example, let’s say you have a Cloud Pub/Sub stream of sales transactions, and you want to build a real-time dashboard for the sales managers of your organization showing them the up-to-date stats of the sales in their regions. You can accomplish this in a few steps: write a SQL statement like the following one, launch a Cloud Dataflow SQL job, direct the output to a BigQuery table, then use one of the many supported dashboarding tools, including Google Sheets, Data Studio, and others, to visualize the results.
SELECTsr.sales_region,TUMBLE_START("INTERVAL 5 SECOND") AS period_start,SUM(tr.payload.amount) as amountFROM pubsub.topic.`dataflow-sql`.transactions AS trINNER JOIN bigquery.table.`dataflow-sql`.dataflow_sql_ds.us_state_salesregions AS srON tr.payload.state = sr.state_codeGROUP BYsr.sales_region,TUMBLE(tr.event_timestamp, "INTERVAL 5 SECOND")
In this example, we are joining the “transactions” Cloud Pub/Sub topic in the “dataflow-sql” project with a metadata table in BigQuery called “us_state_salesregions.” This table contains a mapping between the state codes (present in the “transactions” Cloud Pub/Sub topic) and the sales regions “Region_1”, “Region_2”, .., “Region_N” that are relevant to the sales managers in our example organization. In addition to the join, we’ll do a streaming aggregation of our data, using one of the several windowing functions supported by Cloud Dataflow. In our case, we will use TUMBLE windows, which will divide our stream into fixed five-second time intervals, group all the data in those time windows by the sales_region field, and calculate the sum of sales in the sales region. We also want to preserve the start of each time window, via TUMBLE_START("INTERVAL 5 SECOND"), to plot sales amounts as a time series.
To start a Cloud Dataflow job, click on “Create Cloud Dataflow job” in the BigQuery web UI.
When data starts flowing into the destination table, it will contain three fields: the sales_region, the timestamp of the period start, and the amount of sales.
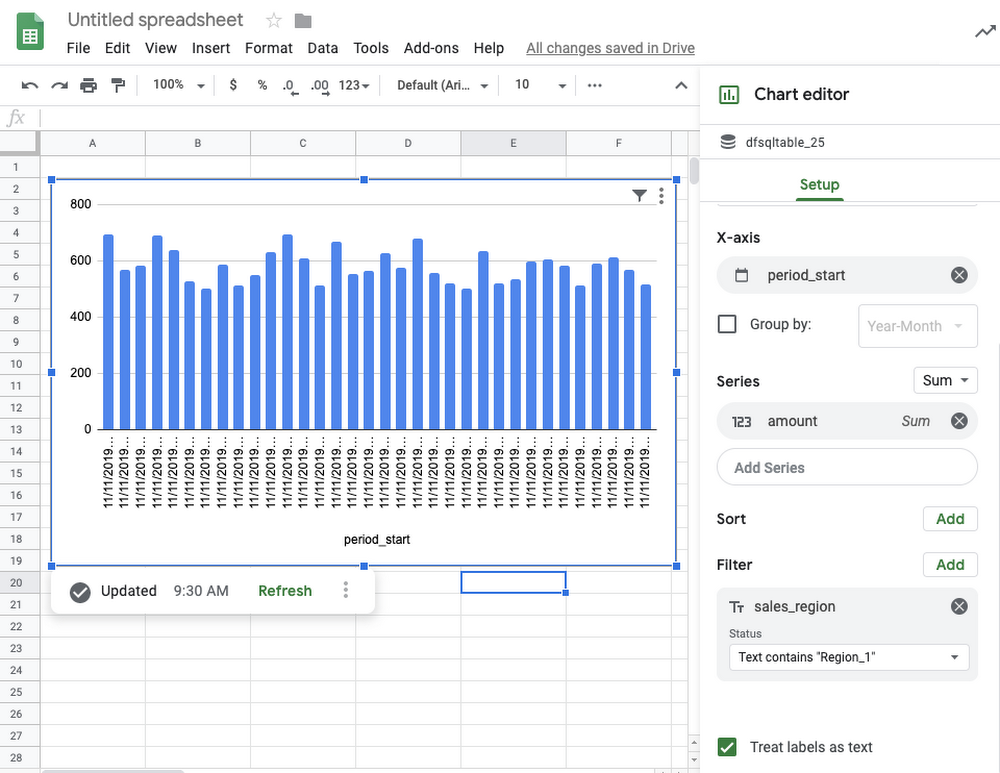
In the next step, we will create a BigQuery Connected Sheet that shows a column chart of sales in “Region_1” over time. Select the destination BigQuery table in the nav tree. In our case, it’s the dfsqltable_25 table.
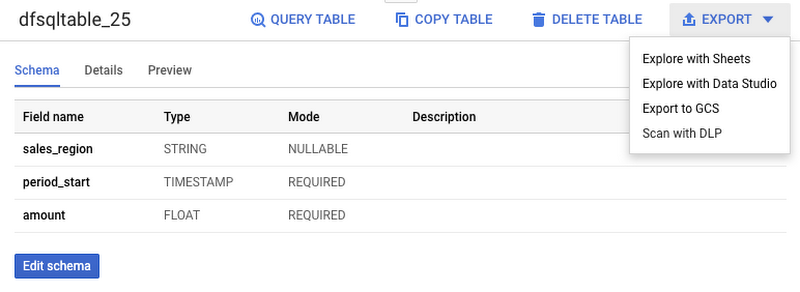
Then, select Export>Explore with Sheets to chart your data. Do it from the tab where your BigQuery table is shown, and not from the tab where your original Cloud Dataflow SQL was. In Sheets, create the column chart using the data connection to BigQuery, and choose period_start for the X-axis, amount as your data series, and add a sales_region filter. This is all you have to do to build a chart in Sheets that visualizes streaming data.
Mixing and joining data in Cloud Pub/Sub and BigQuery helps solve many real-time dashboarding cases, but quite a few customers have also asked for support of their Cloud Storage files to join those files with events in Cloud Pub/Sub or with tables in BigQuery. This is now possible in Dataflow SQL, enabled by our integration with Data Catalog’s Cloud Storage file sets.
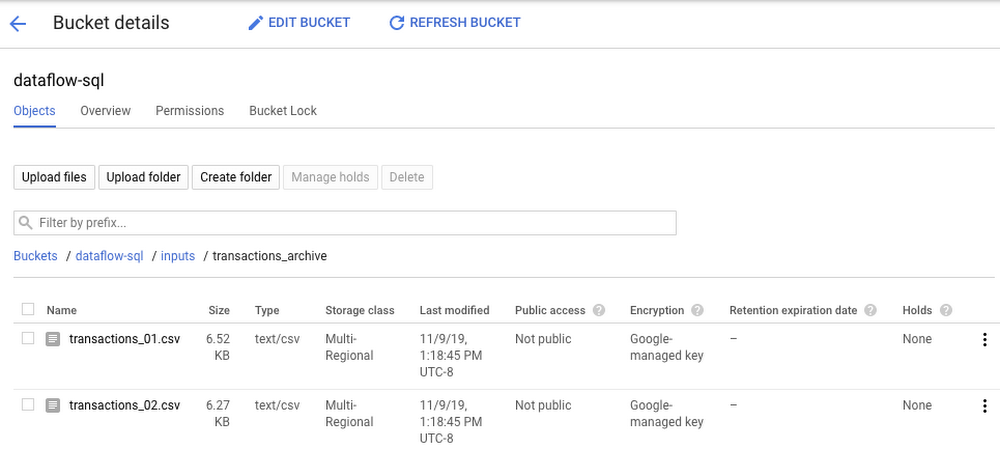
In the following example, you’ll see an archive of transactions stored in CSV files in the “transactions_archive” Cloud Storage bucket.
Two gcloud commands can define a Cloud Storage file set and entry group in Data Catalog.
#Create a GCS entrygroupgcloud beta data-catalog entry-groups create transactions_archive_eg --location=us-central1#Create the filesetgcloud beta data-catalog entries create transactions_archive_fs --location=us-central1 --entry-group=transactions_archive_eg --gcs-file-patterns=gs://dataflow-sql/inputs/transactions_archive/*.csv --description="Historical Archive of Transactions"
Notice how we defined the file pattern “gs://dataflow-sql/inputs/transactions_archive/*.csv” as part of the file set entry definition. This pattern is what will allow Cloud Dataflow to find the CSV files once we write the SQL statement that references this file set.
We can even specify the schema of this transactions_archive_fs file set using a GUI editor. For that, go to the BigQuery web UI (make sure it is running in Cloud Dataflow mode), select “Add Data” in the left navigation and choose “Cloud Dataflow sources.” Search for your newly added Cloud Storage file set and add it to your active datasets in the BigQuery UI.
This will allow you to edit the schema of your file set after you select it in the nav tree. The “Edit schema” button is right there on the “Schema” tab. The visual schema editor is new and works for both Cloud Storage file sets as well as for Cloud Pub/Sub topics.
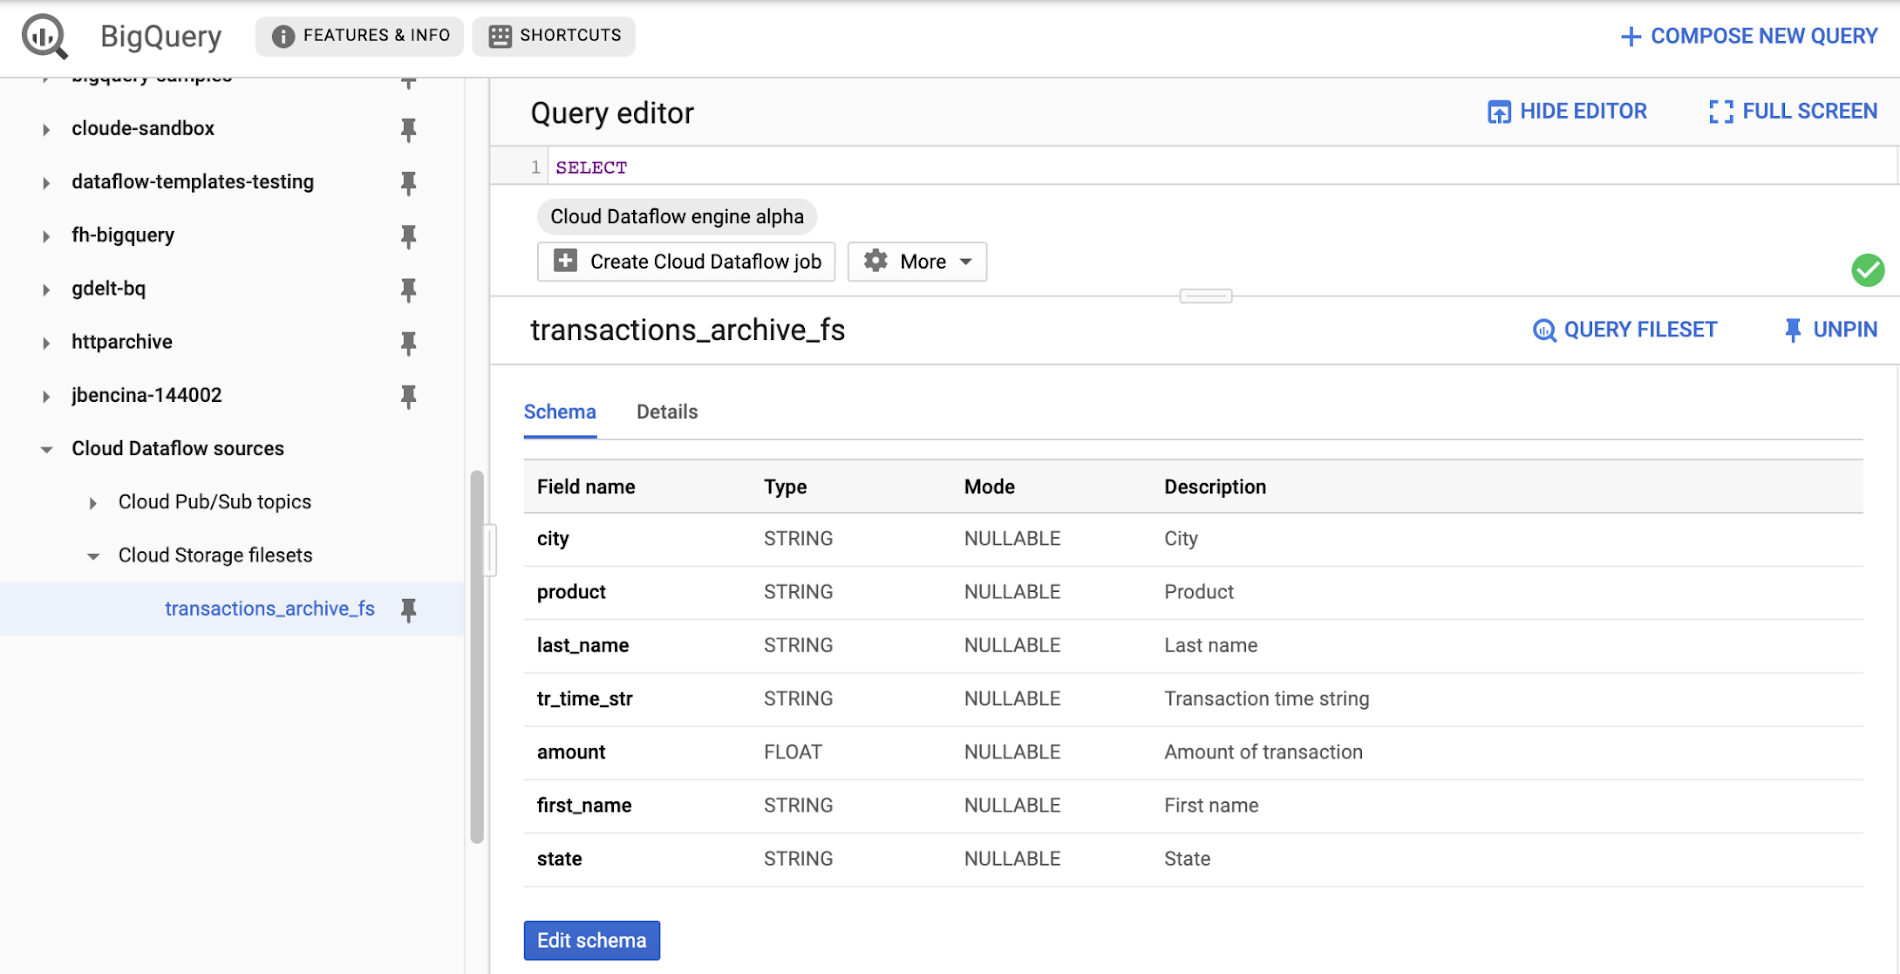
Once you’ve registered the file set in Data Catalog and defined a schema for it, you can query it in Cloud Dataflow SQL. In the next example, we’ll join the transactions archive in Cloud Storage with the metadata mapping table in BigQuery.
SELECTsr.sales_region,TUMBLE_START("INTERVAL 5 SECOND") AS period_start,SUM(tr.amount) as amountFROM datacatalog.entry.`dataflow-sql`.`us-central1`.transactions_archive_eg.transactions_archive_fs AS trINNER JOIN bigquery.table.`dataflow-sql`.dataflow_sql_ds.us_state_salesregions AS srON tr.state = sr.state_codeGROUP BYsr.sales_region,TUMBLE(CAST(tr.tr_time_str AS TIMESTAMP), "INTERVAL 5 SECOND")
Notice how similar this SQL statement is to the one that queries Cloud Pub/Sub. The TUMBLE window function even works on Cloud Storage files, although we will define the windows based on a field “tr_time_str” that is inside the files (the Cloud Pub/Sub SQL statement used the tr.event_timestamp attribute of the Cloud Pub/Sub stream). The only other difference is the reference to the Cloud Storage file set. We accomplish this by specifying datacatalog.entry.`dataflow-sql`.`us-central1`.transactions_archive_eg.transactions_archive_fs AS tr
Because both of the job inputs are bounded (batch) sources, Cloud Dataflow SQL will create a batch job (instead of a streaming job created for the first SQL statement using a Cloud Pub/Sub source) which will join your Cloud Storage files with the BigQuery table, and write the results back to BigQuery.
And now you have both a streaming pipeline feeding your real-time dashboard from a Cloud Pub/Sub topic, as well as a batch pipeline capable of onboarding historical data from CSV files. Check out the SQL Pipelines tutorial to start applying your SQL skills for developing streaming (and batch) Cloud Dataflow pipelines.
FlexRS for cost-effective batch processing of events
While real-time streaming processing is an exciting use case that’s growing rapidly, many streaming practitioners know that every stream processing system needs a sprinkle of batch processing (as you saw in the SQL example). When you bootstrap a streaming pipeline, you usually need to onboard historical data, and this data tends to reside in files stored in Cloud Storage. When streaming events need to be reprocessed due to changes in business logic (i.e., time windows get readjusted, or new fields are added), this reprocessing is also better done in batch mode.
The Apache Beam SDK and the Cloud Dataflow managed service are well-known in the industry for their unified API approach to batch and streaming analytics. The same Cloud Dataflow code can run in either mode with just minimal changes (usually replacing the data source from Cloud Pub/Sub to Cloud Storage). Remember our SQL example, where switching the SQL statement from a streaming source to a batch source was no trouble at all? And while it’s easy to go back and forth between streaming and batch processing in Cloud Dataflow, an important factor influencing the processing choice is cost. Customers who gravitate to batch processing have always looked to find the right balance between the speed of execution and costs. In many cases, that may mean you can be flexible with the amount of time it takes to process a dataset if the overall cost of processing is reduced in a significant fashion.
Our new Cloud Dataflow FlexRS feature reduces batch processing costs by up to 40% using advanced resource scheduling techniques and a mix of different virtual machine (VM) types (including the preemptible VM instances) to decrease processing costs while providing the same job completion guarantees as regular Cloud Dataflow jobs. FlexRS uses the Cloud Dataflow Shuffle service, which allows it to handle the preemption of worker VMs better because the Cloud Dataflow service does not have to redistribute unprocessed data to the remaining workers.
Using FlexRS requires no code changes in your pipeline and can be accomplished by simply specifying the following pipeline parameter:
--flexRSGoal=COST_OPTIMIZED
Running Cloud Dataflow jobs with FlexRS requires autoscaling, a regional endpoint in the intended region, and specific machine types, so you should review the recommendations for other pipeline settings. While Cloud Dataflow SQL does not yet support FlexRS, it will in the future.
Simultaneously with launching FlexRS in general availability, we are also extending its availability to five additional regions, covering all regions now where we have regional endpoints and Cloud Dataflow Shuffle:
- us-central1
- us-east1
- us-west1
- europe-west1
- europe-west4
- asia-east1
- asia-northeast1
To learn more about Cloud Dataflow SQL, check out our tutorial and try creating your SQL pipeline using the BigQuery web UI. Visit our documentation site for additional FlexRS usage and pricing information.
Check out other recently launched streaming and batch processing features:
- We deployed Cloud Dataflow Shuffle and Cloud Dataflow Streaming Engine to three additional regions, bringing total availability to seven regions.
- We launched the ability to protect your pipeline state with customer-managed encryption keys.
Python streaming support from Cloud Dataflow is now generally available.
Vodafone Leverages Google Cloud to Aid COVID-19 Frontline with Anonymized Insights on Population Mobility

11166
Of your peers have already read this article.
1:30 Minutes
The most insightful time you'll spend today!
Editor’s note: When Europe’s largest mobile communications company, Vodafone, was asked by the European Commission to help understand population movement across the European Union and the UK to help fight COVID-19, it was able to provide anonymized mobile network-based insights to answer the call. Here’s how Vodafone, with the support of Google Cloud, rapidly mobilized the COVID-19 frontline, while respecting its customers’ privacy.
With the emergence of COVID-19 in early 2020, the European Commission—the executive branch of the European Union (EU)—knew that technology would be instrumental in its fight to control the pandemic. With various lockdowns imposed across its member states, the Commission was keen to predict and prevent the spread of COVID-19 and to manage the related social, political and financial impacts.
Mobile network data helps track COVID-19 across the EU
Mobile networks produce location data, which can be turned into useful anonymous insights to understand population movement within a geographic area. The European Commission, working with mobile industry association GSMA (Groupe Speciale Mobile Association), asked Europe’s major mobile phone operators for help in producing insights to support the fight against COVID-19. As the largest mobile network operator within the EU, Vodafone saw this as a critical opportunity to participate.
Vodafone had previous experience of using mobile network data to support pandemic research. For example, in 2019, Vodafone provided mobility pattern analysis to help track the spread of Malaria in Mozambique. And, during the early stages of the COVID-19 pandemic (prior to working with the European Commission), Vodafone assisted the Italian and Spanish governments in understanding their citizens’ mobility patterns. Vodafone had also previously offered anonymized and aggregated population mobility insights to support public transport and tourism authorities and retail organizations in a number of countries. Consequently, Vodafone was perfectly placed to play a greater role in supporting the European Commission’s response to the pandemic.
When asked to assist the European Commission, Vodafone first considered how it could safely share its data with the governing body without providing details on the individual movements of its customers. It realized it could achieve this through an elaborate set of anonymization and aggregation techniques. Insights are aggregated from a minimum of 50 users and Vodafone only shared these anonymous insights and never the actual raw data with the Commission. As specified by the EU, these insights are then presented onto a large geographical region, typically a city or a county with thousands of people living in that area.
These insights illustrate how people move, helping to determine how lockdowns and self-isolation measures were impacting behaviors.
Using Google Cloud to collate and store population mobility data
In April 2020, Vodafone began migrating its operations, including its mobile data, to Google Cloud on servers in Europe and the UK with elaborate security safeguards, including encryption, building on a previous partnership.
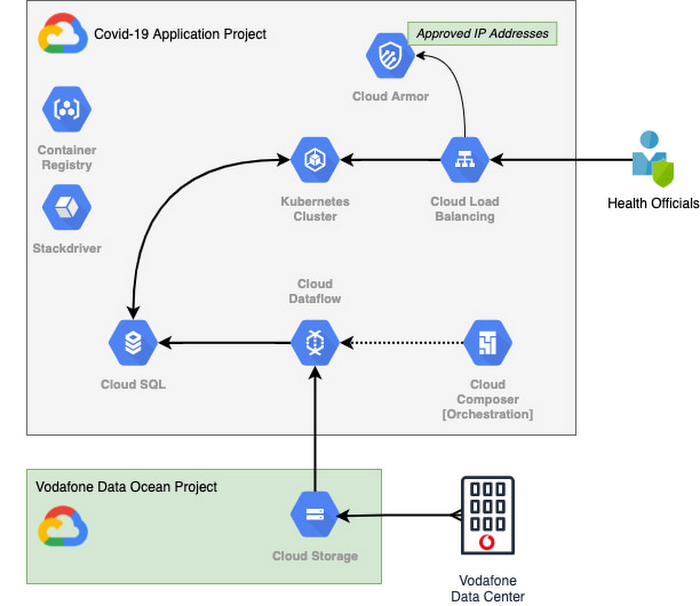
With the data residing in EU and UK data centers and not the United States, Vodafone could then retrieve anonymous insights from Google Cloud Storage instantaneously. Before supplying any information to the European Commission, however, Vodafone used Dataflow to validate the data and run a series of tests to ensure the database had accurate data, before ingesting and archiving the relevant metrics. For instant access, the data was then made available to the European Commission using a Redis database on Google Kubernetes Engine.
To ensure aggregate Vodafone customer data was always safe, secure, and anonymous, all entry points to the front-end were protected behind Google Cloud Armor, where only specific IP addresses were allowed. Using these tools, seamless data pipelines fed in predefined key performance indicators from each specified European market. While data quality measures ensured the definitions for metrics across markets were consistent and could be accurately compared.
The architecture (pictured below) shows how Vodafone integrated and anonymized its data on Google Cloud.
Live interactive dashboard shows population mobility in real-time
With its data integrated on Google Cloud, Vodafone created a live, interactive dashboard to track mobility patterns and share relevant information with the European Commission in real-time.
The European Commission Joint Research Center (JRC) was able to gather valuable information from these insights, which enabled them to see where population mobility was aiding the spread of the disease, when cross-referenced with health data. It could also assess the implications of lockdowns on different populations and forecast cross-country spreading.
Mobile data aids disease modeling for multiple stakeholders
The Vodafone data became instrumental in modeling the likely course of the disease too. For example, the University of Southampton in the UK used it to predict the outcome of different coordinated COVID-19 exit strategies across Europe. This research was published in Science Magazine in September 2020.
The Vodafone data dashboard continues to be used by individual governments, NGOs and organizations to further investigate the impacts of the pandemic and to measure the effectiveness of response strategies alongside the rollout of vaccination programs. The project also helped Vodafone win a DataIQ award for most effective stakeholder engagement.
Using the learnings from this project, Vodafone has been able to adapt its own B2B solution, called Vodafone Analytics, by adaptIng and migrating the code to work in Google Cloud Platform. This solution has been rolled out across Germany, Greece, Portugal and South Africa, and new countries are being onboarded every day. Vodafone Analytics already has more than 100 customers leveraging it for a variety of use cases—Italian fashion retailer OVS, uses it for its smart retail operation, while global real estate company, JLL, uses it to understand the footfall passing through its properties.
Working together, Vodafone and Google Cloud continue to help a range of organizations, governments, and NGOs navigate through the ongoing pandemic, optimize their operations, and help the greater good, without infringing individuals’ fundamental rights to privacy.
To learn more about Google Cloud and Vodafone, watch our full interview here.

Google Cloud named a leader in the Forrester Wave: Streaming Analytics
DOWNLOAD WHITEPAPER4177
Of your peers have already downloaded this article
15:30 Minutes
The most insightful time you'll spend today!
There’s a lot of pressure on companies today to become data-driven, but they need high-performing technology to make that a reality.
As part of Google’s larger cloud data analytics platform, Cloud Pub/Sub and Cloud Dataflow are designed for ease of use, scalability, and performance.
Google Cloud unifies streaming analytics and batch processing the way it should be. No compromises.
Forrester
Forrester has named Google Cloud as a leader in The Forrester Wave™: Streaming Analytics, Q3 2019. This findings reflect Google Cloud’s market momentum, and what Google hears from enterprise customers who are using Cloud Pub/Sub and Cloud Dataflow in production for streaming analytics in conjunction with our broader platform.
According to Forrester, many leading enterprises realize that real-time analytics—the analytics of what’s happening with data in the present—is an incredible competitive advantage. With it, they can act right away to serve customers, fix operational problems, power internet of things (IoT) apps, and respond decisively to competitors.
The report evaluates the top 11 vendors against 26 rigorous criteria for streaming analytics to help enterprise IT teams understand their options and make informed choices for their organizations. Google scored 5 out of 5 in Forrester’s report evaluation criteria of scalability, availability, aggregates, management, security, extensibility, ability to execute, solution roadmap, partners, community, and customer adoption.
We are very excited about the productivity benefits offered by Cloud Dataflow and Cloud Pub/Sub. It took half a day to rewrite something that had previously taken over six months to build using Apache Spark.
Paul Clarke, Director of Technology, Ocado
While stream analytics is a leading business priority, real-life use cases frequently require batch data as an input as well. Google Cloud Platform (GCP) customers can simplify their pipeline development by reusing code across both batch and stream processing using Apache Beam, which also provides pipeline portability to OSS projects. Further, Google Cloud’s data analytics portfolio autoscales across ingestion, processing, and analysis, which eliminates the need for provisioning and makes handling varying volumes of streaming data automatic. We hear from users that they’re able to ingest and process data much more quickly than in the past, helping to get new business insights faster and allowing more users to do self-serve analytics.
6389
Of your peers have already watched this video.
2:00 Minutes
The most insightful time you'll spend today!
CCAI Insights: Answer Customers’ Queries & Understand Them Better with Conversation Data
With CCAI Insights, businesses can drive contact center efficiency, solve customer problems and leverage data from customer interactions to understand them better!
CCAI Insights, a core piece of the Google Cloud’s Contact Center AI product suite is built to help contact center management dive into data to adjust business needs, preempt problems with timely analysis of customer conversations and keep agents prepared. Additionally, businesses can automatically feed data into Insights from other areas of CCAI like Dialogflow CX or another product sources. Watch the video to find out more benefits and capabilities of CCAI Insights in elevating CX.
More Relevant Stories for Your Company

How Vertex AI Helps Coca-Cola Bottlers Japan Analyze Billions of Data Records
Japan is home to millions of vending machines installed on streets and in buildings, sports stadiums and other facilities. Vending machine owners and operators, including beverage manufacturers, stock these machines with different product combinations depending on location and demand. For example, they primarily display coffee and energy drinks in machines




L’Oréal: Managing Big-data Complexity with Google Cloud
L’Oreal is a global company with a presence in 150 countries worldwide. Between managing all of its brands and requirements for different countries, L’Oreal looks to data to make insightful business decisions. How does L’Oreal unify its data across all its systems and databases? How does L’Oreal make the data

Google Dataflow Named Leader in The 2021 Forrester Wave™: Streaming Analytics
We are excited to announce that Google has been named a Leader in The Forrester Wave™: Streaming Analytics, Q2 2021 report. Thank you to our strong community of customers and partners for working with us to deliver a customer focused product. We believe Forrester’s recognition is an acknowledgement of our leadership

How Google Cloud & NGIS’ Partnership Powers Sustainability & Responsible Sourcing for Consumer Brands
In the competitive world of consumer goods, sustainability matters more than ever. In recent Google survey, 82% of consumers said sustainability is more top of mind now than it was before COVID-191 and 78% said that big businesses have a role to play in helping to fight climate change.2 As well as delivering on
