





4423
Of your peers have already watched this video.
1:32 Minutes
The most insightful time you'll spend today!
How the UK’s Football Association Turns to Tech to Ensure its 29 Teams Deliver World-Class Performance
The FA is an iconic British institution responsible for overseeing all aspects of football in the UK, from the grassroots club level across the country to the national teams who play at Wembley.
However, even icons like The FA must evolve to stay at the top of their game and they realized their old methods of pen and paper needed to change.
So The FA partnered with Google Cloud to transform itself into a digital leader. The first step was to implement G Suite to get all 29 professional national teams on the same page.
For all 350+ staff at St. George’s Park training facility and coaches throughout the country and on the road, G Suite provides an intuitive and easy way for all these entities to work together.
Coaches could communicate through Hangout; analysts could
compile and share data in Sheets; AI training plans could be distributed
and executed using Slides; and Drive helped support players on the
move, giving immediate access to important information, like dietary
requirements, training data, travel docs and more.
Watch the video to find out more.
4303
Of your peers have already watched this video.
1:43 Minutes
The most insightful time you'll spend today!
The Amazing Tech Behind This Animal Rescue Center Helps Save Costs and Rescue More Animals
The Royal Society for the Prevention of Cruelty to Animals (RSPCA) is the UK’s largest animal welfare charity. Each year, it finds new homes for more than 50,000 animals in need.
Streamlining the charity’s IT systems is the job of Billie Laidlaw, Assistant Director IT Resources. “Every pound we save with our solutions helps to rescue, rehabilitate and re-home animals across England and Wales,” says Billie.
Google Apps for Work was introduced to replace the legacy email system, and the move has saved the charity hundreds of thousands of pounds and introduced more effective ways of working. With Apps for Work on Android phones and Chromebooks, RSPCA inspectors can use Drive and Gmail on the go to connect, check documentation, share information, and request temporary shelter for rescued animals.
With Slides and Chromebox, rescue centre managers can quickly and easily create promotional screens to display in their reception areas showcasing animals that need new owners. And the slides can be pushed simultaneously to RSPCA charity shop screens to help ensure the best chance of finding the animals loving new homes.
“Every time a supporter puts a pound in one of our collection tins, they want it to be spent wisely,” says Billie. “By streamlining our services with Google Apps for Work, we make sure that more of that money serves the animals who need it.”
Watch this video to find out the tech that helps RSPCA make a difference.
CARTO’s Data Visualization Powered by Google Cloud and deck.g

4086
Of your peers have already read this article.
7:00 Minutes
The most insightful time you'll spend today!
Editor’s note: Today’s blog post is from Alberto Asuero, CTO of CARTO, the location intelligence platform. Today he shares more details about the source of the data for advanced data visualizations created with Google Maps Platform and deck.gl and how the CARTO platform enables this workflow.
During Google Cloud Next in October, the Google team announced the newest release of the deck.gl visualization library, thanks to a collaboration with our geospatial company CARTO and the vis.gl Technical Steering Committee (TSC). The deck.gl release includes a deep integration with the new WebGL-powered features in the Maps JavaScript API that allows deck.gl to render 2D and 3D visualizations directly on the Google basemap.
Our team built an example app that visualizes a variety of data sources that show the potential for electrification of truck fleets in Texas. This app showcases the different types of advanced data visualizations that can be created with Google Maps Platform and deck.gl. Today, I want to share more details about the source of the data for these visualizations and how the CARTO platform enables this workflow.
Google Cloud provides a strong serverless data warehousing solution, BigQuery, with support for geospatial queries. When you are dealing with spatial data, creating maps to explore and visualize these datasets is an important and common need. The CARTO Spatial Extension for BigQuery provides an easy way to create connections to the data warehouse, design a map with data coming from BigQuery tables, and then add these visualizations to a web app using deck.gl.
Making a simple map
To create a simple map using the CARTO platform, you can sign up for a trial account. Once you have signed in, you can set up a connection to your BigQuery instance using a service account. Then, you can go to the Data Explorer and browse the available datasets to find the table you want to use as the datasource in your map. For more information, check out the CARTO documentation.
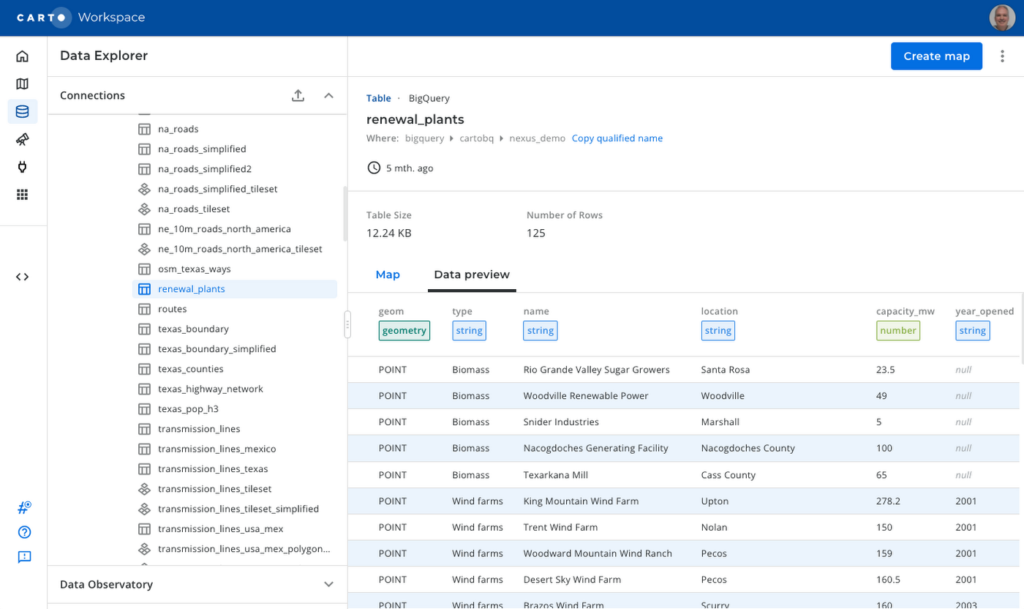
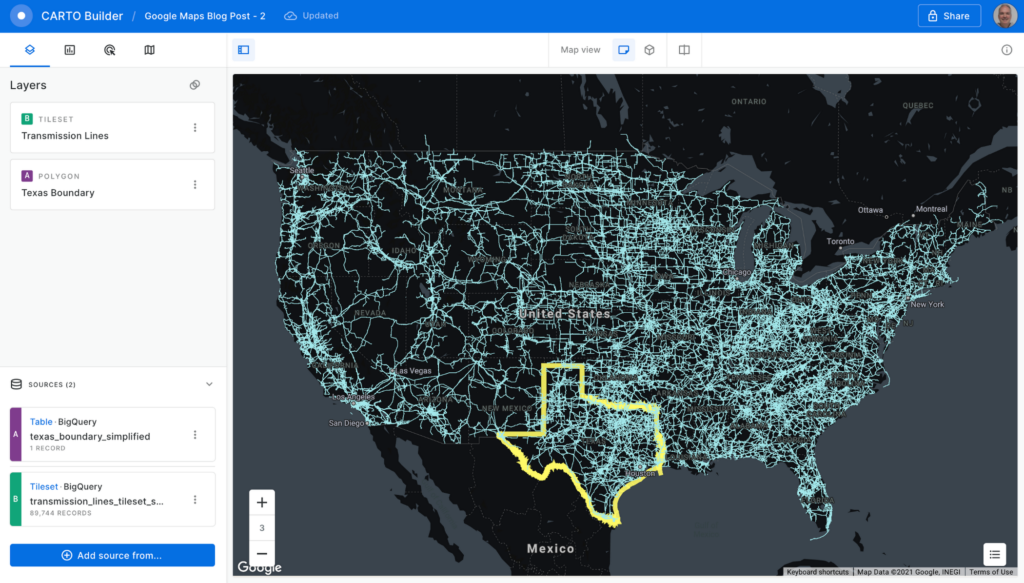
To create a visualization of power transmission lines in Texas, you can start with the Texas state boundary to provide some context. In the Data Explorer, you can preview the table and click the “Create map” button in the top-right corner to start designing your visualization.
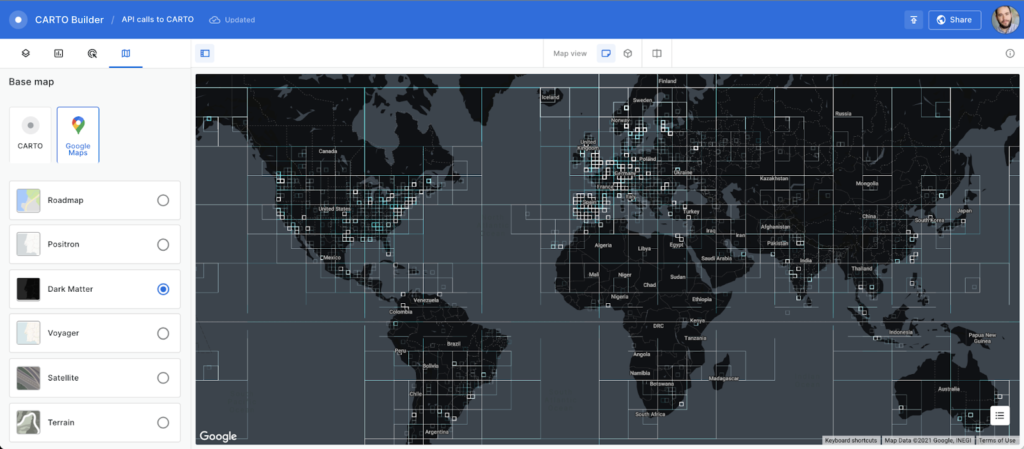
Using the CARTO Builder map making tool, select one of the available Google vector basemap styles and customize the layer style.
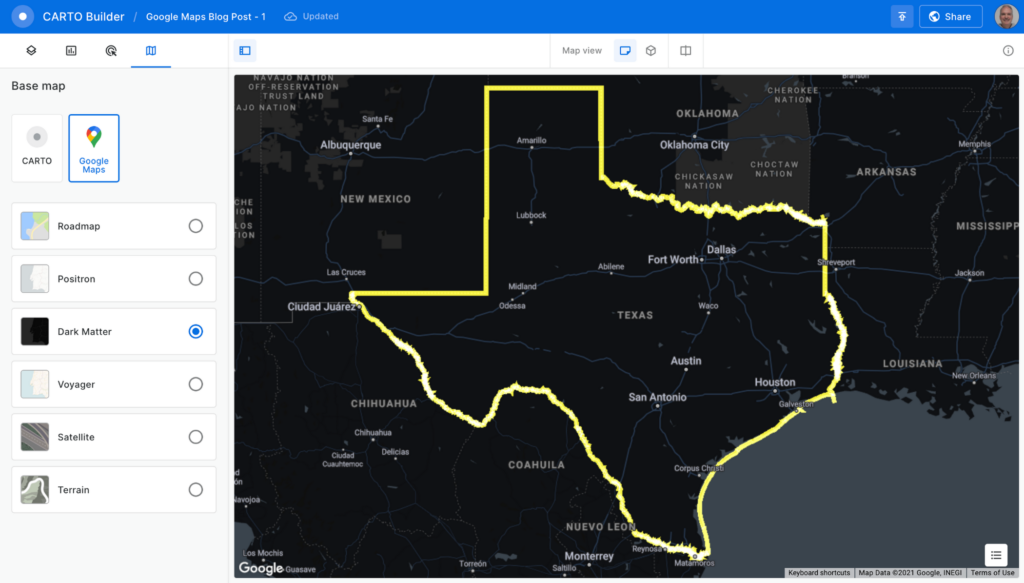
You can visualize tables and the results from queries executed in the data warehouse, which is a powerful feature because you can also execute spatial analysis functions using SQL, including those from the CARTO Analytics Toolbox. In this case, you can intersect the lines in the table containing all the U.S. transmission lines within the Texas boundary. Click on the “Add source from…” button and select the “Custom Query (SQL)” option to add the following query:
SELECT *FROM cartobq.nexus_demo.transmission_linesWHERE ST_INTERSECTS(geometry,(SELECT geom FROM cartobq.nexus_demo.texas_boundary_simplified));
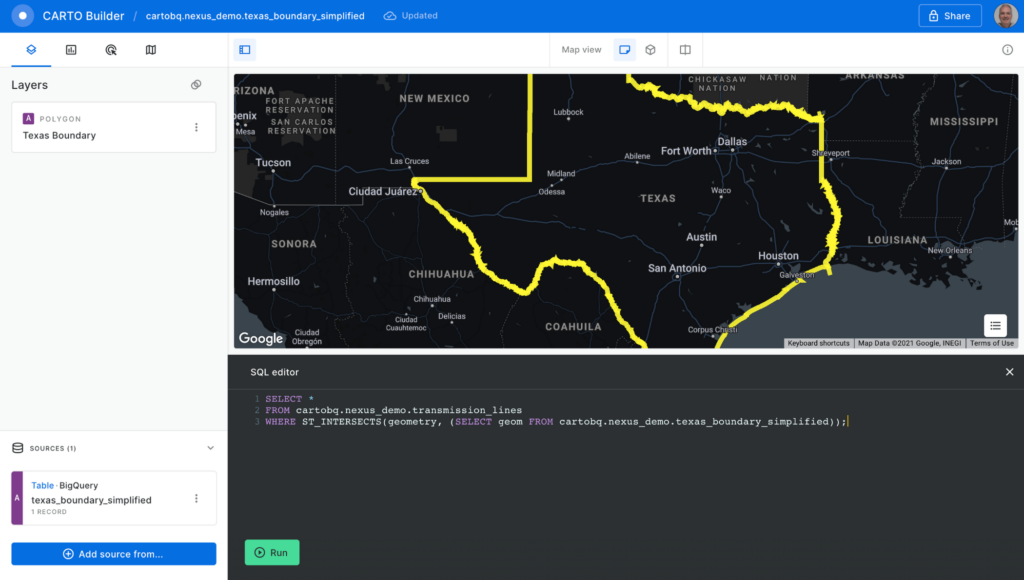
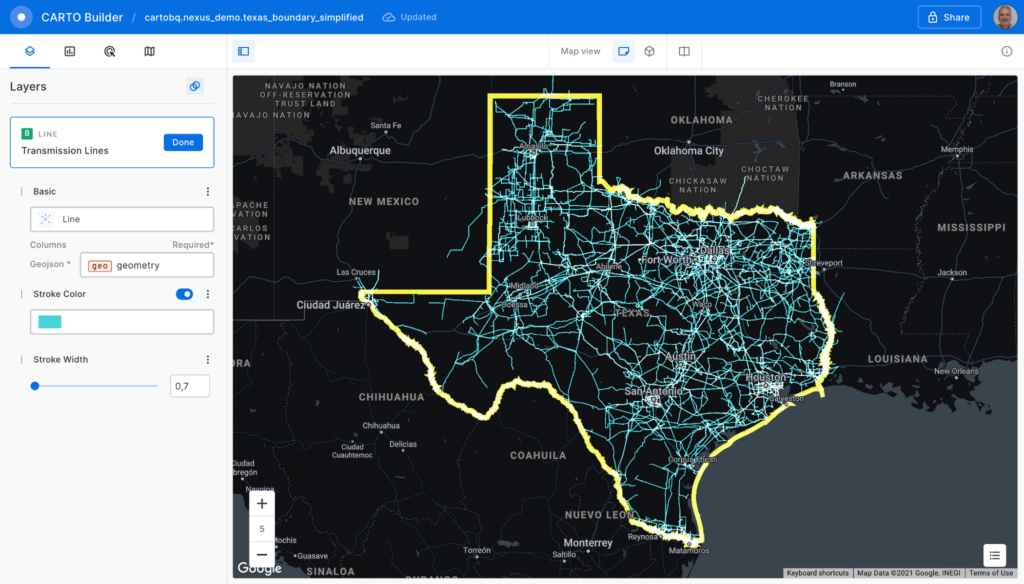
Click the “Run” button, and the query is executed in BigQuery. The results are sent back to the Builder tool. Perform some style customizations in the new layer, and your map is ready.
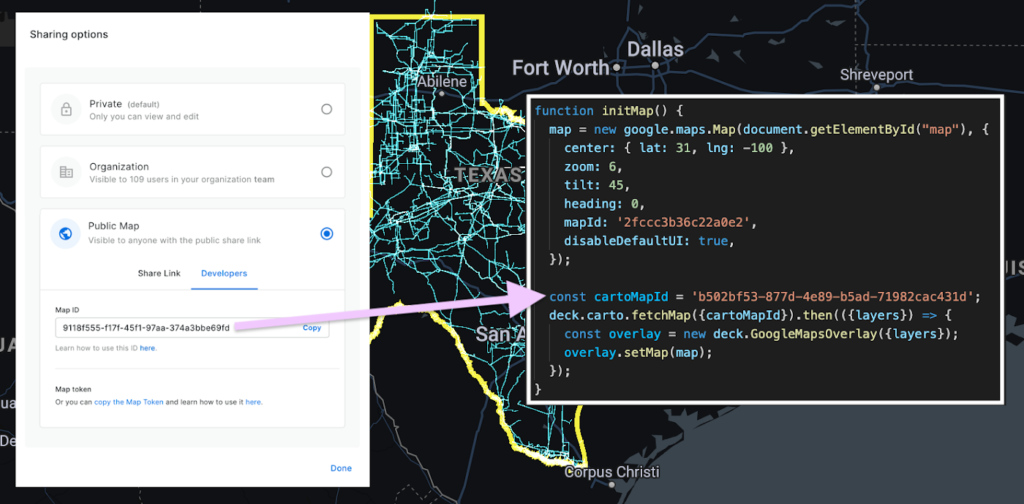
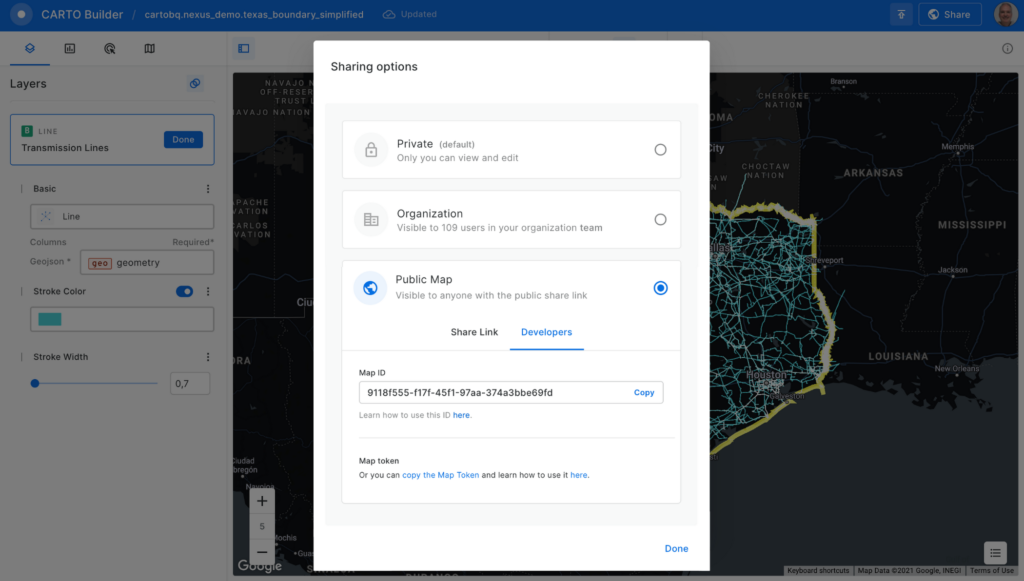
Before adding the map to the Google Maps Platform application, you’ll need to make it public. Click on the “Share” button and select the “Developers” tab to copy the map ID.
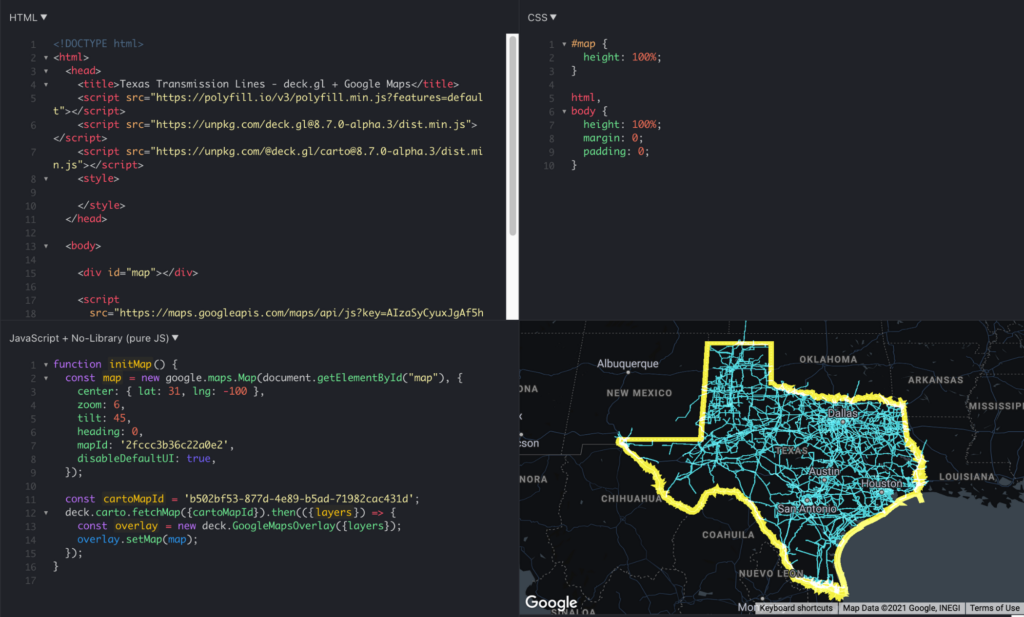
Now, you can add the visualization into your Google Maps Platform application, which is as easy as adding these four lines of code:
const cartoMapId = 'b502bf53-877d-4e89-b5ad-71982cac431d'; deck.carto.fetchMap({cartoMapId}).then(({layers}) => { const overlay = new deck.GoogleMapsOverlay({layers}); overlay.setMap(map); });
You can use the map ID copied from CARTO Builder to call the fetchMap function. This function connects to the platform and retrieves all the information needed for the visualization, including a collection of deck.gl layers with all the styling properties you’ve specified. Create an instance of the deck.gl GoogleMapsOverlay with this collection of layers and add it to the map.
You can see the full example in this fiddle.
Visualizing very large datasets
One of the main features of BigQuery is the ability to scale processing to massive datasets. With the CARTO platform, you can also visualize very large datasets using tilesets, an optimized data structure containing pre-generated vector tiles for fast visualization. Tilesets are generated within BigQuery using the Analytics Toolbox functions in a parallelized process that can handle billions of points.
For example, you can create a visualization using tilesets with the whole dataset of transmission lines for the U.S., more than 100MB of geometries.
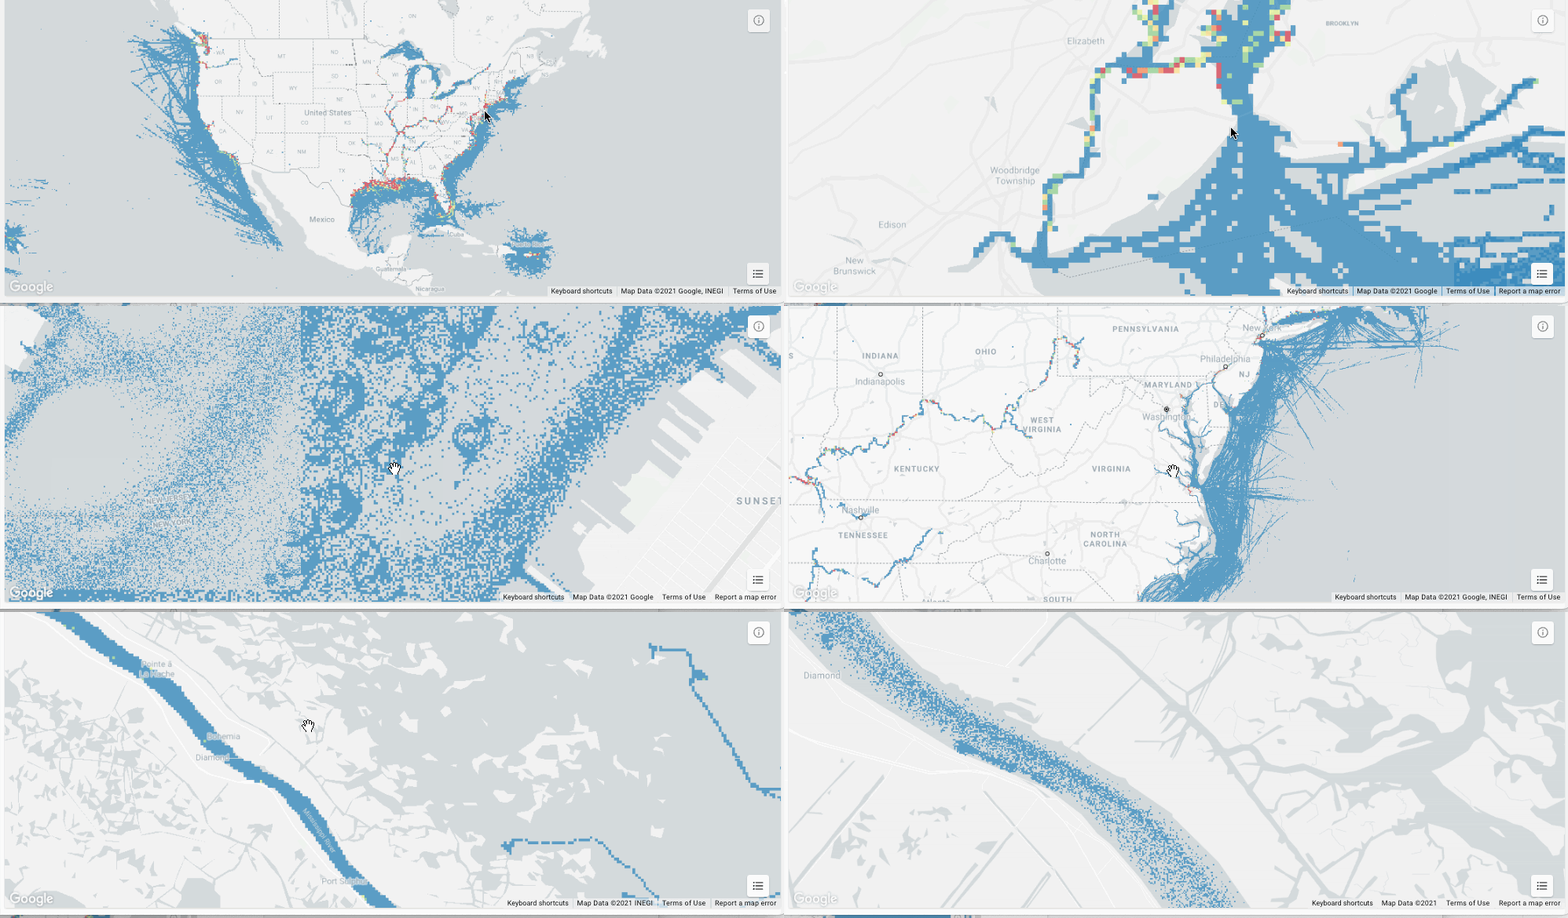
The issue with these large datasets is that they do not fit in memory all at once, so you need to split them into tiles for them to be rendered progressively. CARTO takes care of this, allowing you to create tilesets directly in BigQuery or dynamically generate them on the fly.
This method for data loading in maps can scale as much as needed; for example, take a look at this 17 billion point visualization of vessel data.
What about live data?
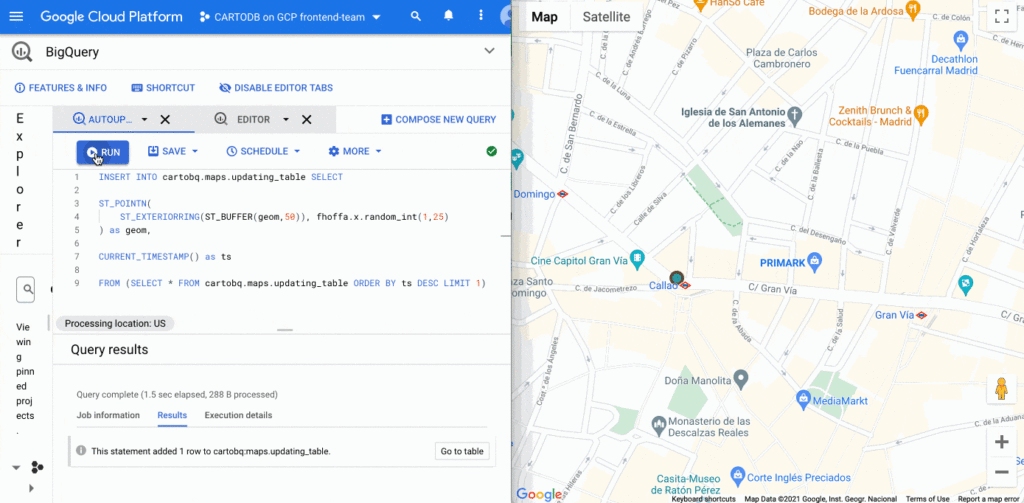
BigQuery supports streaming data that is continuously updated. In these scenarios, you want to be able to update your visualization at regular intervals, as the data changes. It’s easy to update this visualization using deck.gl. You just need to set the autoRefresh parameter to true when fetching the map and specify the function you want to execute when new data is downloaded:
const {layers} = await deck.carto.fetchMap({ cartoMapId, autoRefresh: true, onNewData: (parsedMap) => { … } });
You can add points to a table with an INSERT function on the BigQuery console and see the data updated on the map in real time.
Going further
In addition to the simple ways to create visualizations shown above, deck.gl has the flexibility to create a wide variety of visualizations. The CARTO platform provides you with the functionality to access data from your data warehouse and create these data visualizations with advanced cartographic capabilities, but you can extend it and go beyond that using any of the advanced visualizations available in the deck.gl layer catalog.
There are two additional options that give you more control over the deck.gl code. The first one is to use the CartoLayer directly without fetchMap. You’ll need to indicate the connection to use from the CARTO platform and the data source type and name or query. Then we can specify the styling properties.
const overlay = new deck.GoogleMapsOverlay({layers: [new deck.carto.CartoLayer({connection: 'bqconn',type: deck.carto.MAP_TYPES.TABLE,data: `cartobq.public_account.retail_stores`,getFillColor: [238, 77, 90],pointRadiusMinPixels: 6,}),],});
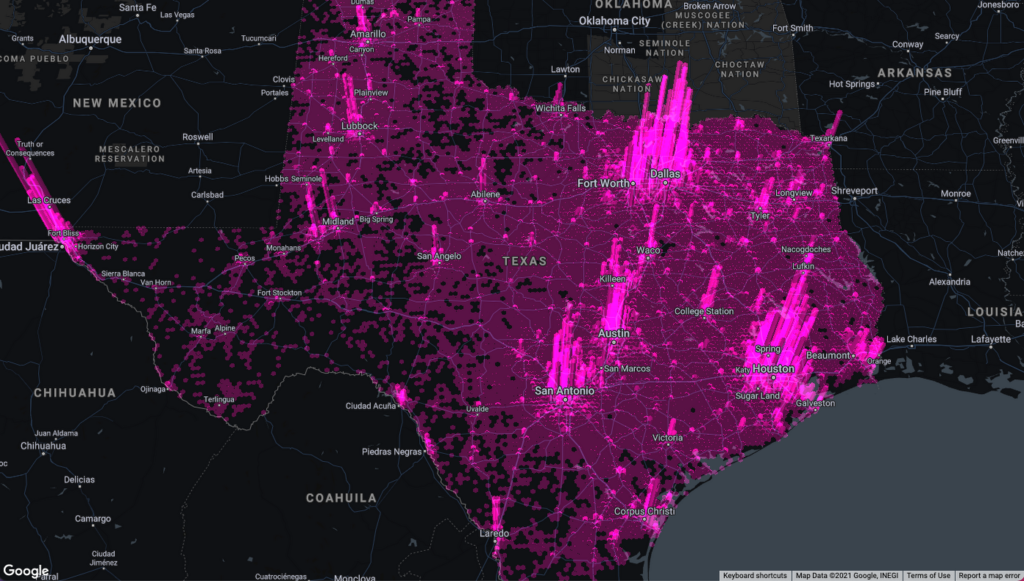
The second option is to use the fetchLayerData function that allows you to have more control over the format used for data transfer between BigQuery and your application and can be used with advanced visualizations that require an specific data format like ArcLayer, H3HexagonLayer or TripsLayer.
deck.carto.fetchLayerData({type: deck.carto.MAP_TYPES.TABLE,source: `cartobq.geo_for_good_meetup.texas_pop_h3`,connection: 'bqconn',format: deck.carto.FORMATS.JSON,credentials: {accessToken: 'eyJhbGciOiJIUzI1NiJ9.eyJhIjoiYWNfbHFlM3p3Z3UiLCJqdGkiOiI1YjI0OWE2ZCJ9.Y7zB30NJFzq5fPv8W5nkoH5lPXFWQP0uywDtqUg8y8c'}}).then(({data}) => {const layers= [new deck.H3HexagonLayer({id: 'h3-hexagon-layer',data,extruded: true,getHexagon: d => d.h3,getFillColor: [182, 0, 119, 150],getElevation: d => d.pop,elevationScale: 2.5,parameters: {blendFunc: [luma.GL.SRC_ALPHA, luma.GL.DST_ALPHA],blendEquation: luma.GL.FUNC_ADD}})];const overlay = new deck.GoogleMapsOverlay({layers});overlay.setMap(map);});
For complete code using both options, take a look at these examples.
Learn more
You can access demos and documentation on the deck.gl docs website and the CARTO Documentation Center. If you have questions, you can ping the CARTO team on the CARTO Users Slack workspace.
For more information on Google Maps Platform, visit the Google Maps Platform website.
Customer Stories: Ocado

4053
Of your peers have already read this article.
2:30 Minutes
The most insightful time you'll spend today!
Ocado is the world’s largest online-only grocery store. But Ocado isn’t your typical corner grocery store. For one thing, there’s no corner as we’re an online-only grocery retailer reaching British households, and now with a fast-growing non-food business alongside. Our customers shop online using our award-winning webshop or mobile apps and then their orders are picked and packed in one of our huge automated warehouses, the largest of their kind in the world; hours later, our vans deliver to their kitchens in one-hour delivery slots.
Google Workspace allows us to do things our way, wherever and whenever we want. Our staff use Gmail, Google Calendar and Google Drive to stay on top of their day to day work, and Google+ is helping our teams stay in touch, share information and build local communities. Ultimately, all of these tools help to make sure our customers get the groceries they order, on time and in the best possible condition.
But we didn’t stop there. We looked at other ways we could use Google’s technology to help us run our business and started using Google App Engine for building internal applications. For example, we used App Engine to create a new version of our “Where’s My Order” application, which our customers will soon be using to find out where their orders are within our production cycle. Once their order is on the road, the integration with Google Maps allows them to see exactly where their delivery van is. So we’re taking what used to be a chore, grocery shopping, and making it a simple experience that you can do from the convenience of your own home, or wherever you may be.
Our most recent project was on Google Compute Engine. Within our warehouses there are certain tasks that are repetitive and arduous for humans to do, like picking heavy six packs of bottled water into customer orders. So our robotics team is developing solutions that use robots to automate these sorts of tasks and thus release staff for other more important work. But these robots need sophisticated 3D vision systems to enable them to see what they are doing. These are very computationally intensive applications and by providing the instantly flexible and scalable computing power to crunch all those numbers, Compute Engine provided the perfect solution. And, we are already using the cloud to store and process some of the huge volumes of data that our business spits out every minute.
But with an eye to future growth and international expansion, we have plans to use Compute Engine and Cloud Storage to move other parts of our production systems to the cloud. So walk into an Ocado warehouse in the future and you might run into a robot if you’re not careful. Like I said, we’re not your typical corner grocery store.
*Google Workspace was formerly known as G Suite

The Secret Behind How ATB Reduced Strategic Planning Time by 50 Percent
DOWNLOAD CASE STUDY4783
Of your peers have already downloaded this article
8:30 Minutes
The most insightful time you'll spend today!
ATB Financial (ATB) operates in a highly competitive financial services space, with competitors ranging from big banks to financial technology startups, ready to grab a slice of the provincial market share. To retain its competitive advantage in an industry primed for disruption, ATB took an active role in its evolution by intentionally transforming the way banking products and services could be delivered. Through this bold transformation, paired with customer-obsession, ATB is primed to make good on its commitment to deliver happiness to its customers by being more than a bank.
To address its goals, ATB launched a new initiative called “Work Reimagined” powered by G Suite, with the aim of helping employees save time, make decisions faster, and spend more time with customers to drive happiness. However, to succeed, ATB needed to equip its distributed, mobile workforce with modern productivity tools that would simplify employee communication and collaboration.
Remote employees often experienced connectivity and performance challenges with the corporate VPN, limiting their productivity. At the same time, legacy office tools did not foster innovation and often slowed business processes, delaying the company’s ability to deliver new services and respond to customer needs.
“We wanted productivity tools that would allow us to make time richer for team members in support of our customers and achieve 10x improvements rather than small gains. We chose G Suite because it enables employees to think and work differently,” says Lorne Rubis, Chief Evangelist, ATB Financial.
Gmail Turns 18, Has 3 Billion Users! A Product Lead Breaks Down How Gmail Stays Interesting

3809
Of your peers have already read this article.
1:30 Minutes
The most insightful time you'll spend today!
This April, Gmail will be 18 years old. That’s a big milestone, given that email as a medium just turned 50.
Launched in 2004—with its 1 GB free storage, conversation based grouping, and enhanced search capabilities—Gmail quickly became one of the most popular email services in the world.
What started off as Paul Buchheit’s side project is now part of Google Workspace, a solution that’s used by over 3 billion users.
Yet despite this growth and Gmail’s long history, the product continues to find new ways to delight its users with great experiences, new features, and constant innovation.
How does the product team do it?
To help us unpack this question, I interviewed Matthew Izatt, Product Lead for Gmail.
Matthew has been building and growing Gmail for the last 10+ years. He started off in mobile where he built the Android and iOS apps for Gmail, and eventually he became the lead product owner for all of Gmail’s front end. He also led the development of the new Gmail in 2018, which was a complex rebuild of the technical architecture and visual design, along with the addition of multiple enterprise focused features. Since then, he has been leading Google’s charge on redefining how we work as the product lead for the Workspace Platform and Partnerships efforts with a team of over 100.
What follows is an edited version of our interview.
Mustafa Kapadia: Matt, thank you for joining us. Now, before we jump into how your team does its magic, can you please share with me some of the challenges you face when you build a new feature or experience on Gmail?
Matthew Izatt: Thanks Mustafa. And I think this is a great place to start.
One of the biggest challenges is that Google Workspace is used by over 3 billion users, and while that is great, there are many different ways of using our product. It’s not like a doorbell, where there is only one way of using it. With Gmail, it’s like an infinite Swiss army knife, where everyone has their own favorite way of using the product.
Second, Gmail is a critical product for many of our users. Yes, it’s fun to use, but people use it to get important work done—sending job proposals, emailing with their kids’ teachers, or booking medical appointments. This is why we have to be careful about what we experiment with and what we roll out. We can’t just throw things out there and see what works. We have to do our homework.
Third, we have to constantly innovate and think outside the box. Email is an old product, but it continues to evolve. Every day we have new startups reinventing email and challenging the big players. If we are to remain a market leader, we literally have to rethink the product every few years. Which is why creating the new Gmail was so much fun.
Mustafa: I don’t envy you. This is not an easy product to build. Going back to something you touched on: Given these hurdles, how do you build these great experiences? Is there an example that you can share with us?
Matt: A specific example I always like to share is the story of how we came up with the right display density on our thread list. The thread list is your inbox; it’s the list of all the messages that you have. The display density is how that information is presented to you.
In Gmail you can choose to have fewer messages with a lot of information about each message. Or you can choose to see a larger number of messages with much less information about each message.
It really comes down to your preferences. And it’s one of the reasons why so many users like using Gmail. In fact, being able to set inbox display preferences is actually one of the top 10 most used settings within Gmail.
Mustafa: So you were really trying to give users choice on how they would like their information presented?
Matt: Exactly. Now, we could have added 100 different levers so that every user could customize their email feed to an infinite degree. While that is possible from a coding perspective, it’s not practical for three reasons.
First, infinite choice sounds good on paper, but in reality, too many options creates a confusing user experience. Second, development would take many months—maybe even a year. And third, it would be a long-term maintenance nightmare.
Mustafa: So how did you go about doing it? Share with me the inner workings of Gmail in Google Workspace. How is the sausage made?
Matt: Well, it came down to four key steps, working closely with our amazing UX Research team.
First came the primary research to find out if building this experience was worth doing. After all, what is the point of building it if no one wants it? For this we actually sat down with real users inside and outside of Google to understand their needs.
Second, we brainstormed 100 potential solutions and narrowed them down to 8 options. Then we mocked up each of the 8 options to see how they looked.

While it would have been easy to just pick the option we liked the most and build it, we wanted to create what our users want, not what we like the most. So we took those options and surveyed the users from step 1 again. We specifically asked them to rank their preferences across three dimensions: Love It, Hate It, or Meh!
Based on the user responses, we realized that 3 configurations would meet the needs of most users. These were the three options we developed and deployed to Google Workplace.
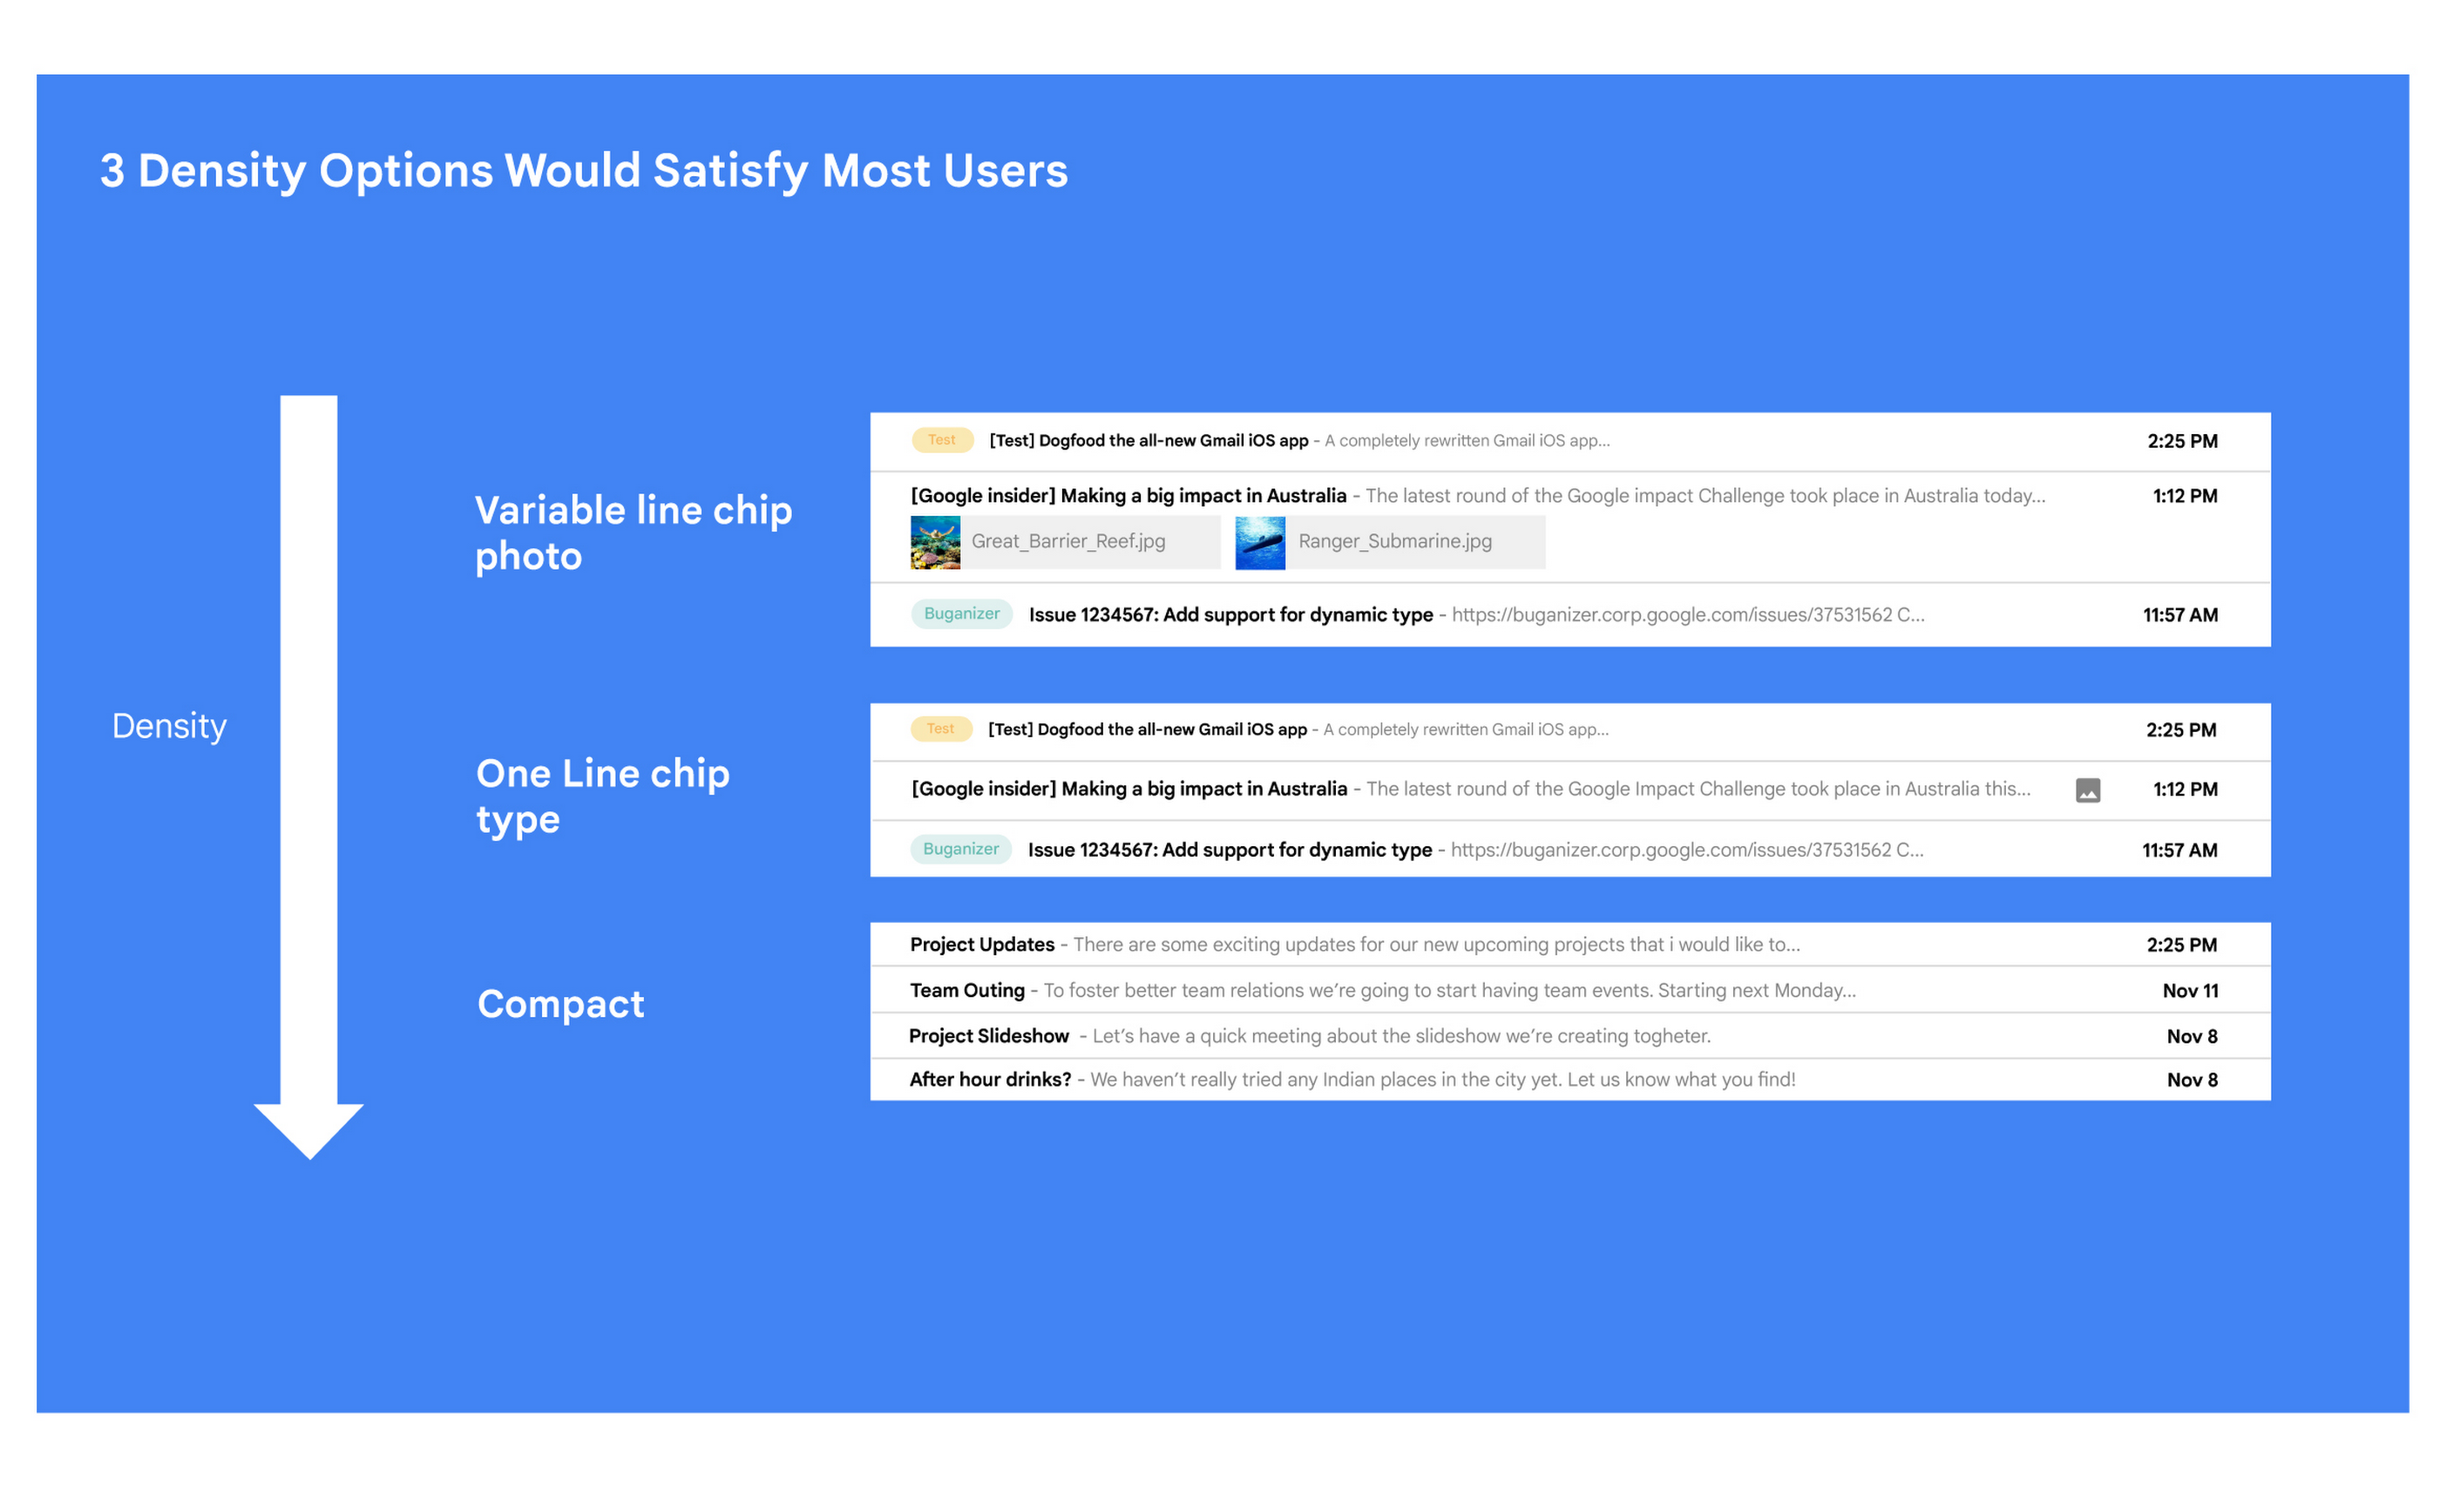
Mustafa: I love how you used data to guide your decision of what to build. This really is Google’s secret sauce—first-hand data collected from users.
Matt: Absolutely. Without their feedback, we would have never been able to narrow down to the 3 options that would satisfy most of our users.
Mustafa: Talking about risks: Getting user feedback and validating before you build is one way to de-risk your product, but you even de-risked your product launch strategy, correct?
Matt: Yes. Sometimes we launch features individually. Sometimes we launch them as a group. In this particular case, we had a lot of moving parts. We had a complete UI redesign, 10 or 12 new features, and architecture changes.
So to de-risk this, we put in place—I kid you not—a 26-stage launch process. We started off with the technical architecture changes—stuff that the user would not notice—to make sure that it was working. And we did it in small increments.
Then we rolled out a few features at a time, launching it first to our early access program—where users have opted in to receive updates. We measured their reaction and satisfaction first, and then moved on to the next group.
At every stage, we kept our blast radius small and put in these checks and balances where we could launch, measure reaction, and then reassess our strategy. And that worked out pretty well for us for this massive launch.
Mustafa: Agreed! Thank you for taking the time to talk to me. And good luck with building the next version of Gmail.
Matt: Thanks for having me.
More Relevant Stories for Your Company
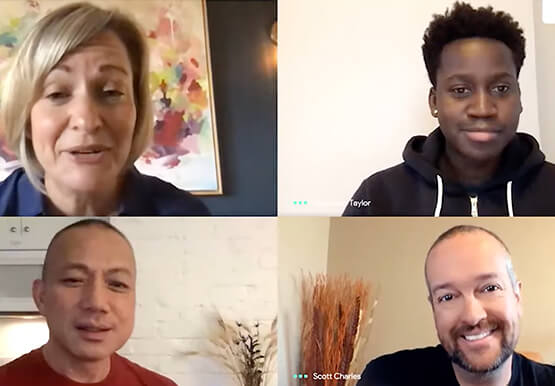



The future of meetings in G Suite: Vision and roadmap
A study from MIT Sloan school in early April showed that 47% of US workers were already working from home. Compare that to just 13% before the pandemic. And these numbers are likely to be even greater today. Video meetings help us connect in a human way, whether it's for

Eight Steps to Align Hybrid Work with Diversity, Equity and Inclusion (DEI) Principles
Many executives across the globe are feeling the effects of a recent pivot to hybrid work models. This massive transition represents a significant departure from existing office culture. As business leaders look to operationalize their flexible work model infrastructure, they’re also evaluating what it takes to attract and retain employees
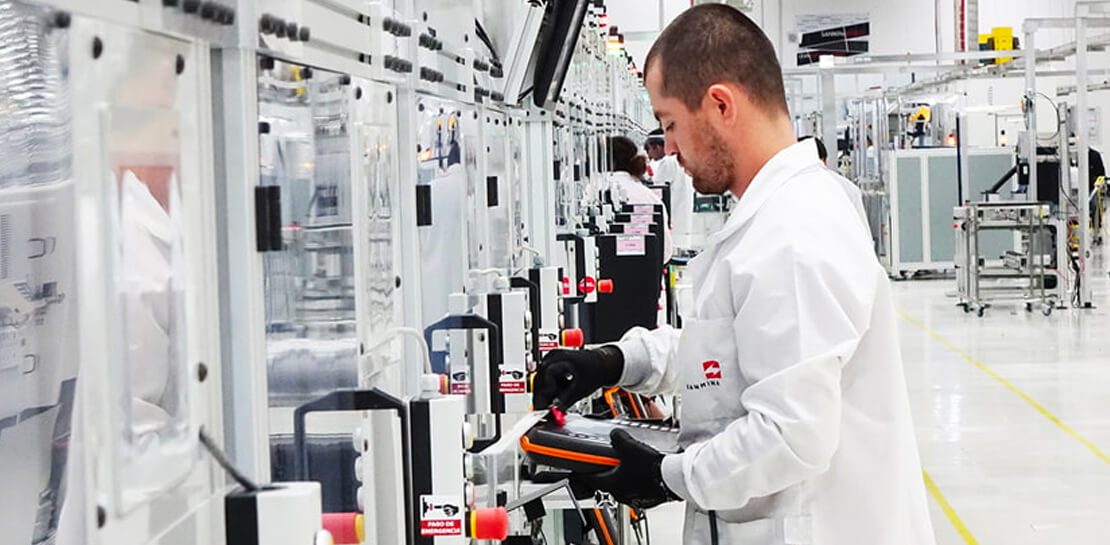
Fortune 500 Electronics Manufacturer Makes Collaboration a Competitive Advantage…and Saves $2 Million A Year
When electronics manufacturer Sanmina adopted G Suite several years ago, its goals were clear: reduce licensing costs, simplify management—particularly of its messaging tools—and cut hardware expenditures. Fast forward several years and the Fortune 500 company has achieved those goals and more. By moving to Gmail, Sanmina reduced more than 110 email servers by over 90%,

Maximize your downtime with these 12 cost-effective Google Cloud learning opportunities
The holiday season is upon us! If you are making your list and checking it twice, we’ve got a few learning gifts you can tick off the list and share with others too. For the season of giving, we’ve wrapped up some of our most popular training and certification opportunities
