





How the City of Memphis Uses Technology to Identify 75 Percent More Potholes

7148
Of your peers have already read this article.
4:30 Minutes
The most insightful time you'll spend today!
At 340 square miles, the City of Memphis is among the largest in the United States in terms of land area. Memphis has over 6,800 lane-miles of city streets, enough to drive back and forth to Los Angeles four times. Keeping these streets well maintained and safe for citizens and visitors is a major priority for the city.
Lots of traffic, lots of roads, and a four-season climate prone to wintertime freeze-thaw-refreeze cycles means the opportunity for potholes. Although the city aims to fill potholes within five business days of notification, it can take longer, especially during winter and early spring. Last year, the city’s Public Works crews repaired some 63,000 potholes, only 20% of which were reported by residents. Approximately 32,000-man-hours each year are spent repairing potholes, with seasonal fluctuations requiring ten to twelve Street Maintenance crews working steadily during the winter months. Still, many went unreported, leading the city to flag pothole request resolution under “needs improvement” on its open data portal website.
Like many large cities, Memphis also struggles with vacant and blighted properties. Nearly 15,000 properties in Memphis are likely vacant, and city officials contend that many are owned by out-of-town investors who live elsewhere and do not take necessary restoration or maintenance steps. These properties can decrease the value of surrounding real estate and discourage new businesses and other residents from moving to an area. Citizen frustration and concerns over the number of blighted properties has made blight eradication a major focus of the City of Memphis.
Historically, residents reported potholes and blighted properties by calling 311, or more recently by using the Memphis 311 app. However, these reports only covered about 20 percent of the problems — often the worst cases. And by the time residents took the initiative to submit a 311 report, they usually weren’t feeling good about the situation.
Recognizing that potholes and vacant properties are often the most visible indicators of whether a city government is doing its job efficiently, Memphis Mayor Jim Strickland and CIO Mike Rodriguez began looking for ways they could apply technology to fix the problems. Mike approached Google for ideas, and Google recommended conducting a machine learning proof-of-concept (POC) with SpringML, a Google Cloud Partner.
“Memphis is focused on easy living, and we want to do everything we can to keep our citizens happy,” says Mike Rodriguez. “Working with Google and SpringML to reduce potholes and urban blight using machine learning and artificial intelligence was an easy decision.”
Bringing machine learning to city operations and budgets
The city’s goal is to detect potholes and abandoned properties by analyzing video footage of roads and residential properties. It wanted to classify potholes by width and depth, and share the information with workers who can repair them. For abandoned properties, it wanted to enable more strategic deployment of resources for homeowners citywide and take action to hold neglectful property owners accountable.
The POC began by training TensorFlow models for ML object detection using preconfigured AI Platform Deep Learning VM Images on Compute Engine. SpringML helped set up cameras and developed a user interface to collect pothole data and automate the 311 ticketing process.
Together, the teams analyzed 30 days of video from a moving city bus and high-resolution video from 360-degree cameras mounted to a code enforcement vehicle, overlaid with data from 311 reports. As the models were refined, accuracy quickly climbed from 50 percent to over 90 percent as models were taught to differentiate a pothole from a manhole cover or other object.
The city also imported routes, potholes, and paving data along with geolocation data from ArcGIS and Google Maps into BigQuery to better understand street conditions and the proximity of potholes to one another. BigQuery also analyzes city property records, tax records, 311 reports, and third-party survey data on-demand to predict where homes are starting to become run down and where neighborhood decay is most likely to occur. The SpringML team created a pilot analysis to begin vacant property protections and developed a user interface tool to interact with the model’s results.
“Google Cloud Platform made it possible for us to experiment with machine learning and artificial intelligence to help solve our city’s problems while working within the budget constraints of a municipal IT organization,” says Mike. “Google turned a ‘nice to have’ into a ‘let’s do this!'”
Identifying 75 percent more potholes
Memphis expects to substantially reduce the number of potholes on its streets, creating a better driving experience for residents and visitors alike. Because drivers won’t be as likely to swerve to miss a pothole, streets will be safer and friendlier to bicycles and scooters. Fewer potholes will also save the city between $10,000 and $20,000 annually in city claims that it pays out in cases where vehicle damage results from a pothole that was not addressed in a timely manner.
“Historically, Public Works has relied primarily upon Street Maintenance crews to proactively locate and fill potholes. As Memphis has over 6,800 lane-miles of public streets, it is a daunting task to reliably survey the entire system in an efficient and systematic way,” says Robert Knecht, Public Works Director for the City of Memphis. “The outcome of the data collected will be invaluable to Public Works so that it can ensure it is managing the city’s street system in a more proactive manner.”
Memphis will be able to better prioritize road maintenance based on condition and impact, increasing the efficiency of its Public Works road crews. Analyzing video of streets also gave the city visibility into issues it wasn’t previously aware of, such as curbs, gutters, and manhole covers that had been mistakenly paved over and need to be excavated. The ML process is easily transferrable to other concerns as well, helping the city identify illegal signs or spools of cable hanging on light posts that could be potentially unsafe.
Helping communities recover and thrive
Memphis is also having success in analyzing predictive trends to combat high rates of abandoned and blighted properties, surpassing 97.5 percent accuracy. “In the past, Public Works experimented with comprehensive, city-wide blight identification by using approximately 200 volunteers to survey and photograph over 237,000 city parcels. This effort was costly, took a long time to complete, and resulted in inconsistent data collection,” says Robert. “Blighted property conditions can change quickly in a city the size of Memphis. Now, with this new technology, Memphis will be able to make a significant difference in the efforts to proactively and comprehensively identify and manage blighted and substandard properties.”
Code Enforcement with better data-driven detection mechanisms enables the city to also identify cases where homeowners are not physically or financially able to keep up with the challenges of homeownership and make them aware of resources that are available to assist them. Memphis Code Enforcement can do a better job of finding people living in derelict properties that pose hazards to inhabitants’ health and safety, and help them fix those problems or find a new place to live.
“Using SpringML and Google Cloud Platform to detect indicators of vacant or blighted properties will help Memphis create safer neighborhoods that will be more attractive to businesses and home buyers,” says Mike. “Property values and employment will go up, crime will go down, and social services can be more focused and effective.”
Revolutionizing service delivery for citizens
Memphis is proving the viability of a cost-effective, cloud-based machine learning model that other cities can follow. The city is already looking into new applications of AI and ML that will further improve city services and help it build a better future for its 652,000 residents.
As part of his commitment to a transparent government, Memphis Mayor Jim Strickland created an open data policy that commits to releasing raw data and sharing it with citizens in a variety of downloadable formats. Going forward, this transparency will help citizens understand how their needs are being served and uncover new, innovative use cases for AI and ML.
“Our goal is to become a smart city, and technologies such as Google Cloud Platform and SpringML put us ahead of the game,” says Mayor Strickland. “Google understands data, and there isn’t a better company to help us analyze our data resources for actionable insights.”
Apollo24|7 partnered with Google Cloud to build the Clinical Decision Support System (CDSS) together

2742
Of your peers have already read this article.
4:30 Minutes
The most insightful time you'll spend today!
Clinical Decision Support System (CDSS) is an important technology for the healthcare industry that analyzes data to help healthcare professionals make decisions related to patient care. The market size for the global clinical decision support system appears poised for expansion, with one study predicting a compound annual growth rate (CAGR) of 10.4%, from 2022 to 2030, to $10.7 billion.
For any health organization that wants to build a CDSS system, one key block is to locate and extract the medical entities that are present in the clinical notes, medical journals, discharge summaries, etc. Along with entity extraction, the other key components of the CDSS system are capturing the temporal relationships, subjects, and certainty assessments.
At Google Cloud, we know how critical it is for the healthcare industry to build CDSS systems, so we worked with Apollo 24|7, the largest multi-channel digital healthcare platform in India, to build the key blocks of their CDSS solution.
We helped them to parse the discharge summaries and prescriptions to extract the medical entities. These entities can then be used to build a recommendation engine that would help doctors with the “Next Best Action” recommendation for medicines, lab tests, etc.
Let’s take a sneak peek at Apollo 24|7’s entity extraction solutions, and the various Google AI technologies that were tested to form the technology stack.
Datasets Used
To perform our experiments on entity extraction, we used two types of datasets.
- i2b2 Dataset – i2b2 is an open-source clinical data warehousing and analytics research platform that provides annotated deidentified patient discharge summaries made available to the community for research purposes. This dataset was primarily used for training and validation of the models.
- Apollo 24|7’s Dataset – De-identified doctor’s notes from Apollo24|7 were used for testing. Doctors annotated them to label the entities and offset values.
Experimentation and choosing the right approach — Four models put to test
For entity extraction, both Google Cloud products and open-source approaches were explored. Below are the details:
- Healthcare Natural Language API: This is a no-code approach that provides machine learning solutions for deriving insights from medical text. Using this, we parsed unstructured medical text and then generated a structured data representation of the medical knowledge entities stored in the data for downstream analysis and automation. The process includes:
- Extract information about medical concepts like diseases, medications, medical devices, procedures, and their clinically relevant attributes;
- Map medical concepts to standard medical vocabularies such as RxNorm, ICD-10, MeSH, and SNOMED CT (US users only);
- Derive medical insights from text and integrate them with data analytics products in Google Cloud.
The advantage of using this approach is that it not only extracts a wide range of entity types like MED_DOSE, MED_DURATION, LAB_UNIT, LAB_VALUE, etc, but also captures functional features such as temporal relationships, subjects, and certainty assessments, along with the confidence scores. Since it is available on Google Cloud, this offers long-term product support. It is also the only fully-managed NLP service among all the approaches tested and hence, it requires the least effort to implement and manage.
But one thing to keep in mind is that since the Healthcare NL API offers natural language models that are pre-trained, it currently cannot be used for custom entity extraction models trained using custom annotated medical text or to extract custom entities. This has to be done via AutoML Entity Extraction for Healthcare, another Google Cloud service for custom model development. Custom model development is important for adapting the pre-trained models to new languages or region-specific natural language processing, such as medical terms whose use may be more prevalent in India than in other regions
- Vertex AutoML Entity Extraction for Healthcare: This is a low-code approach that’s already available on Google Cloud. We used AutoML Entity Extraction to build and deploy custom machine learning models that analyzed documents, categorized them, and identified entities within them. This custom machine learning model was trained on the annotated dataset provided by the Apollo 24|7 team.
The advantage of AutoML Entity Extraction is that it gives the option to train on a new dataset. However, one of the prerequisites to keep in mind is that it needs a little pre-processing to capture the input data in the required JSONL format. Since this is an AutoML model just for Entity Extraction, it does not extract relationships, certainty assessments, etc.
- BERT-based Models on Vertex AI: Vertex AI is Google Cloud’s fully managed unified AI platform to build, deploy, and scale ML models faster, with pre-trained and custom tooling. We experimented with multiple custom approaches based on pre-trained BERT-based models, which have shown state-of-the-art performance in many natural language tasks. To gain better contextual understanding of medical terms and procedures, these BERT-based approaches are explicitly trained on medical domain data. Our experiments were based on BioClinical BERT, BioLink BERT, Blue BERT trained on Pubmed dataset, and Blue BERT trained on Pubmed + MIMIC datasets.
The major advantage of these BERT-based models is that they can be finetuned on any Entity Recognition task with minimal efforts.
However, since this is a custom approach, it requires some technical expertise. Additionally, it does not extract relationships, certainty assessments, etc. This is one of the main limitations of using BERT-based models.
- ScispaCy on Vertex AI: We used Vertex AI to perform experiments based on ScispaCy, which is a Python package containing spaCy models for processing biomedical, scientific or clinical text.
Along with Entity Extraction, Scispacy on Vertex AI provides additional components like Abbreviation Detector, Entity Linking, etc. However, when compared to other models, it was less precise, with too many junk phrases, like “Admission Date,” captured as entities.
“Exploring multiple approaches and understanding the pros/cons of each approach helped us to decide the one that would fit our business requirements.” according to Abdussamad M, Engineering Lead at Apollo 24|7.
Evaluation Strategy
In order to match the parsed entity with the test data labels, we used extensive matching logic that comprised of the below four methods:
- Exact Match – Exact match captures entities where the model output and the entities in the test dataset match. Here, the offset values of the entities have also been considered. For example, the entity “gastrointestinal infection” that is present as-is in both the model output and the test label will be considered an “Exact Match.”
- Match-Score Logic – We used a scoring logic for matching the entities. For each word in the test data labels, every word in the model output is matched along with the offset. A score is calculated between the entities and based on the threshold, it is considered as a match.
- Partial Match – In this matching logic, entities like “hypertension” and “hypertensive” are matched based on the Fuzzy logic.
- UMLS Abbreviation Lookup – We also observed that the medical text had some abbreviations, like AP meaning abdominal pain. These were first expanded by doing a lookup on the respective UMLS (Unified Medical Language System) tables and then passed to the individual entity extraction models.
Performance Metrics
We used precision and recall metrics to compare the outcomes of different models/experiments.
Precision (also called positive predictive value) is the fraction of relevant instances among the retrieved instances, while recall (also known as sensitivity) is the fraction of relevant instances that were retrieved.
The below example shows how to calculate these metrics for a given sample.
Example sample: “Krish has fever, headache and feels uncomfortable”
Expected Entities: [“fever”, “headache”]
Model Output: [“fever”, “feels”, “uncomfortable”]
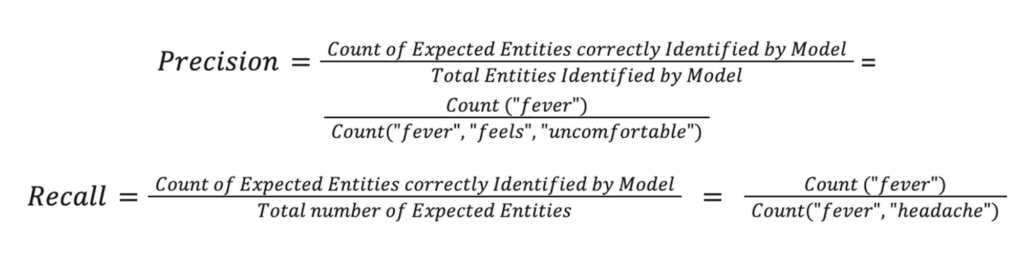
Thus,

Experimentation Results
The following table captures the results of the above experiments on Apollo24|7’s internal datasets.
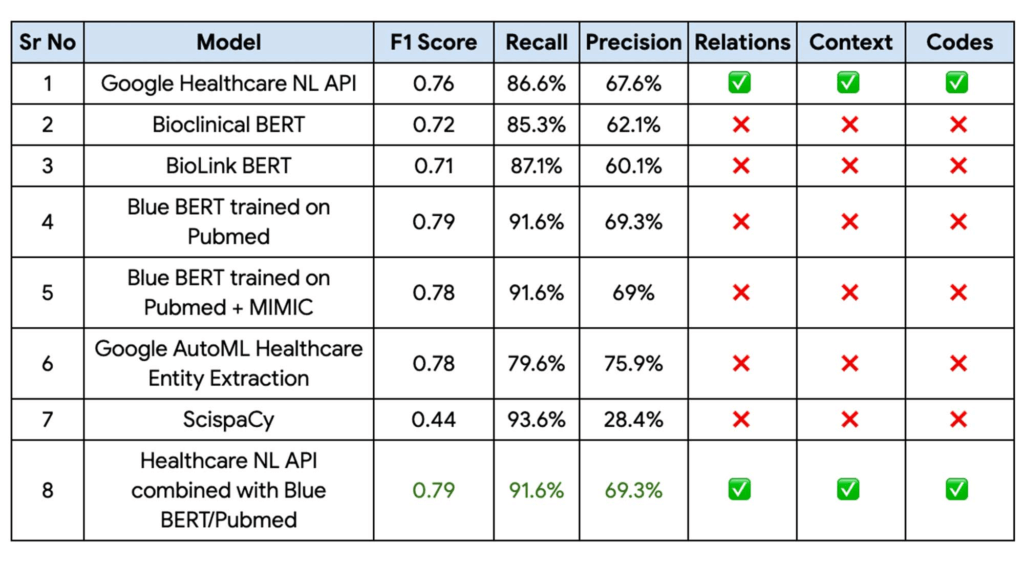
Finally, the Blue BERT model trained on the Pubmed dataset had the best performance metrics with a 81% improvement on Apollo 24|7’s baseline mode with the Healthcare Natural Language API providing the context, relationships, and codes. This performance could be further improved by implementing an ensemble of these two models.
“With the Blue BERT model giving the best performance for entity extraction on Vertex AI and the Healthcare NL API being able to extract the relationships, certainty assessments etc, we finally decided to go with an ensemble of these 2 approaches,“ Abdussamad added.
Fast track end-to-end deployment with Google Cloud AI Services (AIS)
Google AIS (Professional Services Organization) helped Apollo24|7 to build the key blocks of the CDSS system.
The partnership between Google Cloud and Apollo 24|7 is just one of the latest examples of how we’re providing AI-powered solutions to solve complex problems to help organizations drive the desired outcomes. To learn more about Google Cloud’s AI services, visit our AI & ML Products page, and to learn more about Google Cloud solutions for health care, explore our Google Cloud Healthcare Data Engine page.
Acknowledgements
We’d like to give special thanks to Nitin Aggarwal, Gopala Dhar and Kartik Chaudhary for their support and guidance throughout the project. We are also thankful to Manisha Yadav, Santosh Gadgei and Vasantha Kumar for implementing the GCP infrastructure. We are grateful to the Apollo team (Chaitanya Bharadwaj, Abdussamad GM, Lavish M, Dinesh Singamsetty, Anmol Singh and Prithwiraj) and our partner team from HCL/Wipro (Durga Tulluru and Praful Turanur) who partnered with us in delivering this successful project. Special thanks to the Cloud Healthcare NLP API team (Donny Cheung, Amirhossein Simjour, and Kalyan Pamarthy).
Enabling Real-time AI with Streaming Ingestion in Vertex AI

2516
Of your peers have already read this article.
2:30 Minutes
The most insightful time you'll spend today!
Many machine learning (ML) use cases, like fraud detection, ad targeting, and recommendation engines, require near real-time predictions. The performance of these predictions is heavily dependent on access to the most up-to-date data, with delays of even a few seconds making all the difference. But it’s difficult to set up the infrastructure needed to support high-throughput updates and low-latency retrieval of data.
Starting this month, Vertex AI Matching Engine and Feature Store will support real-time Streaming Ingestion as Preview features. With Streaming Ingestion for Matching Engine, a fully managed vector database for vector similarity search, items in an index are updated continuously and reflected in similarity search results immediately. With Streaming Ingestion for Feature Store, you can retrieve the latest feature values with low latency for highly accurate predictions, and extract real-time datasets for training.
For example, Digits is taking advantage of Vertex AI Matching Engine Streaming Ingestion to help power their product, Boost, a tool that saves accountants time by automating manual quality control work.“Vertex AI Matching Engine Streaming Ingestion has been key to Digits Boost being able to deliver features and analysis in real-time. Before Matching Engine, transactions were classified on a 24 hour batch schedule, but now with Matching Engine Streaming Ingestion, we can perform near real time incremental indexing – activities like inserting, updating or deleting embeddings on an existing index, which helped us speed up the process. Now feedback to customers is immediate, and we can handle more transactions, more quickly,” said Hannes Hapke, Machine Learning Engineer at Digits.
This blog post covers how these new features can improve predictions and enable near real-time use cases, such as recommendations, content personalization, and cybersecurity monitoring.

Streaming Ingestion enables real-time AI
As organizations recognize the potential business impact of better predictions based on up-to-date data, more real-time AI use cases are being implemented. Here are some examples:
- Real-time recommendations and a real-time marketplace: By adding Streaming Ingestion to their existing Matching Engine-based product recommendations, Mercari is creating a real-time marketplace where users can browse products based on their specific interests, and where results are updated instantly when sellers add new products. Once it’s fully implemented, the experience will be like visiting an early-morning farmer’s market, with fresh food being brought in as you shop. By combining Streaming Ingestion with Matching Engine’s filtering capability, Mercari can specify whether or not an item should be included in the search results, based on tags such as “online/offline” or “instock/nostock.”

Mercari Shops: Streaming Ingestion enables real-time shopping experiment
- Large-scale personalized content streaming: For any stream of content representable with feature vectors (including text, images, or documents), you can design pub-sub channels to pick up valuable content for each subscriber’s specific interests. Because Matching Engine is scalable (i.e., it can process millions of queries each second), you can support millions of online subscribers for content streaming, serving a wide variety of topics that are changing dynamically. With Matching Engine’s filtering capability, you also have real-time control over what content should be included, by assigning tags such as “explicit” or “spam” to each object. You can use Feature Store as a central repository for storing and serving the feature vectors of the contents in near real time.
- Monitoring: Content streaming can also be used for monitoring events or signals from IT infrastructure, IoT devices, manufacturing production lines, and security systems, among other commercial use cases. For example, you can extract signals from millions of sensors and devices and represent them as feature vectors. Matching Engine can be used to continuously update a list of “the top 100 devices with possible defective signals,” or “top 100 sensor events with outliers,” all in near real time.
- Threat/spam detection: If you are monitoring signals from security threat signatures or spam activity patterns, you can use Matching Engine to instantly identify possible attacks from millions of monitoring points. In contrast, security threat identification based on batch processing often involves potentially significant lag, leaving the company vulnerable. With real-time data, your models are better able to catch threats or spams as they happen in your enterprise network, web services, online games, etc.
Implementing streaming use cases
Let’s take a closer look at how you can implement some of these use cases.
Real-time recommendations for retail
Mercari built a feature extraction pipeline with Streaming Ingestion.
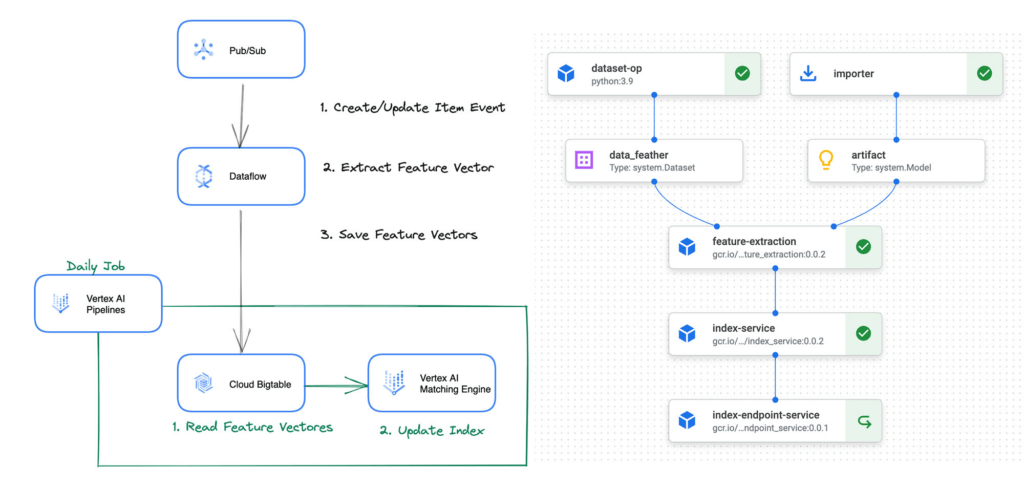
The feature extraction pipeline is defined with Vertex AI Pipelines, and is periodically invoked by Cloud Scheduler and Cloud Functions to initiate the following process:
- Get item data: The pipeline issues a query to fetch the updated item data from BigQuery.
- Extract feature vector: The pipeline runs predictions on the data with the word2vec model to extract feature vectors.
- Update index: The pipeline calls Matching Engine APIs to add the feature vectors to the vector index. The vectors are also saved to Cloud Bigtable (and can be replaced with Feature Store in the future).
“We have been evaluating the Matching Engine Streaming Ingestion and couldn’t believe the super short latency of the index update for the first time. We would like to introduce the functionality to our production service as soon as it becomes GA, ” said Nogami Wakana, Software Engineer at Souzoh (a Mercari group company).
This architecture design can be also applied to any retail businesses that need real-time updates for product recommendations.
Ad targeting
Ad recommender systems benefit significantly from real-time features and item matching with the most up-to-date information. Let’s see how Vertex AI can help build a real-time ad targeting system.
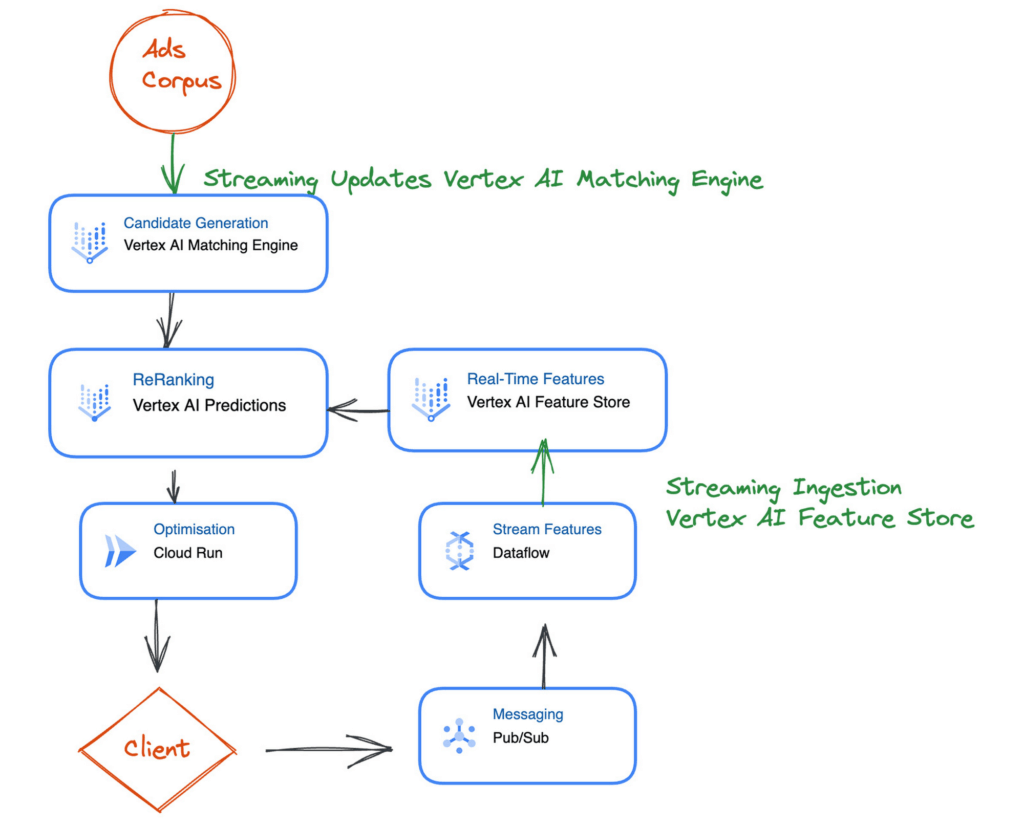
The first step is generating a set of candidates from the ad corpus. This is challenging because you must generate relevant candidates in milliseconds and ensure they are up to date. Here you can use Vertex AI Matching Engine to perform low-latency vector similarity matching, generate suitable candidates, and use Streaming Ingestion to ensure that your index is up-to-date with the latest ads.
Next is reranking the candidate selection using a machine learning model to ensure that you have a relevant order of ad candidates. For the model to use the latest data, you can use Feature Store Streaming Ingestion to import the latest features and use online serving to serve feature values at low latency to improve accuracy.
After reranking the ads candidates, you can apply final optimizations, such as applying the latest business logic. You can implement the optimization step using a Cloud Function or Cloud Run.
What’s Next?
Interested? The documents for Streaming Ingestion are available and you can try it out now. Using the new feature is easy: For example, when you create an index on Matching Engine with the REST API, you can specify the indexUpdateMethod attribute as STREAM_UPDATE.
{
    displayName: "'${DISPLAY_NAME}'",
    description: "'${DISPLAY_NAME}'",
    metadata: {
       contentsDeltaUri: "'${INPUT_GCS_DIR}'",
       config: {
          dimensions: "'${DIMENSIONS}'",
          approximateNeighborsCount: 150,
          distanceMeasureType: "DOT_PRODUCT_DISTANCE",
          algorithmConfig: {treeAhConfig: {leafNodeEmbeddingCount: 10000, leafNodesToSearchPercent: 20}}
       },
    },
    indexUpdateMethod: "STREAM_UPDATE"
}
After deploying the index, you can update or rebuild the index (feature vectors) with the following format. If the data point ID exists in the index, the data point is updated, otherwise, a new data point is inserted.
{

datapoints: [

{datapoint_id: "'${DATAPOINT_ID_1}'", feature_vector: [...]},
        {datapoint_id: "'${DATAPOINT_ID_2}'", feature_vector: [...]}

]
}
It can handle the data point insertion/update at high throughput with low latency. The new data point values will be applied in any new queries within a few seconds or milliseconds (the latency varies depending on the various conditions).
The Streaming Ingestion is a powerful functionality and very easy to use. No need to build and operate your own streaming data pipeline for real-time indexing and storage. Yet, it adds significant value to your business with its real-time responsiveness.
To learn more, take a look at the following blog posts for learning Matching Engine and Feature Store concepts and use cases:
BigQuery Explainable AI for Demystifying the Inner Workings of ML Models. Now GA!

6576
Of your peers have already read this article.
2:00 Minutes
The most insightful time you'll spend today!
Explainable AI (XAI) helps you understand and interpret how your machine learning models make decisions. We’re excited to announce that BigQuery Explainable AI is now generally available (GA). BigQuery is the data warehouse that supports explainable AI in a most comprehensive way w.r.t both XAI methodology and model types. It does this at BigQuery scale, enabling millions of explanations within seconds with a single SQL query.
Why is Explainable AI so important? To demystify the inner workings of machine learning models, Explainable AI is quickly becoming an essential and growing need for businesses as they continue to invest in AI and ML. With 76% of enterprises now prioritizing artificial intelligence (AI) and machine learning (ML) over other initiatives in 2021 IT budgets, the majority of CEOs (82%) believe that AI-based decisions must be explainable to be trusted according to a PwC survey.
While the focus of this blogpost is on BigQuery Explainable AI, Google Cloud provides a variety of tools and frameworks to help you interpret models outside of BigQuery, such as with Vertex Explainable AI, which includes AutoML Tables, AutoML Vision, and custom-trained models.
So how does Explainable AI in BigQuery work exactly? And how might you use it in practice?
Two types of Explainable AI: global and local explainability
When it comes to Explainable AI, the first thing to note is that there are two main types of explainability as they relate to the features used to train the ML model: global explainability and local explainability.
Imagine that you have a ML model that predicts housing price (as a dollar amount), based on three features: (1) number of bedrooms, (2) distance to the nearest city center, and (3) construction date.
Global explainability (a.k.a. global feature importance) describes the features’ overall influence on the model and helps you understand if a feature had a greater influence than other features over the model’s predictions. For example, global explainability can reveal that the number of bedrooms and distance to city center typically has a much stronger influence than the construction date on predicting housing prices. Global explainability is especially useful if you have hundreds or thousands of features and you want to determine which features are the most important contributors to your model. You may also consider using global explainability as a way to identify and prune less important features to improve the generalizability of their models.
Local explainability (a.k.a. feature attributions) describes the breakdown of how each feature contributes towards a specific prediction. For example, if the model predicts that house ID#1001 has a predicted price of $230,000, local explainability would describe a baseline amount (e.g. $50,000) and how each of the features contributes on top of the baseline towards the predicted price. For example, the model may say that on top of the baseline of $50,000, having 3 bedrooms contributed an additional $50,000, close proximity to the city center added $100,000, and construction date of 2010 added $30,000, for a total predicted price of $230,000. In essence, understanding the exact contribution of each feature used by the model to make each prediction is the main purpose of local explainability.
What ML models does BigQuery Explainable AI apply to?
BigQuery Explainable AI applies to a variety of models, including supervised learning models for IID data and time series models. The documentation for BigQuery Explainable AI provides an overview of the different ways of applying explainability per model. Note that each explainability method has its own way of calculation (e.g. Shapley values), which are covered more in-depth in the documentation.

Examples with BigQuery Explainable AI
In this next section, we will show three examples of how to use BigQuery Explainable AI in different ML applications:
Regression models with BigQuery Explainable AI
Let’s use a boosted tree regression model to predict how much a taxi cab driver will receive in tips for a taxi ride, based on features such as number of passengers, payment type, total payment and trip distance. Then let’s use BigQuery Explainable AI to help us understand how the model made the predictions in terms of global explainability (which features were most important?) and local explainability (how did the model arrive at each prediction?).
The taxi trips dataset comes from the BigQuery public datasets and is publicly available in the table: bigquery-public-data.new_york_taxi_trips.tlc_yellow_trips_2018.
First, you can train a boosted tree regression model.
CREATE OR REPLACE MODEL bqml_tutorial.taxi_tip_regression_modelOPTIONS (model_type='boosted_tree_regressor',input_label_cols=['tip_amount'],max_iterations = 50,tree_method = 'HIST',subsample = 0.85,enable_global_explain = TRUE) ASSELECTvendor_id,passenger_count,trip_distance,rate_code,payment_type,total_amount,tip_amountFROM`bigquery-public-data.new_york_taxi_trips.tlc_yellow_trips_2018`WHERE tip_amount >= 0LIMIT 1000000
Now let’s do a prediction using ML.PREDICT, which is the standard way in BigQuery ML to make predictions without explainability.
SELECT *FROMML.PREDICT(MODEL bqml_tutorial.taxi_tip_regression_model,(SELECT"0" AS vendor_id,1 AS passenger_count,CAST(5.85 AS NUMERIC) AS trip_distance,"0" AS rate_code,"0" AS payment_type,CAST(55.56 AS NUMERIC) AS total_amount))

But you might wonder—how did the model generate this prediction of ~11.077?
BigQuery Explainable AI can help us answer this question. Instead of using ML.PREDICT, you use ML.EXPLAIN_PREDICT with an additional optional parameter top_k_features. ML.EXPLAIN_PREDICT extends the capabilities of ML.PREDICT by outputting several additional columns that explain how each feature contributes to the predicted value. In fact, since ML.EXPLAIN_PREDICT includes all the output from ML.PREDICT anyway, you may want to consider using ML.EXPLAIN_PREDICT every time instead.
SELECT *FROMML.EXPLAIN_PREDICT(MODEL bqml_tutorial.taxi_tip_regression_model,(SELECT"0" AS vendor_id,1 AS passenger_count,CAST(5.85 AS NUMERIC) AS trip_distance,"0" AS rate_code,"0" AS payment_type,CAST(55.56 AS NUMERIC) AS total_amount),STRUCT(6 AS top_k_features))

The way to interpret these columns is:
Σfeature_attributions + baseline_prediction_value = prediction_value
Let’s break this down. The prediction_value is ~11.077, which is simply the predicted_tip_amount. The baseline_prediction_value is ~6.184, which is the tip amount for an average instance. top_feature_attributions indicates how much each of the features contributes towards the prediction value. For example, total_amount contributes ~2.540 to the predicted_tip_amount.
ML.EXPLAIN_PREDICT provides local feature explainability for regression models. For global feature importance, see the documentation for ML.GLOBAL_EXPLAIN.
Classification models with BigQuery Explainable AI
Let’s use a logistic regression model to show you an example of BigQuery Explainable AI with classification models. We can use the same public dataset as before: bigquery-public-data.new_york_taxi_trips.tlc_yellow_trips_2018.
Train a logistic regression model to predict the bracket of the percentage of the tip amount out of the taxi bill.
CREATE OR REPLACE MODEL bqml_tutorial.taxi_tip_classification_modelOPTIONS(model_type='logistic_reg',input_label_cols=['tip_bucket'],enable_global_explain=true) ASSELECTvendor_id,passenger_count,trip_distance,rate_code,payment_type,total_amount,CASEWHEN tip_amount > total_amount*0.20 THEN '20% or more'WHEN tip_amount > total_amount*0.15 THEN '15% to 20%'WHEN tip_amount > total_amount*0.10 THEN '10% to 15%'ELSE '10% or less'END AS tip_bucketFROM`bigquery-public-data.new_york_taxi_trips.tlc_yellow_trips_2018`WHERE tip_amount >= 0LIMIT 1000000
Next, you can run ML.EXPLAIN_PREDICT to get both the classification results and the additional information for local feature explainability. For global explainability, you can use ML.GLOBAL_EXPLAIN. Again, since ML.EXPLAIN_PREDICT includes all the output from ML.PREDICT anyway, you may want to consider using ML.EXPLAIN_PREDICT every time instead.
SELECT *FROMML.EXPLAIN_PREDICT(MODEL bqml_tutorial.taxi_tip_classification_model,(SELECT"0" AS vendor_id,1 AS passenger_count,CAST(5.85 AS NUMERIC) AS trip_distance,"0" AS rate_code,"0" AS payment_type,CAST(55.56 AS NUMERIC) AS total_amount),STRUCT(6 AS top_k_features))

Similar to the regression example earlier, the formula is used to derive the prediction_value:
Σfeature_attributions + baseline_prediction_value = prediction_value
As you can see in the screenshot above, the baseline_prediction_value is ~0.296. total_amount is the most important feature in making this specific prediction, contributing ~0.067 to the prediction_value, though followed by trip_distance. The feature passenger_count contributes negatively to prediction_value by -0.0015. The features vendor_id, rate_code, and payment_type did not seem to contribute much to the prediction_value.
You may wonder why the prediction_value of ~0.389 doesn’t equal the probability value of ~0.359. The reason is that unlike for regression models, for classification models, prediction_value is not a probability score. Instead, prediction_value is the logit value (i.e., log-odds) for the predicted class, which you could separately convert to probabilities by applying the softmax transformation to the logit values. For example, a three-class classification has a log-odds output of [2.446, -2.021, -2.190]. After applying the softmax transformation, the probability of these class predictions is [0.9905, 0.0056, 0.0038].
Time-series forecasting models with BigQuery Explainable AI

Explainable AI for forecasting provides more interpretability into how the forecasting model came to its predictions. Let’s go through an example of forecasting the number of bike trips in NYC using the new_york.citibike_trips public data in BigQuery.
You can train a time-series model ARIMA_PLUS:
CREATE OR REPLACE MODEL bqml_tutorial.nyc_citibike_arima_modelOPTIONS(model_type = 'ARIMA_PLUS',time_series_timestamp_col = 'date',time_series_data_col = 'num_trips',holiday_region = 'US') ASSELECTEXTRACT(DATE from starttime) AS date,COUNT(*) AS num_tripsFROM`bigquery-public-data.new_york.citibike_trips`GROUP BY dateNext, you can first try forecasting without explainability using ML.FORECAST:SELECT*FROMML.FORECAST(MODEL bqml_tutorial.nyc_citibike_arima_model,STRUCT(365 AS horizon, 0.9 AS confidence_level))
This function outputs the forecasted values and the prediction interval. Plotting it in addition to the input time series gives the following figure.

But how does the forecasting model arrive at its predictions? Explainability is especially important if the model ever generates unexpected results.
With ML.EXPLAIN_FORECAST, BigQuery Explainable AI provides extra transparency into the seasonality, trend, holiday effects, level (step) changes, and spikes and dips outlier removal. In fact, since ML.EXPLAIN_FORECAST includes all the output from ML.FORECAST anyway, you may want to consider using ML.EXPLAIN_FORECAST every time instead.
SELECT*FROMML.EXPLAIN_FORECAST(MODEL bqml_tutorial.nyc_citibike_arima_model,STRUCT(365 AS horizon, 0.9 AS confidence_level))

Compared to the previous figure which only shows the forecasting results, this figure shows much richer information to explain how the forecast is made.
First, it shows how the input time series is adjusted by removing the spikes and dips anomalies, and by compensating the level changes. That is:
time_series_adjusted_data = time_series_data - spikes_and_dips - step_changes
Second, it shows how the adjusted input time series is decomposed into different components such as both weekly and yearly seasonal components, holiday effect component and trend component. That is
time_series_adjusted_data = trend + seasonal_period_yearly + seasonal_period_weekly + holiday_effect + residual
Finally, it shows how these components are forecasted separately to compose the final forecasting results. That is:
time_series_data = trend + seasonal_period_yearly + seasonal_period_weekly + holiday_effect
For more information on these time series components, please see the documentation here.
Conclusion
With the GA of BigQuery Explainable AI, we hope you will now be able to interpret your machine learning models with ease.
Thanks to the BigQuery ML team, especially Lisa Yin, Jiashang Liu, Amir Hormati, Mingge Deng, Jerry Ye and Abhinav Khushraj. Also thanks to the Vertex Explainable AI team, especially David Pitman and Besim Avci.

Customer Voices: How Firms from Across Industries Leverage Google Cloud
DOWNLOAD CASE STUDY14144
Of your peers have already downloaded this article
1:30 Minutes
The most insightful time you'll spend today!
From powering everyday operations and accelerating application innovation, to providing tools for specific business needs and executing on big ideas, to advancing the security of technology solutions, companies from across industries have leveraged Google Cloud for business benefits.
Companies from across industries have turned to Google Cloud for transforming their business, modernizing their infrastructure, and gleaning intelligence from data. For instance:
- Johnson & Johnson achieved a 41% increase in search results from high-quality job applicants, significantly improving the company’s ability to quickly hire top talent.
- Sony Network Communications now processes 10 billion monthly queries faster, which advances data analysis.
- University College Dublin saw significant 6-figure savings by eliminating legacy hardware, software, and maintenance.
And there are many such examples. Read the collection of case studies to find out how companies from across industries and geographies leveraged Google Cloud for measurable business benefits and for solving complex problems.
Woolaroo App and Vision AI are Helping Users Explore Native Languages

4835
Of your peers have already read this article.
1:30 Minutes
The most insightful time you'll spend today!
One of the most vibrant elements of culture is the use of native languages and the time-honored tradition of storytelling. Anthropologists and linguists have been vocal on the role that language plays in the preservation of culture and how it contributes to the appreciation of heritage.
Unfortunately, of the more than 7,000 languages that are spoken around the globe, nearly 3,000 are at risk of disappearing. In fact, it’s estimated that on average a language becomes extinct every fourteen days. Google Arts & Culture realized that with some creative technology and partnering with language organisations, we could help create an interactive and educational tool to help promote them.
Enter Woolaroo, an open-source photo-translation platform powered by machine learning and image recognition. The application was built on Google Cloud to encourage users to explore endangered languages around the world. Users are able to take a picture of an object in real-time, and the application returns the word in its native language, along with its pronunciation.
Woolaroo was created with the philosophy that learning languages is greatly enhanced through engagement and context. By seeing an object in its environment, it’s easier to retain the information and then use it more naturally in conversation.
With the help of Googlers, Woolaroo was launched in 10 languages, including Calabrian Greek, Louisiana Creole, Maori and Yiddish. During the conception stage of the app, teams from Partner Innovation and Google Arts & Culture put out an open call to the rest of Google to see what lesser-known languages our employees spoke. They then worked with the individuals that responded to develop dictionaries that were reviewed by partner institutions to ensure translations were correct and consistent.
Woolaroo uses Google Cloud Vision API, which derives insights from images using AutoML or pre-trained models to quickly classify images into millions of predefined categories. This makes AI accessible and useful to more people as AutoML automates the training of these machine learning models.
Our team at Google Arts & Culture creates immersive experiences for people to learn about art, history, culture and more. We are committed to supporting the preservation of heritage and cultural landmarks – including spoken language – through the use of modern technology. The magic of Woolaroo is that it is open source, which means any person or organisation can use it to build something for their own endangered language. To learn about the efforts Google Arts & Culture is involved in, download the Google Arts & Culture app or visit our blog.
More Relevant Stories for Your Company

ESG Did the Math: It’s Cheaper and Smarter to Migrate Enterprise Data Warehouses to Google BigQuery. Way Smarter
Enterprise data warehouses (EDWs) are often deemed the most valuable asset in the data center, serving as the backbone of the business. The ongoing insight gained from these solutions has justified the significant up-front capital investments and ongoing operational costs, but the rigidity of the traditional EDW is forcing organizations

How to Enhance Incremental Pipeline Performance while Ingesting Data into BigQuery
When you build a data warehouse, the important question is how to ingest data from the source system to the data warehouse. If the table is small you can fully reload a table on a regular basis, however, if the table is large a common technique is to perform incremental

Google Cloud’s Recommendation AI Helps Bazaarvoice with 60 Percent increase in CTR
Not long ago, building AI into recommendation engines was a daunting, expensive task that could take years to get off the ground. But as Bazaarvoice has shown, with the help of cloud services, the time from AI investment to business outcomes is shorter than ever. Bazaarvoice is the leading provider

Innovate Faster & More Flexibly: How Our Commitment to Open Source Unlocks AI and ML Innovation
At Google, we believe anyone should be able to quickly and easily turn their artificial intelligence (AI) idea into reality. Open source software (OSS) has become increasingly important to this goal, heavily influencing the pace of innovation in AI and machine learning (ML) ecosystems. Over the last two decades, ML
