





How Russia’s Largest Housing Developer Reduced Construction Planning Time from Two Weeks to One Hour

4609
Of your peers have already read this article.
2:30 Minutes
The most insightful time you'll spend today!
PIK Group is the leading developer of large-scale residential housing projects in Russia. Founded in 1994, PIK Group has built more than 300,000 apartments – 19 million square meters of residential real estate in Moscow and other cities.
To achieve and maintain its position at the top of the real estate industry, PIK Group has made innovation central to its business model, whether creating new building techniques or embracing automation. New technology, in particular, enables the company to achieve efficiencies at scale and streamline processes, such as with PIK Group’s app, developed in-house, through which engineers can send photographs as evidence of the quality of building work.
PIK Group looked for a reliable, fast way for teams to collaborate across multiple offices, on the road, and at construction sites. Because the company handles large volumes of sensitive customer data, security was a key concern. To create a collaboration platform ready to pull the company together, PIK Group looked for a cloud solution to streamline processes and improve productivity.
“The construction industry is progressing,” says Ilya Tikhomirov, CIO at PIK Group. “There are new ways of working, new construction processes, and new materials. PIK wants to lead change in that external context with an internal transformation.”
Automating collaborative processes for greater efficiency
“One team has information about the layout and condition of our buildings and can count the areas that need work, but then needs to match prices and the required work to that information. Previously, we would spend two to three weeks matching all the lists. Now, using Google Apps Script and Sheets, we can run calculations for a building in one hour.”
– Sergey Fuksman, Deputy CIO, PIK Group
Real estate companies of any size have to communicate between office-based staff and teams on the move. For PIK Group, with more than 7,000 employees and 70 offices in the Moscow region alone, communication has to operate at scale. Because each project involves multiple participants and numerous stages, the right collaboration tools can generate major efficiencies.
“Take costing and scheduling work in an apartment. What might sound simple is a complex process with numerous stages, says Ilya. “We need to define each and every step, and the materials required. One group of employees says what the task requires, then another group of employees cost the materials and labor, and yet another group matches the costs to the plan. That process alone requires a lot of communication and collaboration, and it’s just one of many in a single project.” To enhance collaboration, PIK Group looked to give staff instant access to a central, highly secure file repository from anywhere at anytime.
“It’s so much easier to work with our 2,000 suppliers when we share Docs and Sheets instead of emailing back and forth. The speed and convenience of this new way of working is immediately clear. A number of our third-party contractors have been so impressed that they’ve implemented G Suite at their own firms.”
– Ilya Tikhomirov, CIO, PIK Group
To do that, PIK Group implemented the full range of G Suite collaborative tools across more than 7,000 employees. “G Suite has helped change the way employees think about the work they do,” says Ilya. “It has helped them to foster the culture of a small start-up, with all of the agility associated with that.” Now staff at more than 70 offices in the Moscow region managing the construction and sale of apartment blocks, meet and communicate using Google Hangouts and collaborate over distance on Google Sheets and Google Docs, reducing the need to travel and increasing their efficiency by approximately 20%.
In order to reduce the complex, laborious work of prototyping projects, PIK Group automates aspects of the process using Google Apps Script to match lists in different Sheets and generate documents, as Sergey Fuksman, Deputy CIO at PIK Group explains: “One team has information about the layout and condition of our buildings and can count the areas that need work, but then need to match prices and the required work to that information. Previously, we would spend two to three weeks matching all the lists. Now, using Apps Script and Sheets, we can run calculations for a building in one hour.”
Migrating to the cloud for machine learning at scale
With over 7,000 G Suite accounts implemented, PIK Group has set its sights on migrating local infrastructure to Google Cloud Platform. “We have a big IT department with many developers, and we want to redirect them to important projects instead of IT maintenance,” says Ilya. “With machine learning and TensorFlow, we plan to use data from over 50 systems to inform business decisions.”
PIK Group’s internal change is already yielding external results. “It’s so much easier to work with our 2,000 suppliers when we share Docs and Sheets instead of emailing back and forth,” says Ilya. “The speed and convenience of this new way of working is immediately clear. A number of our third-party contractors have been so impressed that they’ve implemented G Suite at their own firms.”
Bringing Multiple Security Elements Together: Chrome

5392
Of your peers have already read this article.
2:00 Minutes
The most insightful time you'll spend today!
Security and the way we’ve been able to advance user protections over the years is hands down one of my favorite topics when it comes to Chrome. I’ve been on the Chrome team for over 14 years and have seen the browser evolve to become a critical tool that helps people get work done at home or in the office. At the same time, Chrome is often the best line of defense to protect users against malicious software on the internet.
Now more than ever, security has to be top of mind for IT and security teams. Cybercrime is up 600% due to the COVID-19 pandemic, and remote work has increased the average cost of a data breach by $137,000. Those numbers are staggering. And IT teams need to make sure every piece of their tech stack helps support their security needs.
Chrome has worked for years to quickly mitigate risks, block malicious sites and content, and proactively improve web security to keep your users and corporate data safe, pioneering new layered defenses like sandboxing and site isolation. When we think of security and Chrome, we believe it takes multiple elements of security coming together to give organizations the best protection possible.
Security you don’t have to think about: Chrome has many built in protections in place by default that benefit all users. This includes our team’s work to minimize zero days and roll out fixes quickly. With auto updates enabled, Chrome offers enterprises fast and automatic fixes for zero day vulnerabilities. The Chrome security team recently published a post explaining the state of in-wild-bugs that’s worth a read. More examples of the defense-in-depth Chrome offers include capabilities like site isolation and sandboxing that keep malicious code from affecting other visited sites or impacting user machines. Our scanning infrastructure helps us detect and remove harmful extensions from the Chrome Web Store (in fact, last year we saw an almost 90% drop in malware) to prevent your end users from getting infected with malicious extensions. These are protections built directly into Chrome that automatically keep your users and organization safe.
Protections for Chrome users: We provide additional layers of protection that keep your end users safe while they’re on the web and give them helpful information whenever there are potential security risks. For example, Safe Browsing, offered natively in Chrome, helps protect devices by showing warnings to users when they attempt to navigate to dangerous sites or download malicious files. We also give users insights into the safety of their passwords, letting them know if their passwords have been compromised, or even prompting them to change their corporate password if they try to re-use it against company policies. You users are working hard to get things done, and Chrome’s layered security supports their workflows while helping them stay safe on the web.
Enterprise Controls: Every organization has unique security needs. That’s why Chrome provides enterprises with advanced safeguards and granular policy management to help meet those security goals. With hundreds of policy options, admins can use a variety of management tools, including Chrome Browser Cloud Management, to customize the browser. Chrome Browser Cloud Management goes even further, providing powerful enterprise extension management, a security priority for many organizations. Our extension request workflow allows end users to request extensions and admins to allow or deny extension requests. We also recently released extension pinning that allows admins to pin to specific versions of extensions to support any internal security review processes.
Visibility and reporting is another focus area to support IT teams. Through Chrome Browser Cloud Management, administrators can get more insight into their browser environment. This data can help IT teams make security decisions, better understand the devices running Chrome and investigate if issues arise.
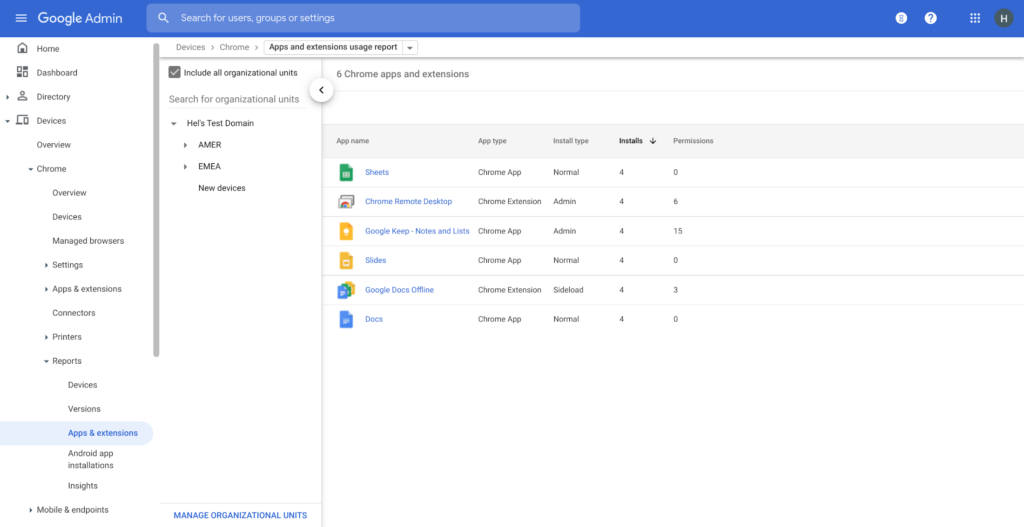
Zero trust security: Finally, Chrome can help modernize an enterprise’s security strategy by migrating to Zero Trust access models. BeyondCorp Enterprise helps secure endpoints by directly integrating Threat and Data Protection in Chrome. This protects against intentional or accidental data loss and prevents malware and phishing in real-time. Additionally, Chrome and BeyondCorp Enterprise provide device trust and endpoint security signals directly from the browser, significantly easing deployment of zero-trust in your environment. In 2022, we plan to partner with leading players in the cybersecurity and zero trust space to add additional integrations.
For security recommendations, check out the new Chrome 2.1 CIS Benchmark that covers independent recommendations on which Chrome policies to configure to help support organizations’ security and compliance needs.
CARTO’s Data Visualization Powered by Google Cloud and deck.g

4092
Of your peers have already read this article.
7:00 Minutes
The most insightful time you'll spend today!
Editor’s note: Today’s blog post is from Alberto Asuero, CTO of CARTO, the location intelligence platform. Today he shares more details about the source of the data for advanced data visualizations created with Google Maps Platform and deck.gl and how the CARTO platform enables this workflow.
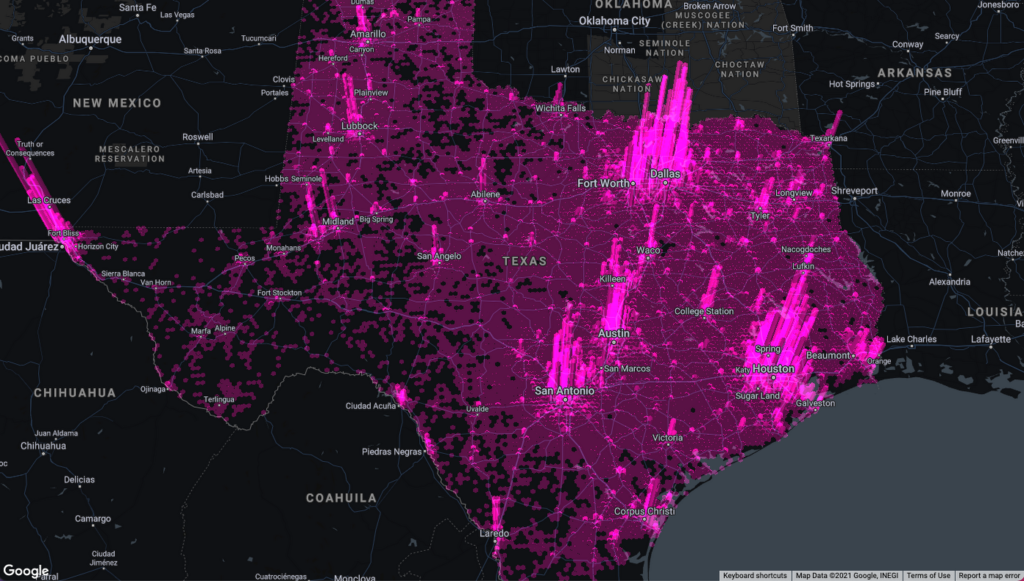
During Google Cloud Next in October, the Google team announced the newest release of the deck.gl visualization library, thanks to a collaboration with our geospatial company CARTO and the vis.gl Technical Steering Committee (TSC). The deck.gl release includes a deep integration with the new WebGL-powered features in the Maps JavaScript API that allows deck.gl to render 2D and 3D visualizations directly on the Google basemap.
Our team built an example app that visualizes a variety of data sources that show the potential for electrification of truck fleets in Texas. This app showcases the different types of advanced data visualizations that can be created with Google Maps Platform and deck.gl. Today, I want to share more details about the source of the data for these visualizations and how the CARTO platform enables this workflow.
Google Cloud provides a strong serverless data warehousing solution, BigQuery, with support for geospatial queries. When you are dealing with spatial data, creating maps to explore and visualize these datasets is an important and common need. The CARTO Spatial Extension for BigQuery provides an easy way to create connections to the data warehouse, design a map with data coming from BigQuery tables, and then add these visualizations to a web app using deck.gl.
Making a simple map
To create a simple map using the CARTO platform, you can sign up for a trial account. Once you have signed in, you can set up a connection to your BigQuery instance using a service account. Then, you can go to the Data Explorer and browse the available datasets to find the table you want to use as the datasource in your map. For more information, check out the CARTO documentation.
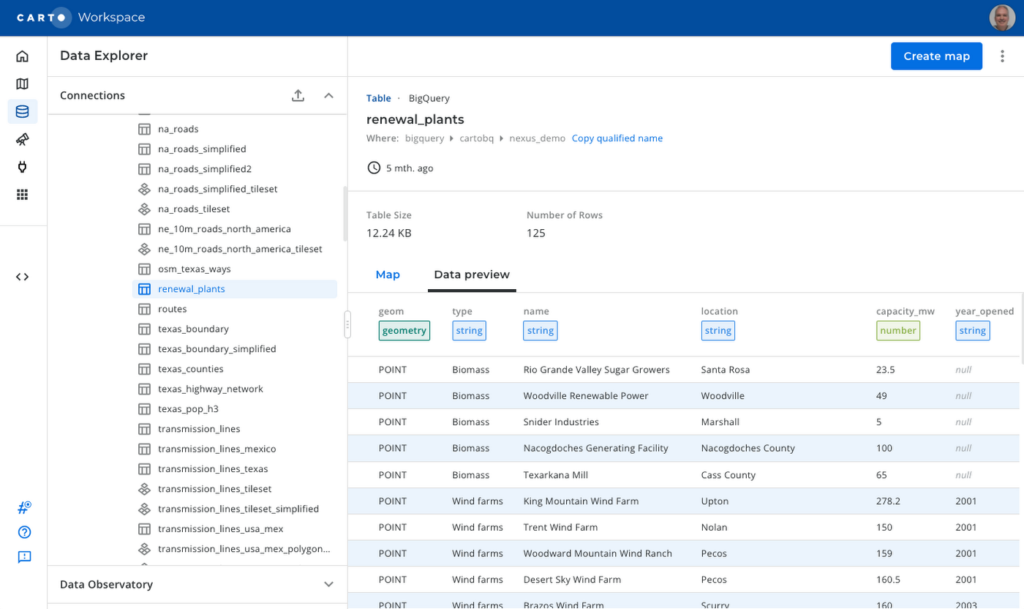
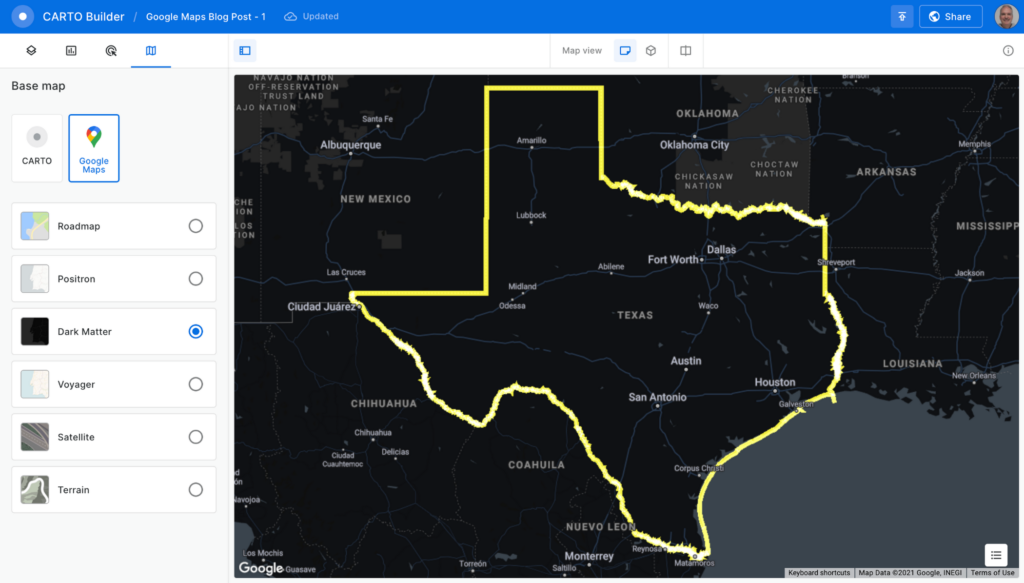
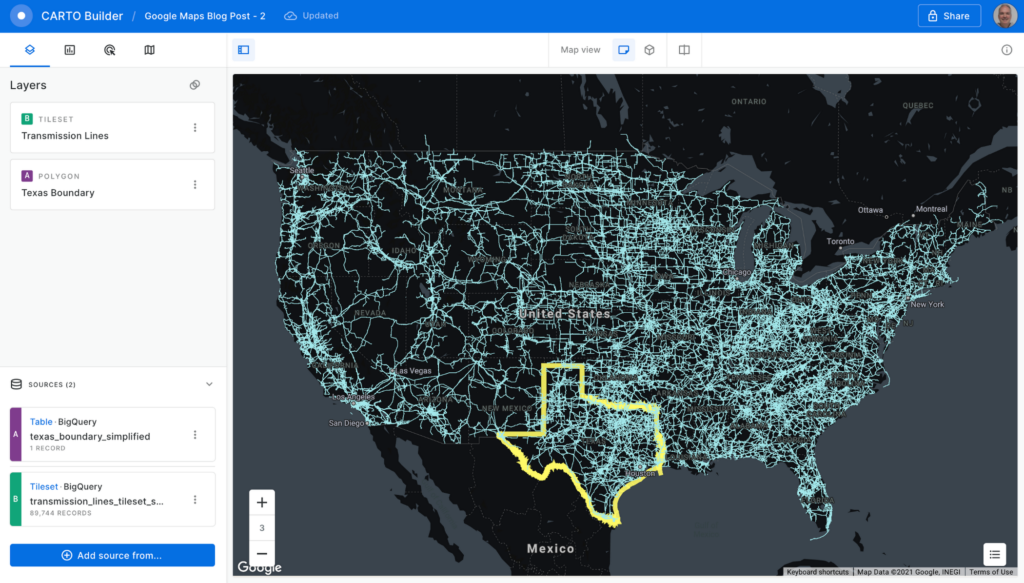
To create a visualization of power transmission lines in Texas, you can start with the Texas state boundary to provide some context. In the Data Explorer, you can preview the table and click the “Create map” button in the top-right corner to start designing your visualization.
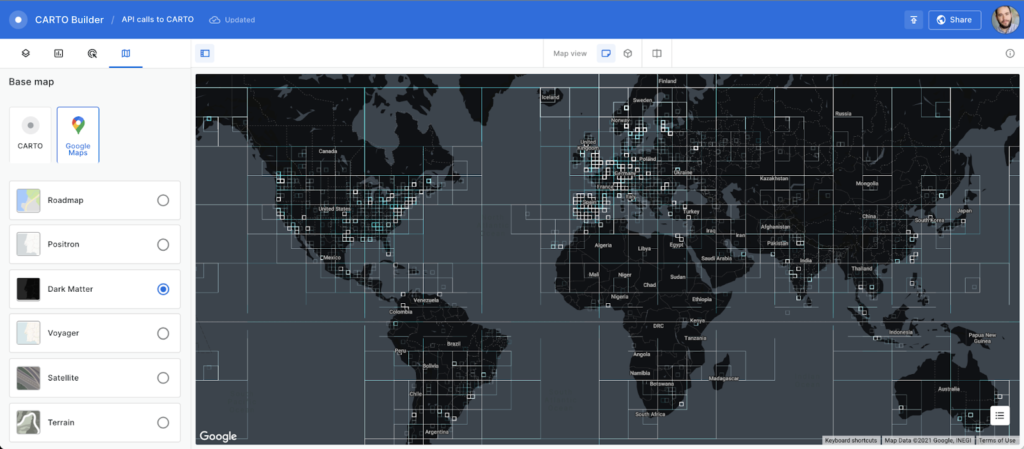
Using the CARTO Builder map making tool, select one of the available Google vector basemap styles and customize the layer style.
You can visualize tables and the results from queries executed in the data warehouse, which is a powerful feature because you can also execute spatial analysis functions using SQL, including those from the CARTO Analytics Toolbox. In this case, you can intersect the lines in the table containing all the U.S. transmission lines within the Texas boundary. Click on the “Add source from…” button and select the “Custom Query (SQL)” option to add the following query:
SELECT *FROM cartobq.nexus_demo.transmission_linesWHERE ST_INTERSECTS(geometry,(SELECT geom FROM cartobq.nexus_demo.texas_boundary_simplified));
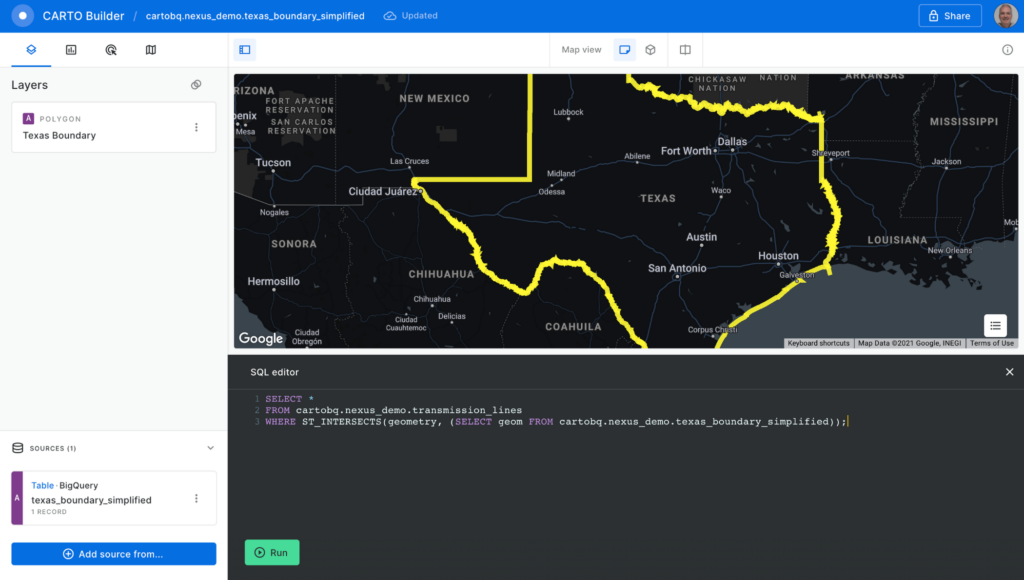
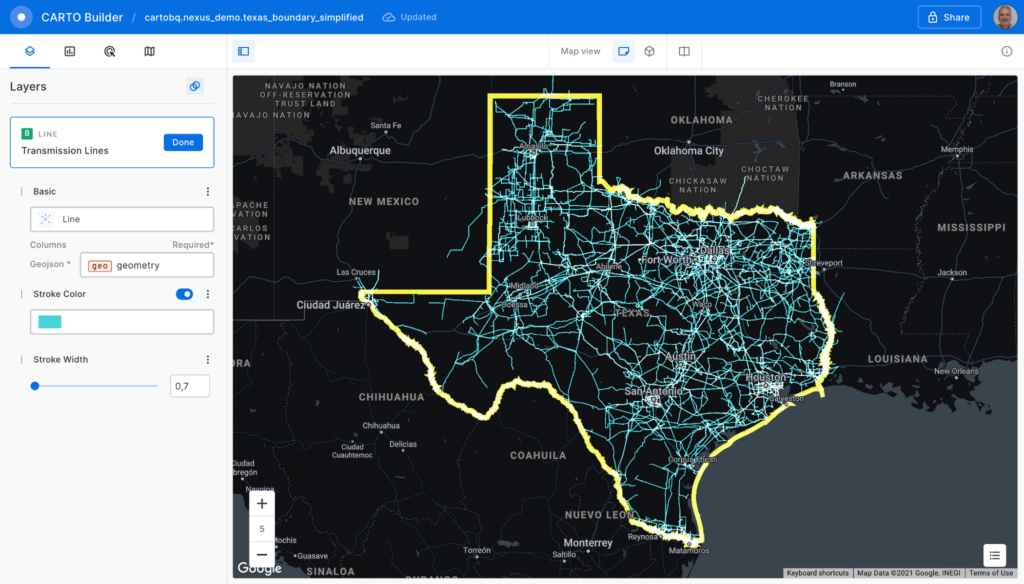
Click the “Run” button, and the query is executed in BigQuery. The results are sent back to the Builder tool. Perform some style customizations in the new layer, and your map is ready.
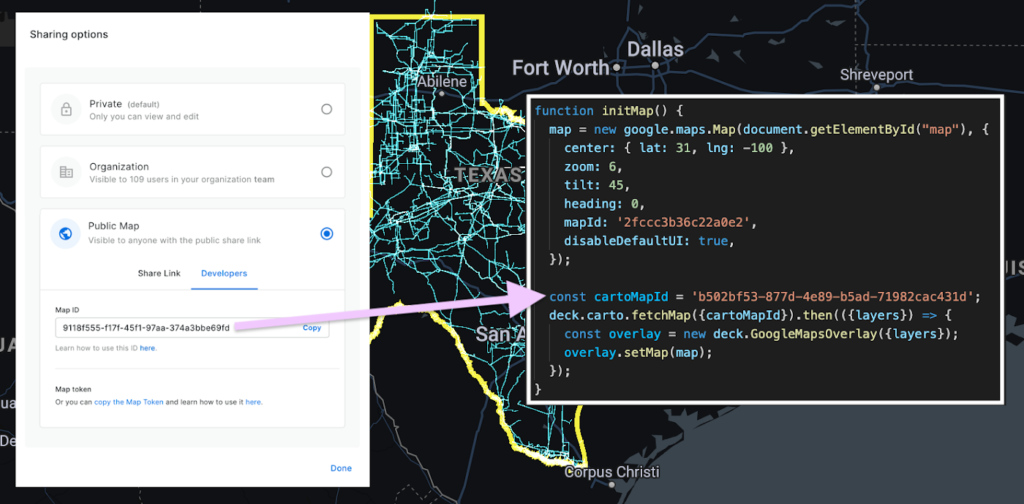
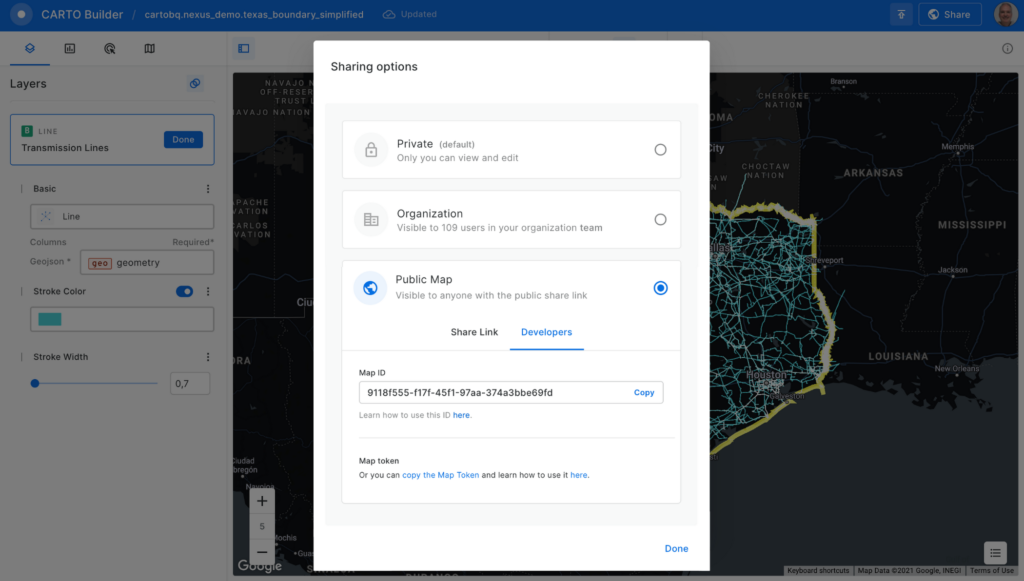
Before adding the map to the Google Maps Platform application, you’ll need to make it public. Click on the “Share” button and select the “Developers” tab to copy the map ID.
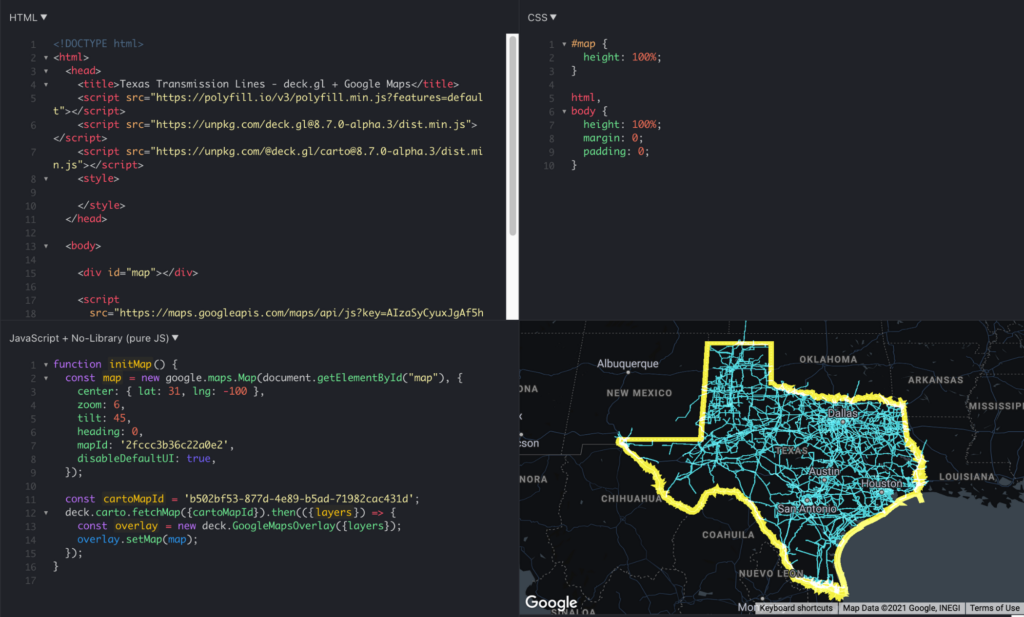
Now, you can add the visualization into your Google Maps Platform application, which is as easy as adding these four lines of code:
const cartoMapId = 'b502bf53-877d-4e89-b5ad-71982cac431d'; deck.carto.fetchMap({cartoMapId}).then(({layers}) => { const overlay = new deck.GoogleMapsOverlay({layers}); overlay.setMap(map); });
You can use the map ID copied from CARTO Builder to call the fetchMap function. This function connects to the platform and retrieves all the information needed for the visualization, including a collection of deck.gl layers with all the styling properties you’ve specified. Create an instance of the deck.gl GoogleMapsOverlay with this collection of layers and add it to the map.
You can see the full example in this fiddle.
Visualizing very large datasets
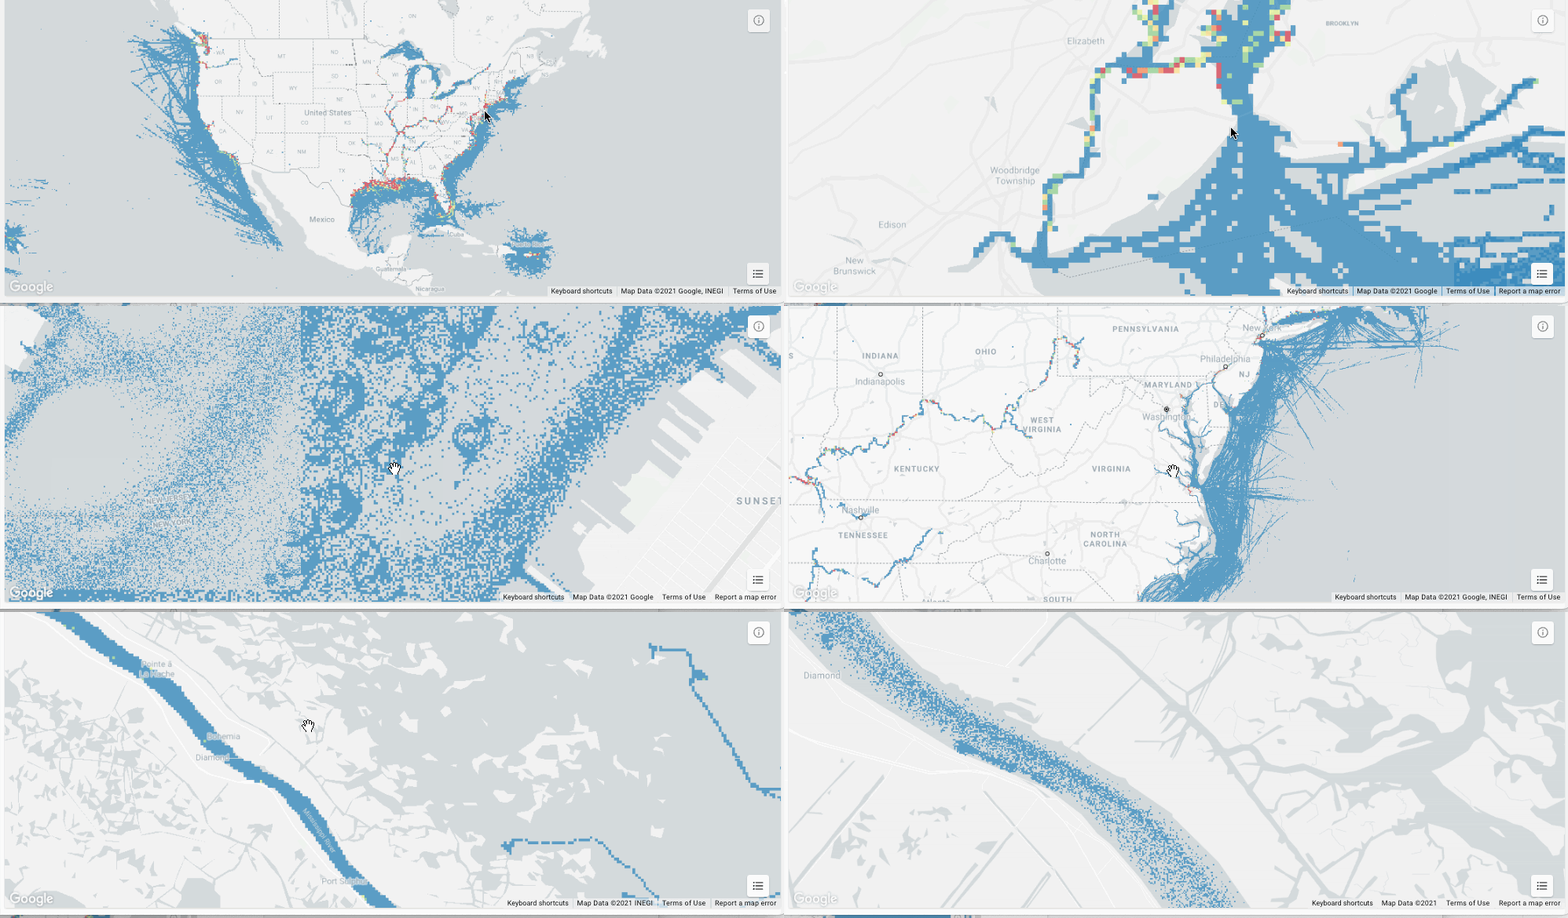
One of the main features of BigQuery is the ability to scale processing to massive datasets. With the CARTO platform, you can also visualize very large datasets using tilesets, an optimized data structure containing pre-generated vector tiles for fast visualization. Tilesets are generated within BigQuery using the Analytics Toolbox functions in a parallelized process that can handle billions of points.
For example, you can create a visualization using tilesets with the whole dataset of transmission lines for the U.S., more than 100MB of geometries.
The issue with these large datasets is that they do not fit in memory all at once, so you need to split them into tiles for them to be rendered progressively. CARTO takes care of this, allowing you to create tilesets directly in BigQuery or dynamically generate them on the fly.
This method for data loading in maps can scale as much as needed; for example, take a look at this 17 billion point visualization of vessel data.
What about live data?
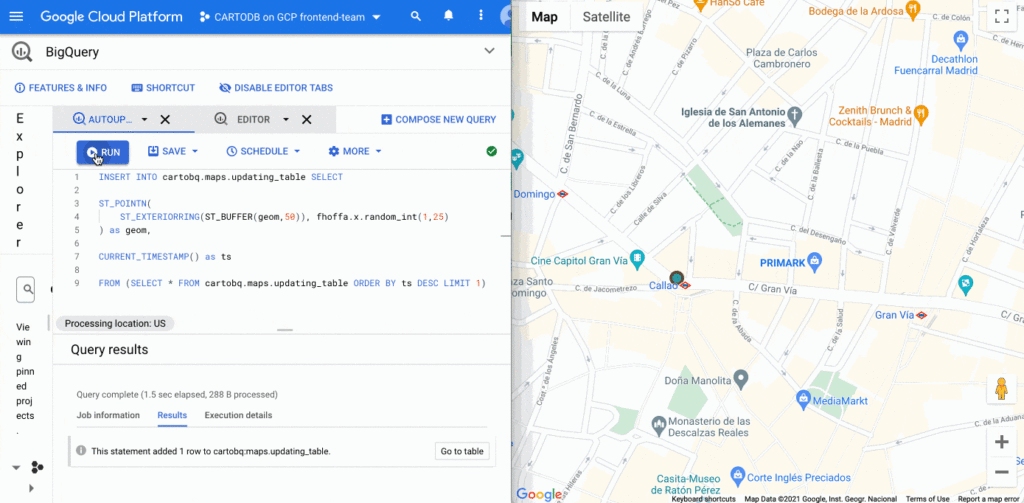
BigQuery supports streaming data that is continuously updated. In these scenarios, you want to be able to update your visualization at regular intervals, as the data changes. It’s easy to update this visualization using deck.gl. You just need to set the autoRefresh parameter to true when fetching the map and specify the function you want to execute when new data is downloaded:
const {layers} = await deck.carto.fetchMap({ cartoMapId, autoRefresh: true, onNewData: (parsedMap) => { … } });
You can add points to a table with an INSERT function on the BigQuery console and see the data updated on the map in real time.
Going further
In addition to the simple ways to create visualizations shown above, deck.gl has the flexibility to create a wide variety of visualizations. The CARTO platform provides you with the functionality to access data from your data warehouse and create these data visualizations with advanced cartographic capabilities, but you can extend it and go beyond that using any of the advanced visualizations available in the deck.gl layer catalog.
There are two additional options that give you more control over the deck.gl code. The first one is to use the CartoLayer directly without fetchMap. You’ll need to indicate the connection to use from the CARTO platform and the data source type and name or query. Then we can specify the styling properties.
const overlay = new deck.GoogleMapsOverlay({layers: [new deck.carto.CartoLayer({connection: 'bqconn',type: deck.carto.MAP_TYPES.TABLE,data: `cartobq.public_account.retail_stores`,getFillColor: [238, 77, 90],pointRadiusMinPixels: 6,}),],});
The second option is to use the fetchLayerData function that allows you to have more control over the format used for data transfer between BigQuery and your application and can be used with advanced visualizations that require an specific data format like ArcLayer, H3HexagonLayer or TripsLayer.
deck.carto.fetchLayerData({type: deck.carto.MAP_TYPES.TABLE,source: `cartobq.geo_for_good_meetup.texas_pop_h3`,connection: 'bqconn',format: deck.carto.FORMATS.JSON,credentials: {accessToken: 'eyJhbGciOiJIUzI1NiJ9.eyJhIjoiYWNfbHFlM3p3Z3UiLCJqdGkiOiI1YjI0OWE2ZCJ9.Y7zB30NJFzq5fPv8W5nkoH5lPXFWQP0uywDtqUg8y8c'}}).then(({data}) => {const layers= [new deck.H3HexagonLayer({id: 'h3-hexagon-layer',data,extruded: true,getHexagon: d => d.h3,getFillColor: [182, 0, 119, 150],getElevation: d => d.pop,elevationScale: 2.5,parameters: {blendFunc: [luma.GL.SRC_ALPHA, luma.GL.DST_ALPHA],blendEquation: luma.GL.FUNC_ADD}})];const overlay = new deck.GoogleMapsOverlay({layers});overlay.setMap(map);});
For complete code using both options, take a look at these examples.
Learn more
You can access demos and documentation on the deck.gl docs website and the CARTO Documentation Center. If you have questions, you can ping the CARTO team on the CARTO Users Slack workspace.
For more information on Google Maps Platform, visit the Google Maps Platform website.
Chrome OS Helped Ocwen Achieve Remote Workplace in Just 2 Weeks during the 2020 Pandemic

4078
Of your peers have already read this article.
1:30 Minutes
The most insightful time you'll spend today!
Editor’s note: Today’s post is by Parveen Chander Aery, CIO, and Rishi Gupta, Head of Global IT Infrastructure, of Ocwen, a provider of residential and commercial mortgage loan services. The U.S.-based company adopted Chrome OS devices to help global contact center teams work productively together.
We’re used to deployments of new technology taking a lot of time and worry. In the past, there wasn’t a fast and easy way to roll out thousands of devices, apps and operating systems to a company of several thousand people. But in March 2020, when we had to help 3500+ contact center and support employees shift safely to remote work, Chrome OS helped us get the job done in just two weeks.
That’s right—we were so impressed that it only took two weeks. We love to talk about the very short Chrome OS deployment timeline, because it happened when we needed everything to go smoothly. We believe we were the first company in our industry to be able to rapidly shift to remote work while maintaining our high levels of service, which are vital to our success.
A rapid but secure pivot to remote work
Preparing for a fully remote workforce was a bit of a scramble at first. There were so many things to consider, like making sure people had adequate internet access, and securing private customer data once everyone worked in the cloud.
Even though we had to decide on remote-work solutions in a hurry, the IT infrastructure team couldn’t compromise on security. With Chrome OS and a mix of HP Chromebooks, Citrix, and AWS, remote employees were able to work in the cloud, accessing productivity tools like Office 365, Black Knight, and regulatory APIs.
Chrome OS and Chrome Enterprise Upgrade also allowed the IT infrastructure team to manage enrolled devices in ways that improved security—for example, turning off Bluetooth access. We equipped everyone with productivity kits that included keyboards, mice, and monitors, along with noise-canceling headphones so contact center workers could block out the sounds of busy pandemic home life. We bought internet dongles in bulk to ensure everyone could get online. All of these tools helped the contact center employees easily access our contact center solution, which was developed on the WebRTC platform.
We benefited from easy integration of Chrome OS with single-sign-on tools as well as using Citrix on a much broader scale. Our timing was perfect in terms of moving the company into the cloud. Prior to the pandemic, only about 20% of applications were accessed via Citrix. Today, 100% are accessed through Citrix.
Cloud is our future
Security was crucial, but there have been many other benefits of adopting Chrome OS, such as making work easier for employees by adding links to key business tools via the Chrome homepage. In fact, the rapid shift to the cloud, dictated by remote work, has also changed our company for the better.
Our IT infrastructure team has worked successfully to ensure applications are compatible with Citrix; we’ve also trained contact center employees on using new devices and how to collaborate in the cloud. The employees were used to getting help in-person in our contact center offices—someone could just raise a hand if they needed IT help. While that’s not always possible today, we were relieved that the contact center teams became familiar with Chrome browser and Chrome OS very quickly. Chrome browser is very common with the general public, so the know-how was already there, even for people who were using Chrome OS devices and Citrix for the first time.
A year and a half after remote work began, we see that Chrome OS devices weren’t simply stopgaps for the pandemic era. They’ve become workplace tools with value far beyond the pandemic. Thanks to the ease of our contact center’s transition to Chrome OS, Ocwen has decided that we’ll remain in a hybrid work model for the foreseeable future, instead of returning 100 percent back to the office. Chrome OS makes this model easy for us because we don’t need to change the data or configuration on a device as people shift from remote to office work.
5095
Of your peers have already watched this video.
1:30 Minutes
The most insightful time you'll spend today!
Ramco Cements: Enhancing Intelligence with Data Visualization
Ramco Cements chose Google Maps to integrate with its Ramco ERP system. By layering its data onto Google Maps, the result was a rich data visualization tool that facilitated idea generation and improved productivity. Over 1,000 employees across India access reports and transactions on a daily basis from the Ramco ERP system and integrated Google Maps.
Management at Ramco Cements uses Google Maps for visual analysis – for monitoring benchmarks, identifying discrepancies and deviation. Google Maps serves as a tool to help them develop appropriate strategies for business growth.
Also, the field sales team now has the capability to easily view information on their mobile devices – information ranging from competitor distribution networks in their area, to the best and worst performing dealers.
4418
Of your peers have already watched this video.
30:00 Minutes
The most insightful time you'll spend today!
How to Cut the Sales Cycle Short and Close a Deal Quickly
Did you know sales reps only spend about one-third of their time actually selling? Believe it.
The remaining two-thirds are spent on two things: Creating presentations, pushing boxes around on a slide deck, and doing administrative work like setting up meetings with clients. That’s all the time you could have spent prospecting new clients.
Avoiding time-drains is what makes a huge difference to your job-role and your business. There are six stages in a sales cycle: Prospecting clients, initial contact, identifying needs, presenting offer, negotiation, and closing deal.
Each stage demands attention but there’s a way to save time and move quickly to the next stage. For example, you shouldn’t have to switch between your CRM and e-mail if they were integrated. You shouldn’t have to start a presentation deck from scratch if you had pre-built templates to follow.
With G Suite, your organization can make a custom workflow that can incorporate data from several sources both in G Suite and outside. You can create pitch presentations overnight, and shorten the sales cycle. You can include data from spreadsheets onto Slides, which gets automatically updated in Slides, if the data is corrected or changed in the spreadsheet.
Find out how sales heads are leveraging G Suite to close more deals quickly in this video.
More Relevant Stories for Your Company

How Did DTDC Express Speed Up Decision-making and Collaboration by 10x—While Cutting Costs?
Among Indian courier and logistics businesses, DTDC has expanded rapidly since its foundation in 1990. Starting with seed capital of less than US$2,000, DTDC has grown to a US$175 million business with operations across the country and internationally. The business is second only to the government-owned India Post in the

Lucent Bio: Boosting collaboration and sustainability with Google Workspace
From electrifying transportation to shifting the grid to renewable energy, environmental sustainability is one of the greatest challenges of our generation. A critical but often forgotten goal is the development of sustainable agricultural practices, especially given increasing water shortages and soil degradation around the world. Lucent Bio was born to

Streamlining Your Experience: Enhanced Search and Navigation in Google Cloud Console
The Google Cloud console is a powerful platform that lets users manage their cloud projects end-to-end with an intuitive web-based UI. With over 120 Google Cloud products across thousands of pages, it can be challenging to navigate through the console quickly, and many users don’t like to use the command

Discovery’s Massive Workspace Migration Fuels Innovation and Collaboration
In the past two decades, Discovery has moved from a purely cable business based in the U.S. to a global media and entertainment powerhouse. Like many other businesses in the industry, we’ve had to adjust to the unique shifts in people’s behaviors and preferences, almost all of which result from
