






Microservices Done Right: How Indian Businesses Can Build a Highly Scalable Business
READ FULL INTRODOWNLOAD AGAIN4316
Of your peers have already downloaded this article
4:30 Minutes
The most insightful time you'll spend today!
Google Maps’ Cloud-based Styling Features Betters UX, Control and Flexibility

3357
Of your peers have already read this article.
2:00 Minutes
The most insightful time you'll spend today!
This year at Google I/O, we announced the general availability of Cloud-based maps styling for the Maps JavaScript API. In an effort to provide you with more options and more control to help create the best experience for your users, today we’re releasing new features to Cloud-based maps styling. You may already be familiar with these features from the consumer Google Maps web and mobile apps—Landmarks and Building Footprints. We’re also releasing updates to our industry optimized map styles to provide even more map details while providing the flexibility to craft the best experience for your users. Let’s take a look.
Help users quickly scan and orient themselves with Landmarks
You may have noticed some enhancements for prominent places in the consumer Google Maps web and mobile apps, these landmarks help show your users points of interest that help them orient and navigate cities they are exploring or visiting.

You now have the ability to bring this same experience to your users by creating maps using Cloud-based maps styling. This feature is available in 100 cities globally including New York, Dubai, Paris, Mumbai, and Singapore. To enable landmarks for your map, log into the Cloud console and in our style editor navigate to the Points of interest feature type and select ‘Illustrated’ under Marker Style.
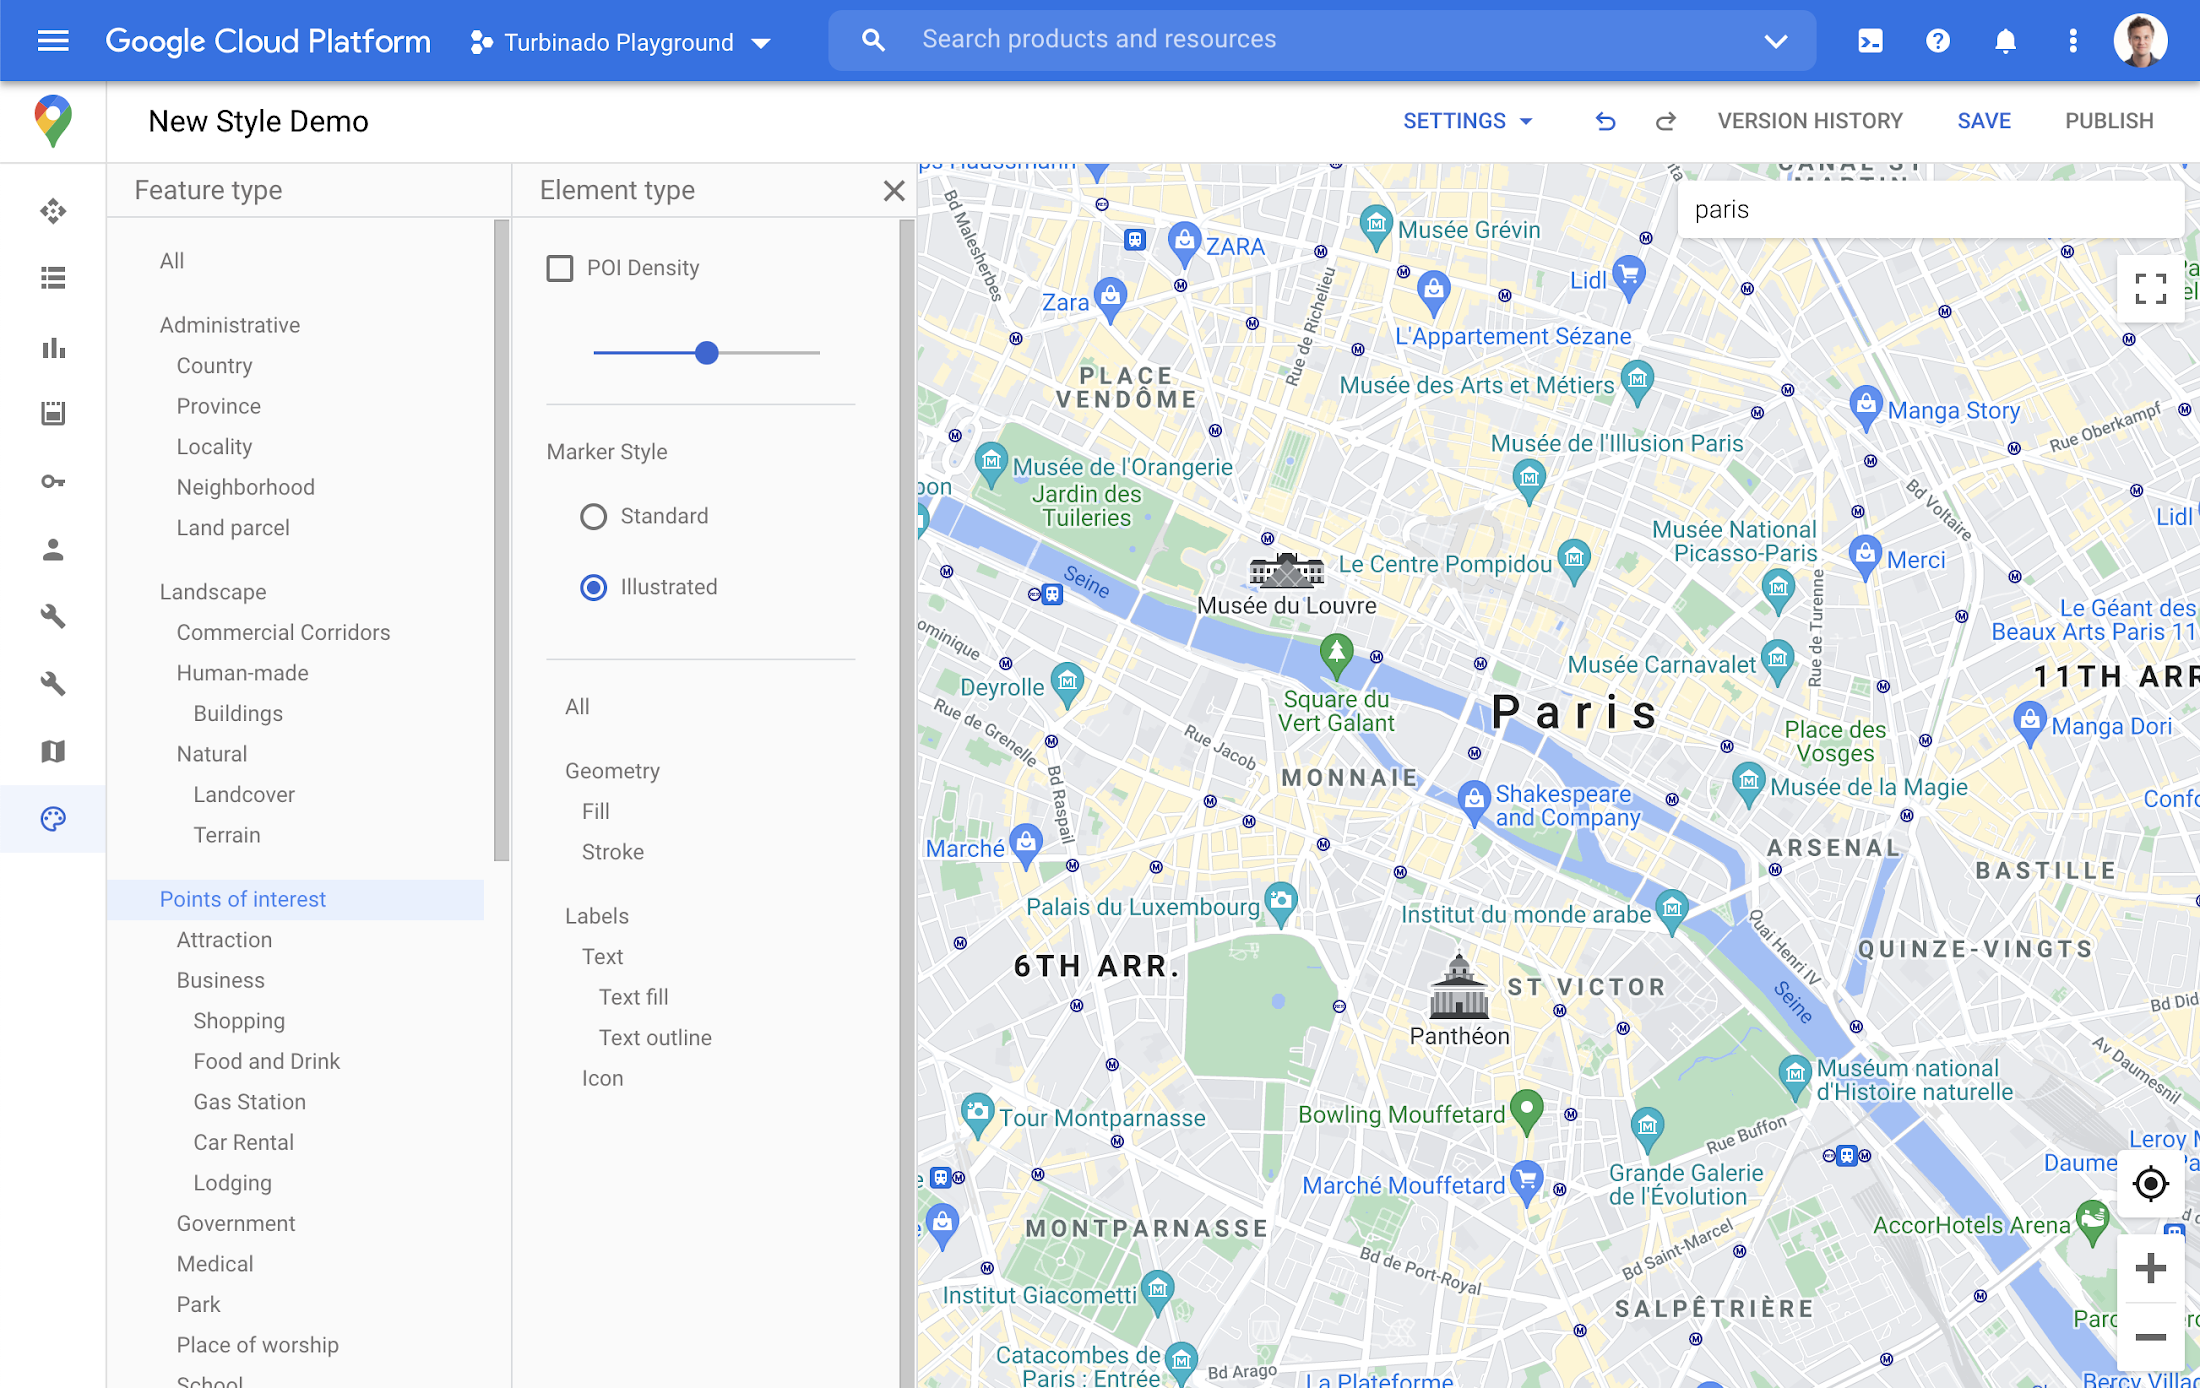
Simplify maps features by switching to Building Footprints
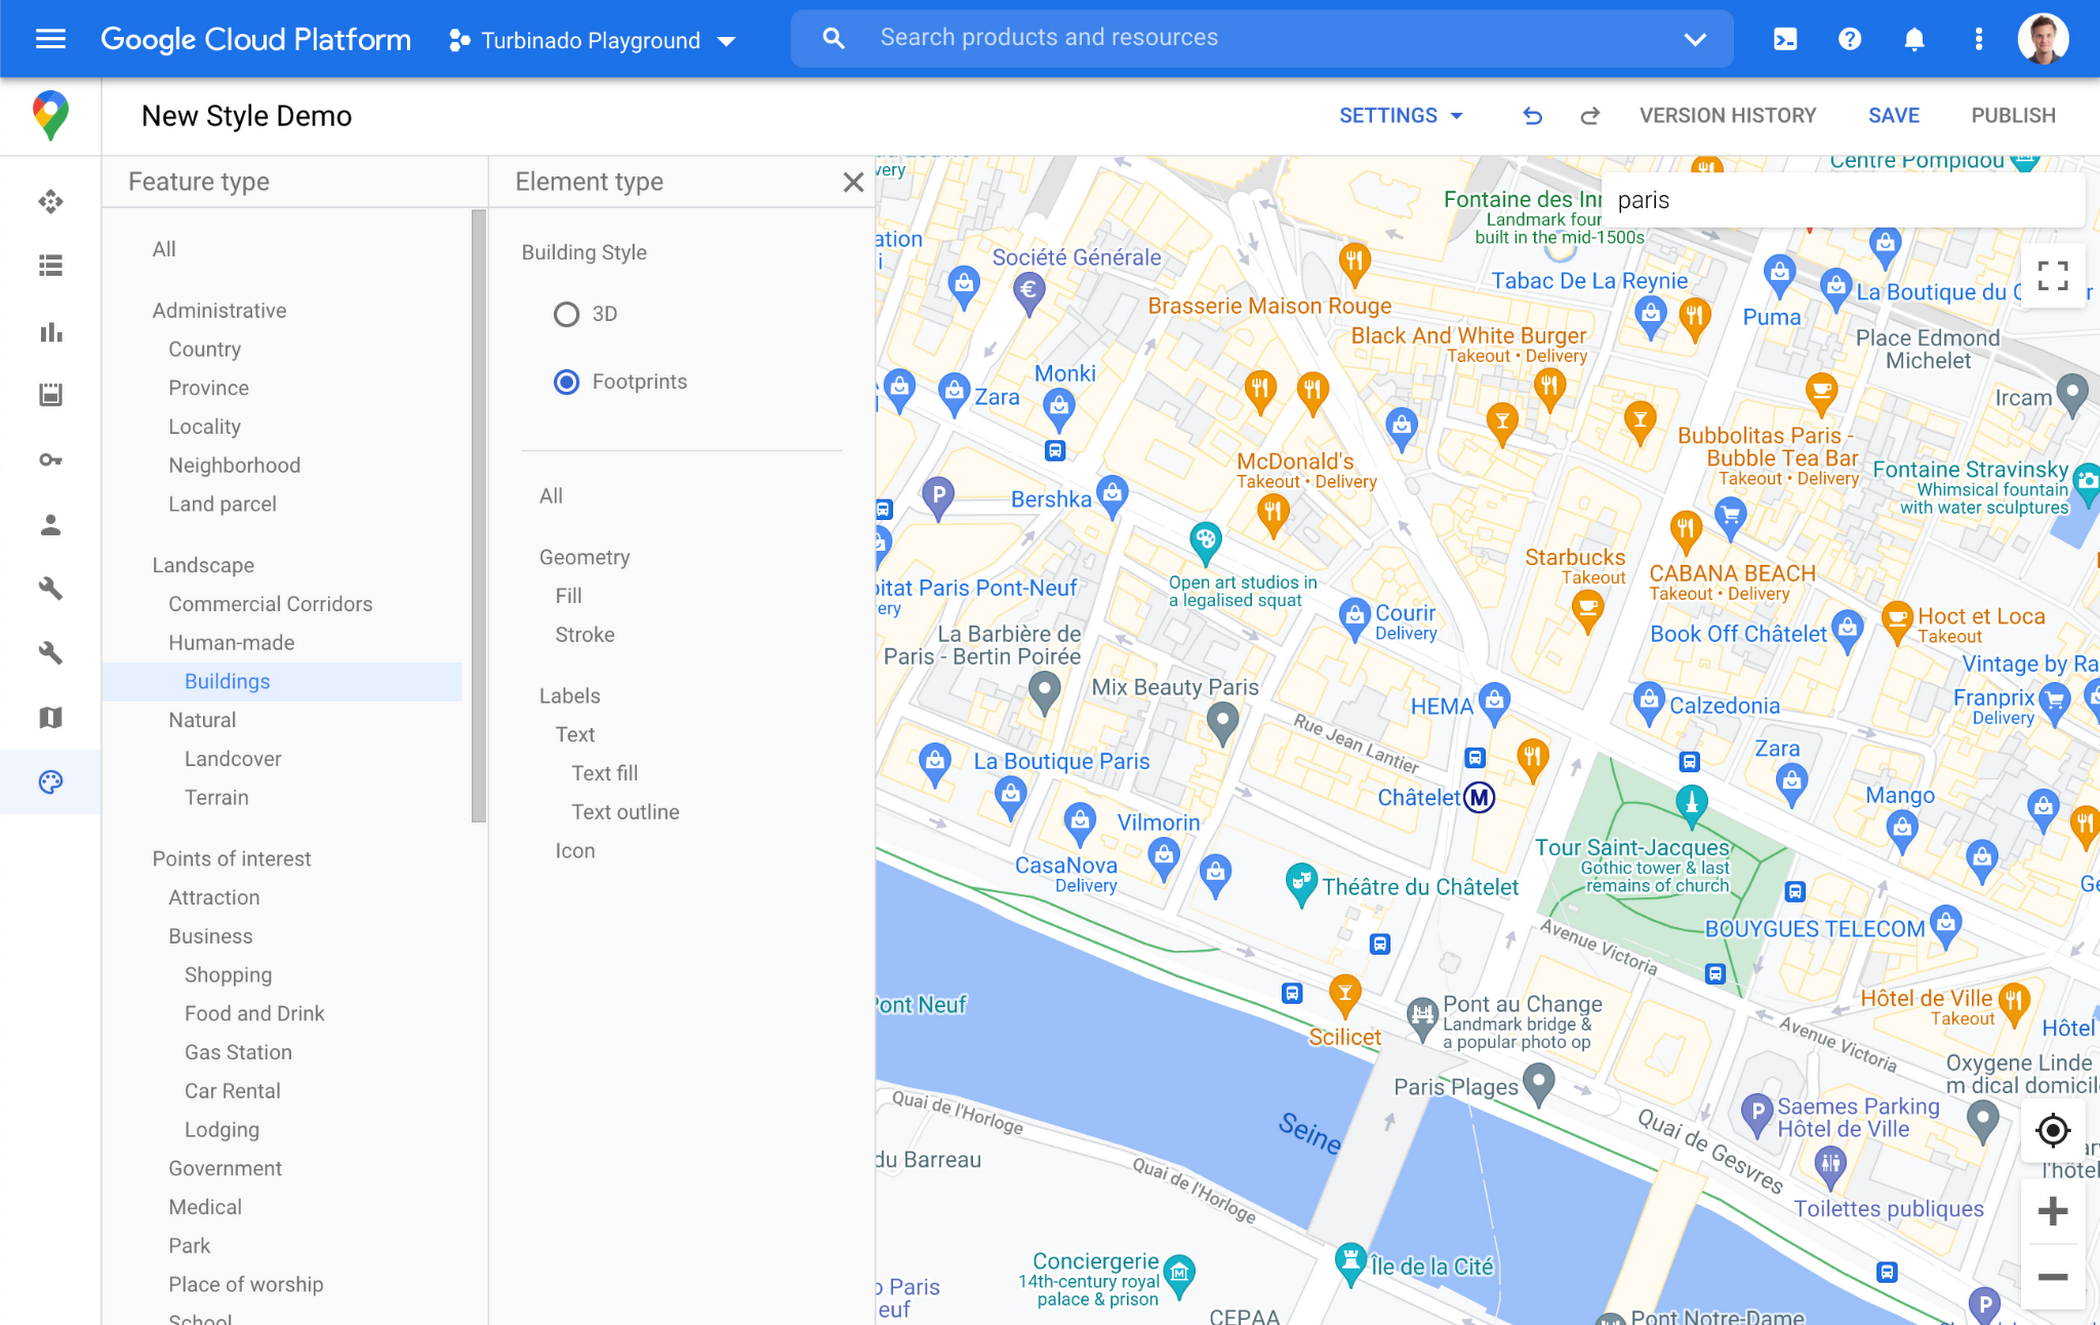
Sometimes less is more. In dense, highly vertical cities, showing 3D building heights can add cognitive load for users. Now, in addition to 3D buildings, we offer building footprints as an option in the style editor. Building footprints can provide a strikingly different basemap balance and composition to better support use cases that may not benefit from the added complexity that 3D buildings can present.

Fill and stroke geometries can also be styled independently to support various color themes. To enable Building Footprints, log into the Cloud console and in our style editor navigate to Buildings and choose ‘Footprints’ under building style.
Industry Optimized Map Styles now include Landmarks and Building Footprints, plus Detailed Street Maps
In January of this year we launched Industry Optimized Map Styles for the travel, real estate, retail, and logistics industries, providing customers with pre-styled map configurations, available via Cloud-based maps styling. Landmarks are now included in all of our Industry Optimized Map Styles and we have turned on Building Footprints in the travel style map. If you are already an Industry Optimized Map Styles user, these new features will be applied to your map with no action needed from you. If you would like to disable these changes, you can use the style editor to turn off these features.
For Industry Optimized Map Styles only, we are also excited to enable Detailed Street Maps. You may have seen these features in our consumer products at Google I/O, released back in August of 2020 for the consumer Google Maps web and mobile apps. Detailed Street Maps are available in San Francisco, New York, London, and Tokyo, and we are targeting expansion to 50 new cities by the end of 2021.
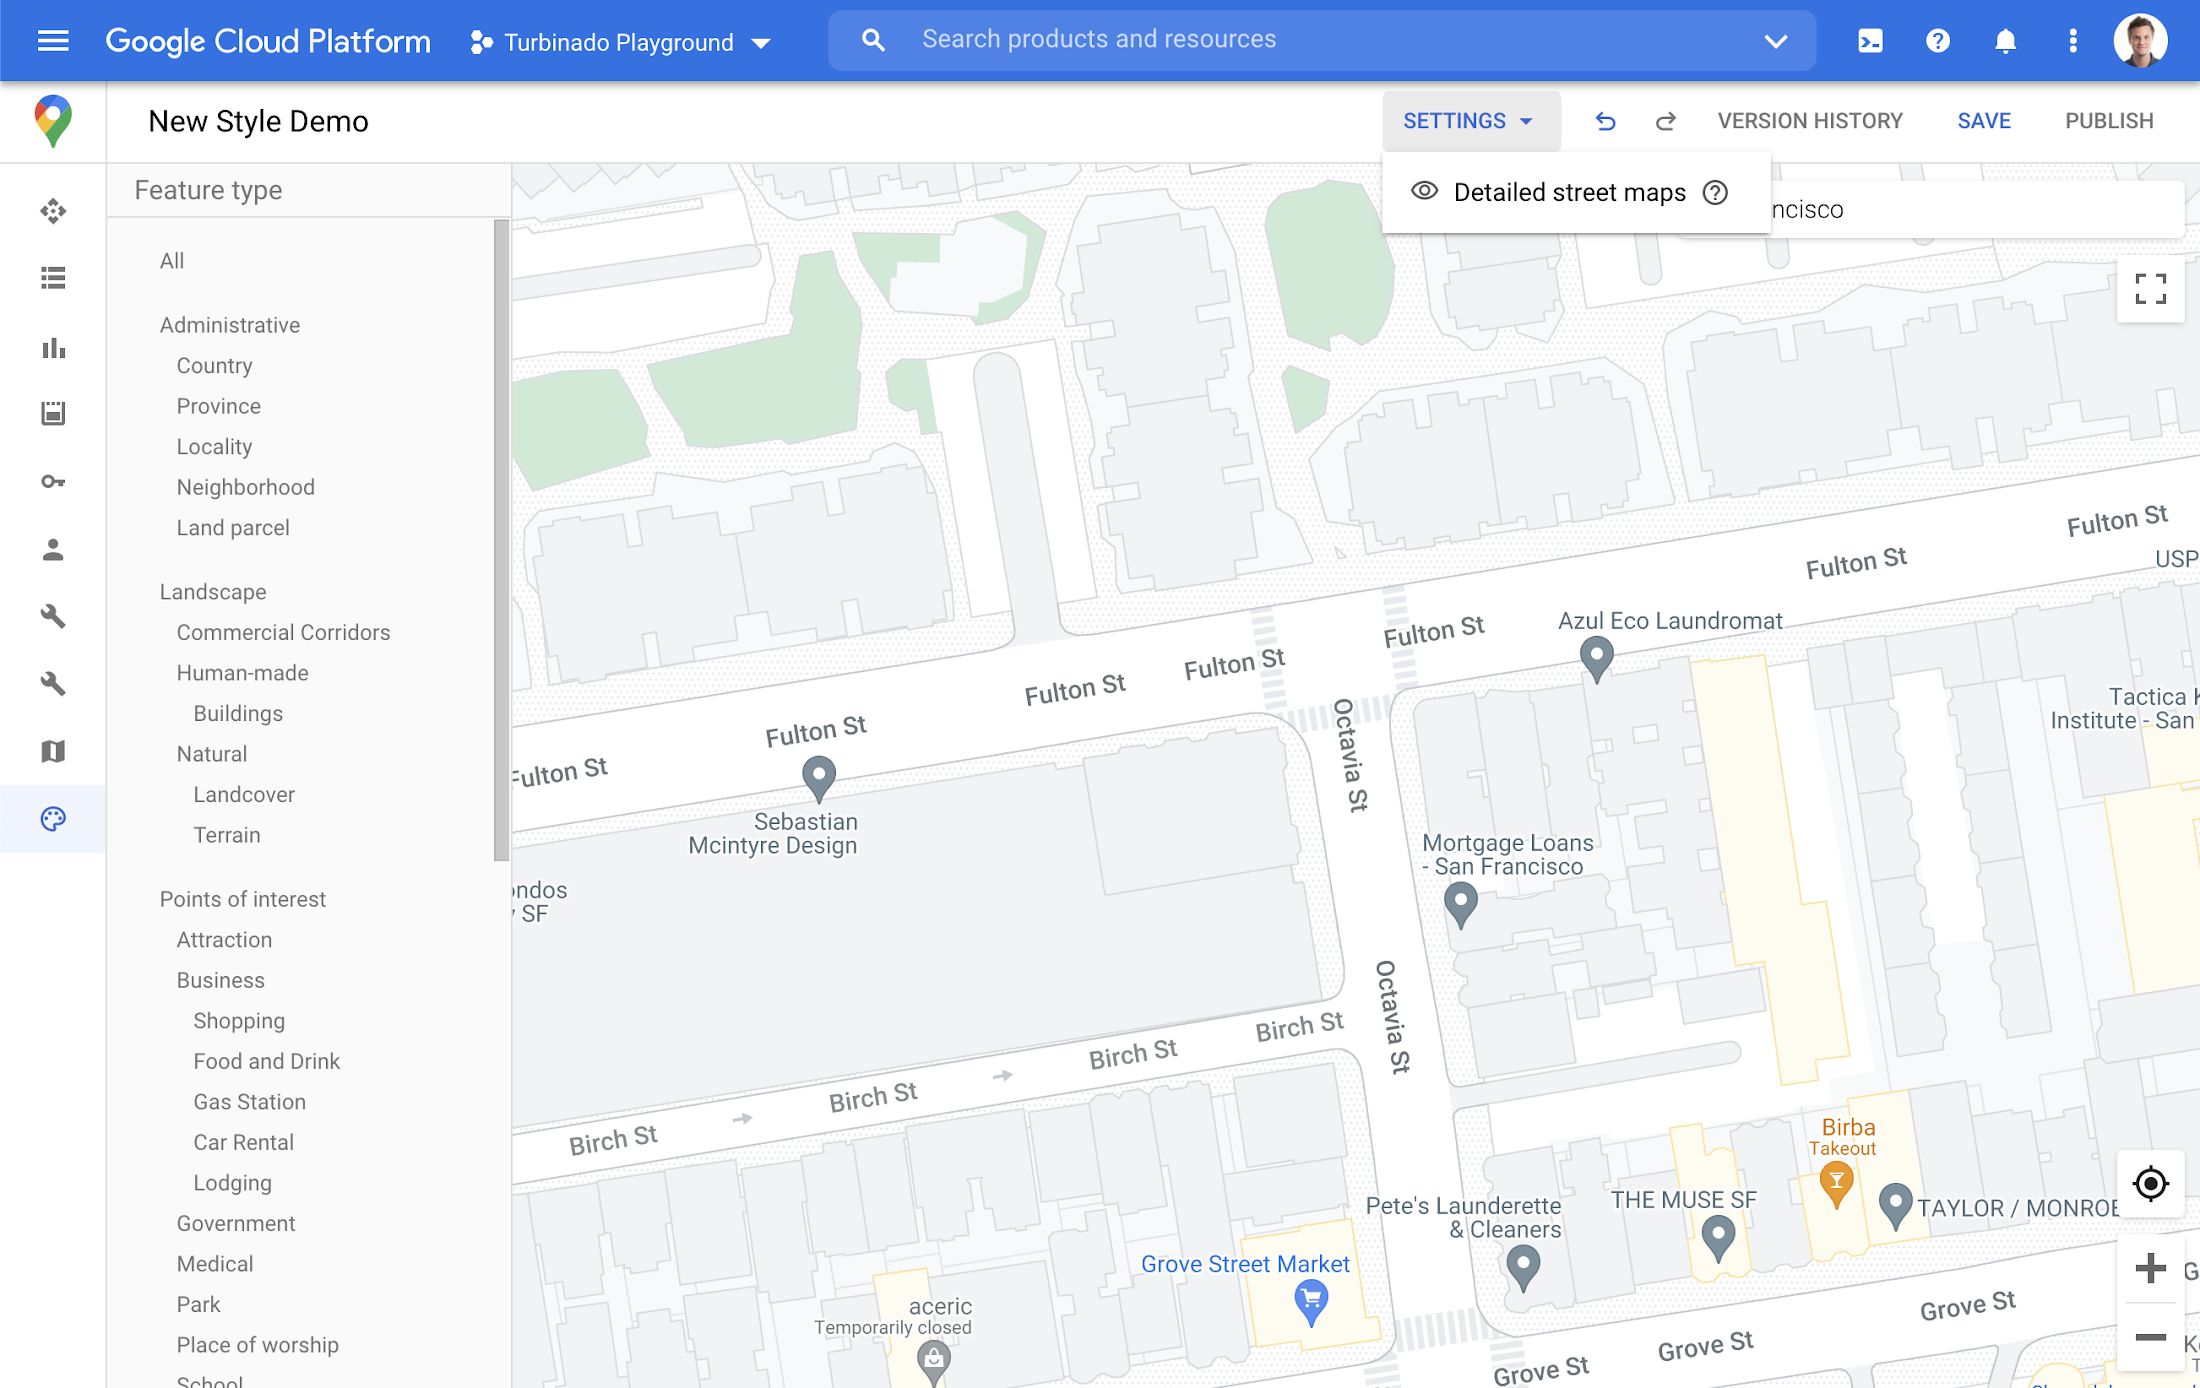
Detailed Street Maps are on by default for all Industry Optimized Map Styles and we created a new settings menu to change the visibility, as needed. We are working on bringing the full styling capability for Detailed Street Maps features to all Cloud-based maps styles in the future.
Landmarks and Building Footprints as well as the updates to Industry Optimized Map Styles are only available via Cloud-based map styling in the Google Cloud Console and are included in Google Maps Platform pricing. Learn more about how to use Landmarks and Building Footprints and Industry Optimized Map Styles. To get started with Cloud-based map styling, check out our documentation for JavaScript.
For more information on Google Maps Platform, visit our website.
GKE Feature Guide: 5 Ways to Optimize Your Kubernetes Clusters

1568
Of your peers have already read this article.
7:00 Minutes
The most insightful time you'll spend today!
In this post, we’ll be discussing 5 features in GKE you can use to optimize your clusters today. To get started with testing these in GKE, check out our interactive tutorials for getting started with standard and autopilot clusters.
If you find value from running workloads on Kubernetes clusters in your organization, chances are your footprint will grow – be it through larger clusters or more clusters.
Whichever your approach, one thing is certain: you’ll have more resources that you pay for. And you know what they say – more resources, more problems. The more resources you have across clusters, the more critical it becomes to make sure you’re using them efficiently.
Google Kubernetes Engine has numerous features built-in that you as a cluster admin can use to navigate this continuous journey of optimizing your use of resources in GKE.
Let’s review five of them you can get started with today.
#1 – Cluster view cost optimization in the console
If you don’t know where to start with optimizing your clusters, the best place to start is looking for a big problem that stands out. That’s probably most visible by looking at a view that spans all of your clusters.
In GKE, we have a cluster-level cost optimization tab built into the console, rich with information that may be cumbersome to gather on your own otherwise.
You can find this as seen in the following image:
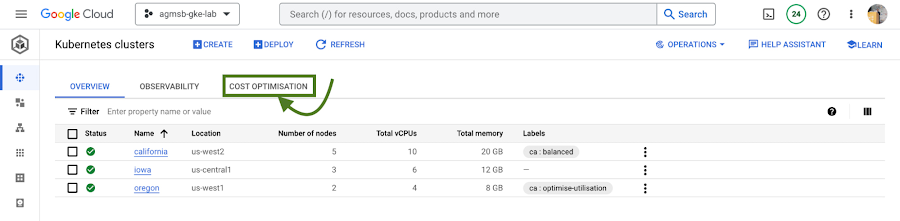
Fig. 1 – Navigating to the cost optimization tab in the cloud console
Once you navigate to this tab, you’re greeted with a time series visualization.
For GKE standard clusters, this visualization is a time series representation that shows three key dimensions for CPU and Memory across all of your clusters in a project:
Total CPU/Memory allocatable– # of CPU or GB of memory that can be allocated to user workloadsTotal CPU/Memory request– # of CPU or GB of memory that has been requested by user workloadsTotal CPU/Memory usage– actual usage by # of CPU or GB of memory by user workloads
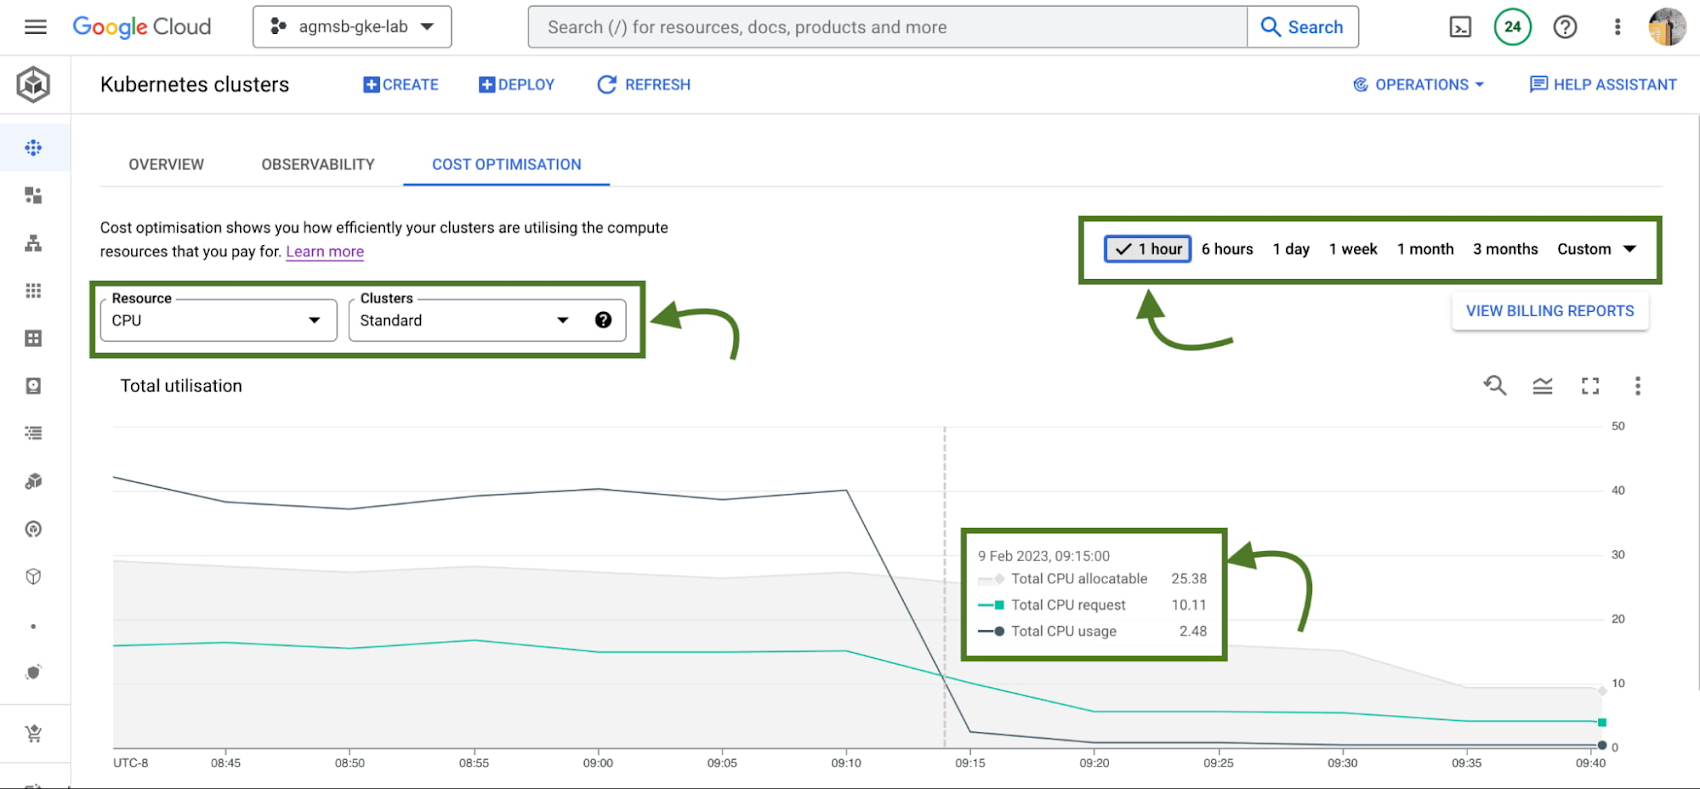
Fig. 2 – Allocatable, requested, and usage time series data across CPU or memory in all standard GKE clusters over a specified window
Analyzing these in relationship to one another can help identify answers to important optimization questions such as:
- Do we have too much allocatable CPU and memory idle across our GKE standard clusters? If so, can we do things like re-evaluate the machine types we use in node pools? This can help us bin pack the cluster, by having a higher percentage of allocatable resources allocated to Pod requests.
- Are workloads running in our GKE standard clusters requesting too much CPU and memory that goes unused? If so, can we do things like work with workload owners to adjust requests? This can help us workload right-size, by setting requests to more closely reflect expected usage.
If we’re using GKE Autopilot, this time series visualization will look slightly different, as seen in the following image:
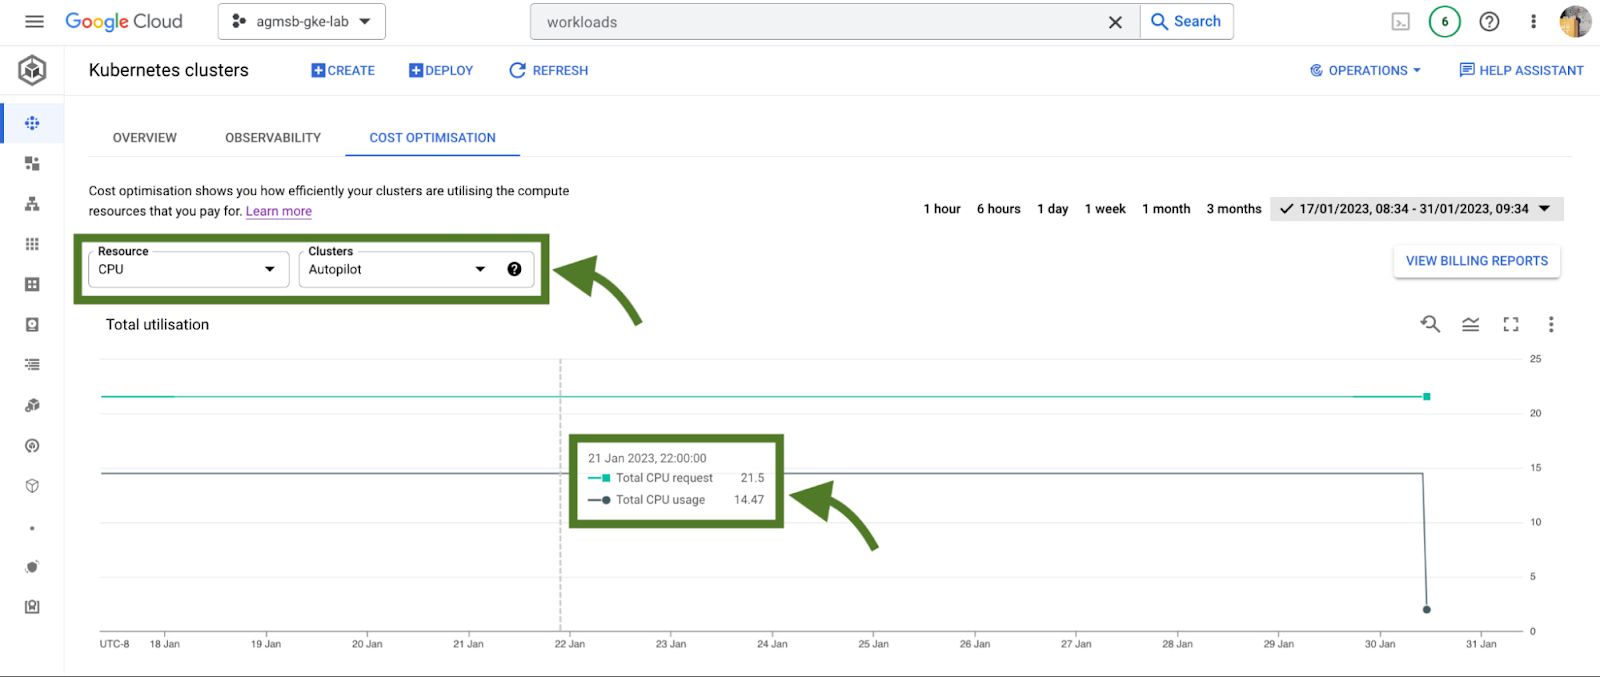
Fig. 3 – Requested and usage time series data across CPU or memory in all GKE Autopilot clusters
In the case of GKE Autopilot clusters, we’re only able to view the Total CPU/Memory request and the Total CPU/Memory usage data. But nothing here is actually missing!
In Autopilot clusters, you only pay per Pod based on its requests; Autopilot automatically handles provisioning the infrastructure that gives us our allocatable resources based on whatever you set Pod requests to. When we trade in that ownership of node provisioning, we also trade in the control to optimize at that layer.
For a cluster administrator, this information can be a spark to spur actions such as diving into individual clusters or meeting with workload teams to work through their requests and limits that they set for workloads. In our research, this is perhaps the most impactful area many teams optimize. We’ll dive into how GKE can enable this exercise a bit further in this blog.
When going down those paths, it helps to have financial data to quantify the impact of the optimization to the business. Gathering this info on your own can require a bit of work (for some, a lot of spreadsheets as well!), but luckily GKE has another native feature to help make this easily accessible to you.
#2 – GKE cost allocation
GKE cost allocation is a native GKE feature that integrates workload usage with Cloud Billing and its reports, allowing you to see and alert on billing not only on a per-cluster level, but on a per-Kubernetes namespace or per-Kubernetes label level.
It must be enabled on your cluster in order for it to function, so if you’re working with an existing GKE cluster and want to enable it, use the following gcloud command once you have set your appropriate zone or region:
$ gcloud beta container clusters create $CLUSTER_NAME \
    --enable-cost-allocation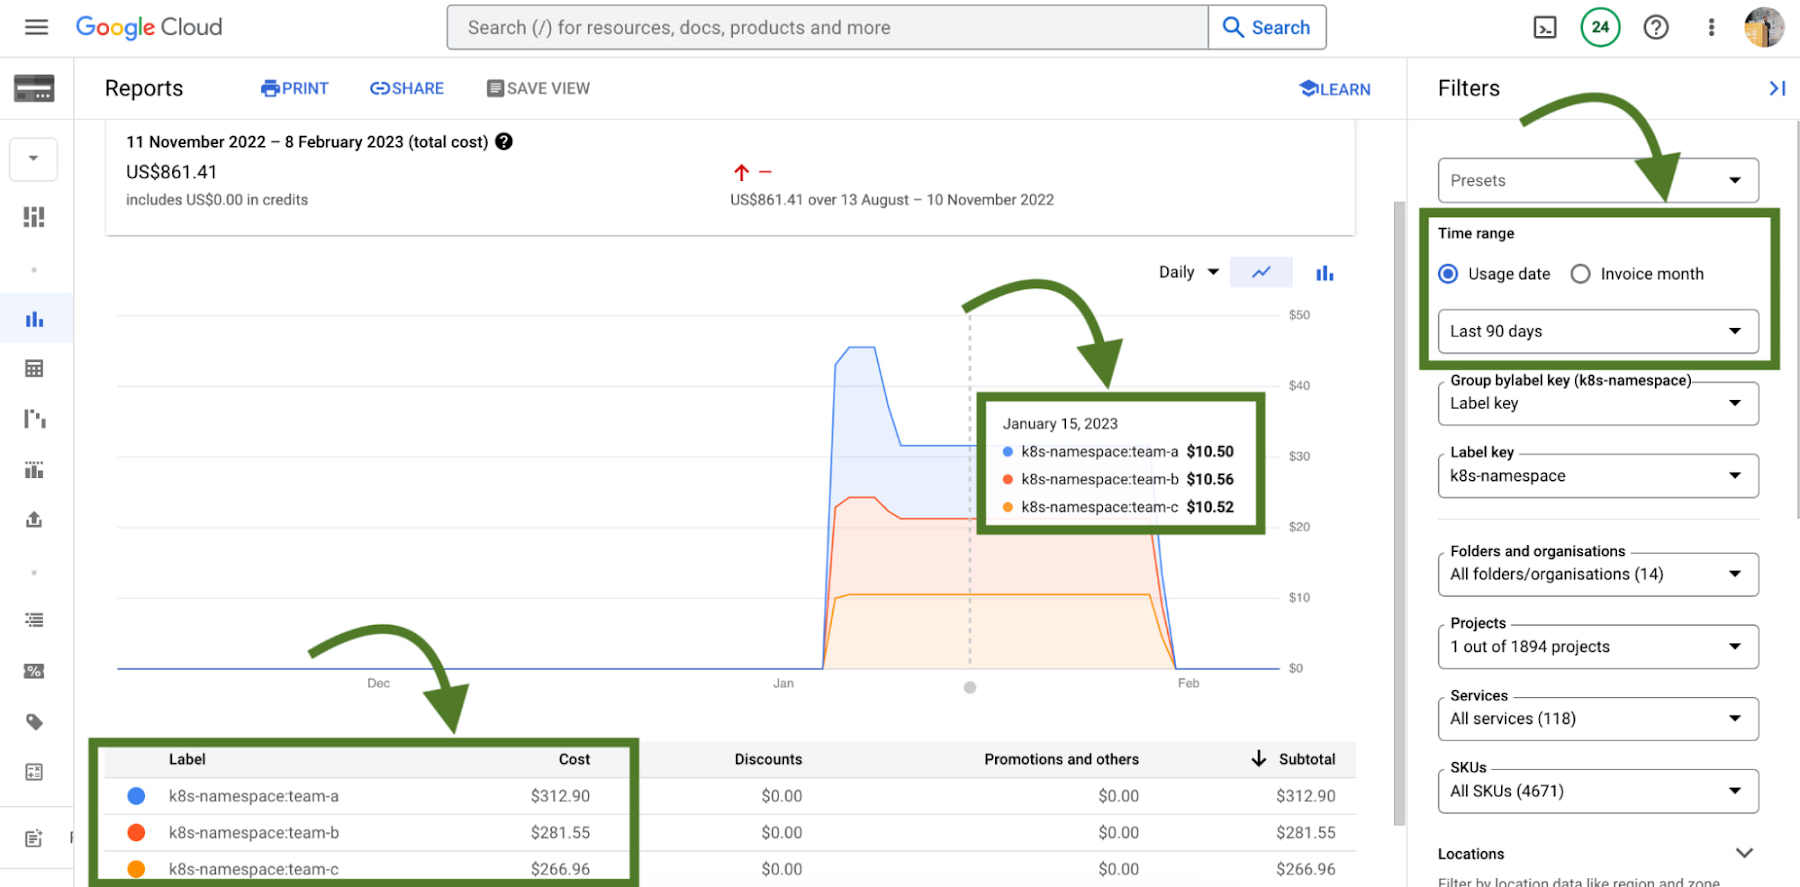
Without GKE cost allocation, the financial impact of a cluster and all of the different workloads it might run were a bit obfuscated. With the cluster as the deepest level of detail in billing, finding areas to optimize or even performing showback and chargeback was a challenge.
With Namespaces and Labels bubbling up into billing reports, you can now understand the cost of the CPU/Memory requests that workloads define in Kubernetes. A caveat – this works best when you are using Namespaces and Labels to logically define and organize teams and their workloads.
This integration also gives the bigger picture of optimization – in that GKE does not typically live on an island! In theory, workloads in a team’s namespace could be using external backing services like Cloud Memorystore that are also a key part of its usage.
Because Cloud Billing data has all GCP services, we can now filter and query across namespaces and their corresponding backing services.
# 3 – Workload view cost optimization in the console
Once you have teams identified that you may want to work with, GKE provides a cost optimization tab at the workload level, where you can then begin to drill down and identify specific workloads that could be optimized through an exercise called “workload right-sizing”. This is the act of making sure that Pod requests more closely reflect their expected usage.
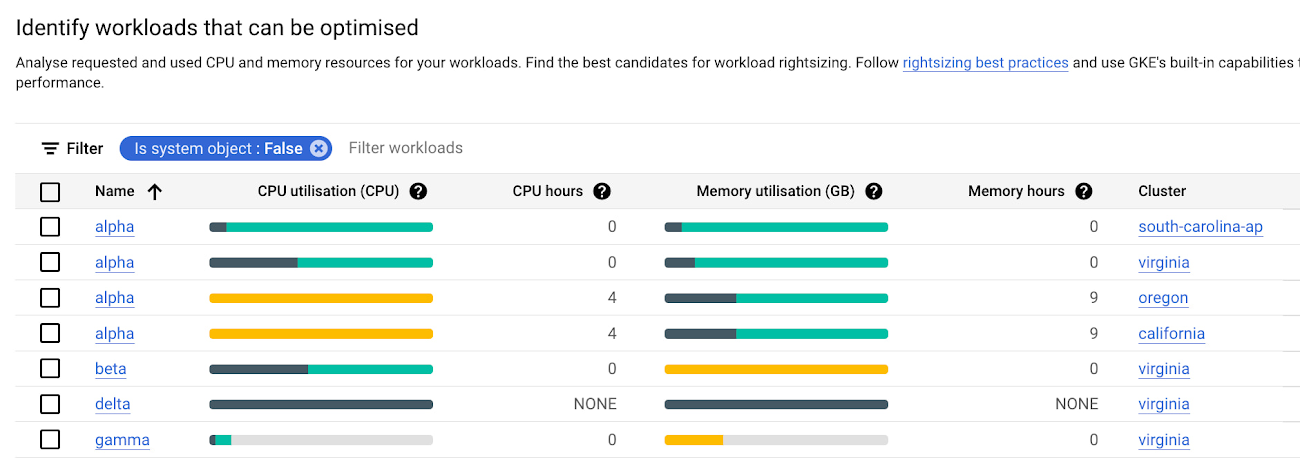
As you can see here, we’re given bar charts to represent the relationship of usage, requests, and limits to one another.
- Dark green: CPU/Memory usage
- Light green: CPU/Memory requests
- Grey: CPU/Memory Limits
- Yellow: Scenarios in which CPU/Memory usage exceeds requests
You can also hover over each individual workload bar chart to reveal a small on-screen report of this data. Similar to the cluster view cost optimization tab, you can filter down to a custom time window; we recommend viewing this data in a window greater than an hour (IE a day, week, month) to potentially uncover diurnal or weekly patterns that would otherwise be obfuscated.
In the preceding screenshot of these charts, we can call out a few patterns that might stand out to you:
- If we have too much light green stacked above dark green in a bar, we may have workloads that are over provisioned.
- If we have a yellow bar, we have a workload where requests are not set high enough, which can be a stability/reliability risk – consuming additional resources on its node and potentially being throttled or OOMKilled if it hits its limits.
- If we have a bar that is all dark green, this means that we don’t have requests set for a workload – which is not best practice! Set those requests.
With this information, it becomes easier to quickly identify workloads that need requests and limits tuned for either cost optimization or stability and reliability.
# 4 – Recommendations for adjusting workload requests
In scenarios where we need to increase or reduce CPU/Memory requests, it is easier to know that it needs to be done than to know how it needs to be done. What should we set the requests to?
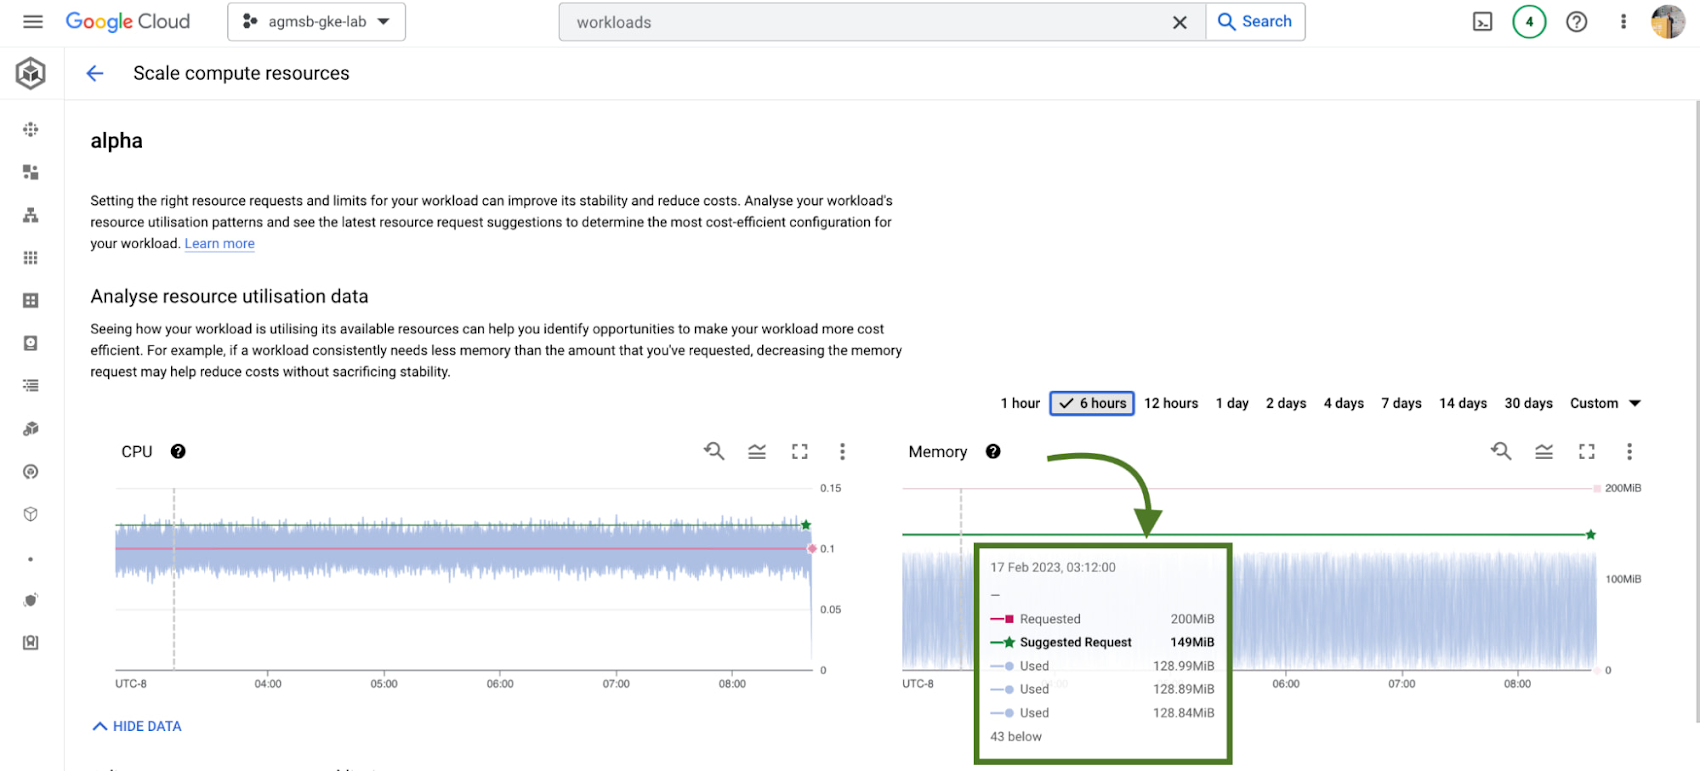
GKE integrates recommendations from the Kubernetes Vertical Pod Autoscaler (VPA) directly into its workload console, currently for all deployments in your clusters. You can find this by navigating to the Actions > Scale > Scale compute resources menu when viewing the page for a specific workload.
It’s important to remember that these recommendations are just that – recommendations. They’re based on historical usage data, so when viewing these values, it’s important to work with workload owners to see if these suggestions make sense to incorporate into their respective Kubernetes manifests.
# 5 – Cost estimation and cluster creation setup guides
Finally, if you’re just getting started with GKE and you want to get started on the right, optimized foot, we have tooling incorporated into the GKE cluster creation page.
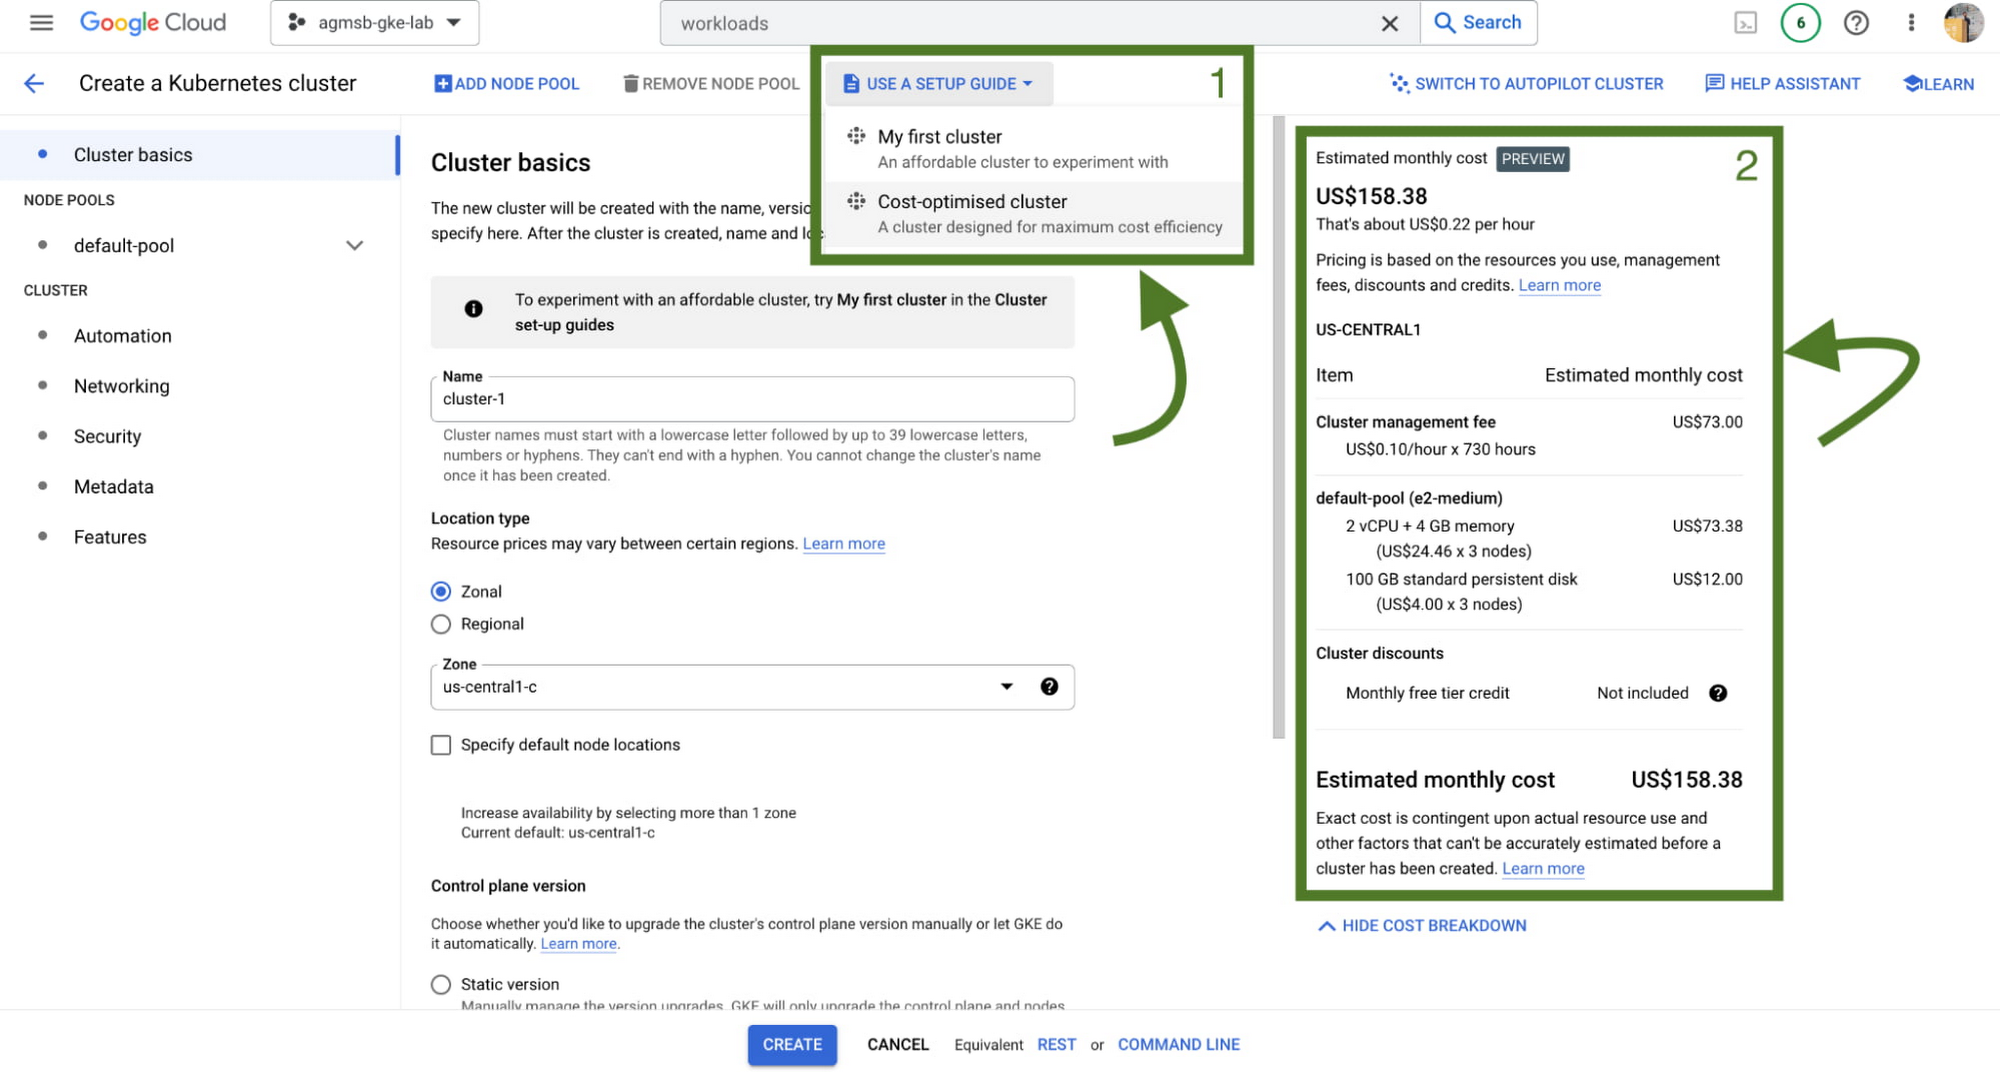
First, we have a setup guide that will help you create an opinionated GKE standard cluster with some things we discussed here already enabled, such as GKE cost allocation and Vertical Pod Autoscaler.
Second, we also have a cost estimation panel that, depending on the configuration of your GKE standard cluster, will show you an estimated monthly cost. This even helps you get a range of potential costs if you expect your cluster to scale up and down!
Now what?
Optimization across a set of GKE clusters can include a handful of areas to think about – and isn’t a one time task! Instead, it’s a continuous journey that cluster administrators, workload owners, and even billing managers all take part in. GKE provides the tooling to make this journey and process easier, with the right data and insights at your fingertips.
To familiarize yourself with these features in GKE, check out our interactive tutorials for getting started with standard and autopilot clusters.
You can also watch a demo showing most of these features in the following video:
A special thanks to Laurie White, Fernando Rubbo, and Bobby Allen for their review on this blog post.
AgroStar: Small farms in India getting big help from the cloud

13212
Of your peers have already read this article.
3:30 Minutes
The most insightful time you'll spend today!
AgroStar has launched a cloud-based mobile app that is helping to boost crop yields and encourage best practices for small farmers in India. Launched as an on-premises ecommerce platform selling farm tools in 2008, the firm turned to Google Cloud Platform (GCP) to expand its offering. It now uses cloud-based analytics and is deploying ML models to provide timely advice in five languages on everything from seed optimization, crop rotation, and soil nutrition to pest control.
A 2018 survey underscored the demand for agricultural planning for Indian farmers. While farming remains a dominant sector in India, employing half of its labor force, 70 percent of small farmers – those cultivating fewer than three acres – said their crops are damaged by unforeseen weather and pests. An even higher number – 74 percent – say they lack access to farming-related information.
Widening that gap is the relative lack of access to new, higher yield seeds and improved soil analyses for small farmers, who must otherwise rely on traditional methods. “It could take a few years for innovative information to trickle down from universities to small, grassroots farmers,” says Pritesh Gudge, AgroStar Software Engineer. “Today, just by clicking through our Android application, farmers learn about new, effective farming practices and receive advice customized to their crop and soil.”
Connecting a million farmers in the cloud
Operating in the Indian states of Gujarat, Maharashtra, Rajasthan, Orissa, Bihar, and Karnataka, AgroStar is closing the knowledge gap with a full-service, cloud-based SaaS solution – the only one of its kind in India. It combines agronomy, data science, and analytics to help farmers by providing a variety of resources.
AgroStar has reached over a million farmers through its Android app, the AgroStar Agri-Doctor. The mobile client is available as a web-based or full-featured native app. Both provide access to the firm’s knowledge base hosted on GCP, a Q&A forum that connects farmers to each other to help understand and better solve problems and to learn about innovative practices and products. Farmers can also click through to follow local and national market trends that help forecast crop prices.
In addition to the self-service knowledge base, AgroStar provides access to agronomy experts who use cloud-based analytics tools and historical data to provide season-and locale-specific advice to each farmer. “We are now tracking thousands of calls in 5 languages each day,” says Pritesh.
The AgroStar app also provides links to purchase and then track the delivery of farm tools and supplies such as cultivators and fertilizers. An in-house platform manages fulfillment centers and a doorstep delivery network simplifies the supply chain while giving farmers what they need, when they need it. By procuring directly from the manufacturers and primary distributors of farm supplies, Agrostar is achieving cost savings, which it passes on to farmers.
Build fast, pivot faster
From the start, the human and environmental variables of farming in India, not to mention the volume of AgroStar’s few hundred thousand monthly active users, made a highly scalable cloud-based solution inevitable. Farmers rely on the firm’s Agri-Doctor app to provide advice in multiple languages on topics that range widely throughout three growing seasons, each with distinct crop nutrition and rotation cycles and farm implementation requirements.
“For farmers, the focus keeps changing every month, and every season,” says Pritesh. “To serve our growing community, we needed a platform that could process images at high volume, fulfill tools and seed orders across thousands of miles, and respond to multilingual queries. We quickly moved away from spreadsheets and server-based solutions – we needed to build fast and pivot faster.”
Ending late-night deployments
The firm’s first cloud experience was with an AWS solution. At the time, AWS was the only cloud provider in India, but AgroStar wanted to find a solution that was easier to use and offered better integration with Android devices. “Deployment and processing costs were very high, and the developer tools and documentation were not as intuitive as we needed,” says Pritesh.
When GCP service arrived in India in October 2017, AgroStar embarked on a platform re-implementation that made possible dramatic changes in the way it developed and deployed its solution. Using Google Kubernetes Engine (GKE) for crop advice management and Compute Engine for its production application services, the firm built the backend for the Agri-Doctor discussion forum in only three weeks. The platform’s microservice architecture is implemented in Python and Golang and deployed on GCP.
AgroStar began to realize significant efficiencies in its build, deploy, and test cycles. “We previously needed to work overnight to deploy to production,” says Pritesh. “Now using Google for Kubernetes containers and a rolling update strategy, we can deploy during the day without any problems or interruptions to service.”
The move to GCP streamlined AgroStar’s stack. “We were running 12 independent instances on AWS,” says Pritesh. “With Google Kubernetes Engine, we are deployed on a single cluster at a cost savings of $1,300 per month and growing.”
Improving customer response times by 85 percent
With a managed deployment capability, AgroStar can devote more time and resources to executing on its platform and Agri-Doctor app development plan. A strategic goal was managing customer response times as the firm grew its base. GCP has helped the firm meet that goal, achieving an 85 percent improvement in customer response times even as traffic grew significantly.
“With our on-premises solution, we could handle around 100 customers daily, which took 30 to 50 minutes for each customer,” says Pritesh. “We now handle thousands of customers daily, taking only 4 to 5 minutes for each one.”
AgroStar used Firebase to implement its Agri-Doctor app. A real-time cloud database, Firebase provides an API that enables the Agri-Doctor advice forum to be synchronized across all its far-flung mobile clients, effectively sharing knowledge base updates with one million users in near real time.
Using cloud tools to manage and monitor
Cloud Pub/Sub, Kafka, and Cloud Dataflow manage data ingestion and queueing of event and transaction data to the analytics layer. BigQuery fetches and persists data to Cloud Storage. Cloud SQL and dashboards powered by Tableau deliver farmer crop and soil profiles within minutes.
Cloud IAM helps AgroStar control access to all its cloud resources. And Stackdriver, the integrated logging aggregation capability for GCP, helps monitor and speed debugging on every tier of the AgroStar solution.
Machine learning to enhance yields
AgroStar is developing a variety of ML components to improve responsiveness and extend its platform offerings.
To speed up the diagnosis of and treatment for crop blight, AgroStar is building a deep learning pipeline using TensorFlow. The pipeline relies on GoogLeNet models that use multi-layered convolutional visual pattern recognition. It will assess uploaded images to support a disease-detection capability on the mobile app. Based on the commercially successful AI algorithms that automated postal code processing, GoogLeNet offers improved performance and computational efficiencies by using a creative layering technique that distinguishes them from older, sequential recognition engines.
To improve its customer search experience, AgroStar is developing an ML pipeline that shrinks fetch times by suggesting tags mapped to stored data. Processed using TPUs, Cloud Natural Language and Video AI, the tags provide a metadata layer that supports queries in any of the ten natural languages that AgroStar farmers can use.
The AgroStar search pipeline consists of Long Short-Term Memory (LSTM) models of Recurrent Neural Networks. Recurrent networks exhibit “memory” through iterative processing and are distinguished from feedforward networks by a feedback loop connected to their past decisions, ingesting their own outputs moment after moment as input.
Implementing a recommendation engine
The firm is also adapting the Random Forests TensorFlow AI model to develop a crop and product recommendation engine. The model is trained by consuming numerical (rainfall, humidity, water availability per acre) and categorical (soil type, water sources) parameters to suggest appropriate products by season, region, and locale.
To simplify the product suggestion experience, AgroStar developers are testing Cloud Dialogflow, the Google Cloud conversational interface, to build a chatbot capability into its mobile app. The bot will track a farmer’s crop schedules and answer simple questions by linking to the recommendation engine.
AgroStar is also extending its analytics platform with AI-powered sales planning and forecasting. Using linear regression models implemented in TensorFlow and powered by Cloud ML Engine, the capability will enhance supply chain logistics as the company scales its operations across India.
To provide a credit on-demand offering for a range of seed-to-harvest cycle products, AgroStar is attempting to use Vision API to create an AI model that will convert uploaded photos of customer application records into standard data formats. The firm’s credit policy features a grace period in which farmers begin paying back loans after harvested crops go to market.
A versatile and friendly development ecosystem
AgroStar credits the convivial tools and documentation that GCP offers and its incremental, pay-as-you-go pricing model for both the firm’s success and its ability to manage growth.
“What Google Cloud offers is extremely good documentation and extremely simple-to-use tools and interfaces across all services,” says Pritesh. “It helped us initially deploy our platform and at every scale that we have required since then, and its cost effectiveness enabled us to staff up to meet new feature milestones.”
Custom Voice Feature Can Help Brands Tweak IVR for Better Customer Experiences

5120
Of your peers have already read this article.
1:30 Minutes
The most insightful time you'll spend today!
With the rise of digital assistants and conversational interfaces, people have grown accustomed to hearing and speaking to synthetic voices. But what do those voices sound like? Often, pretty repetitive. We’re all familiar with the Google Assistant voice, for example.
That’s why we are excited to announce the general availability of Custom Voice in our Cloud Text-to-Speech (TTS) API, a new feature that lets you train custom voice models with your own audio recordings to create unique experiences.
For businesses looking to build a strong brand identity, establishing a unique voice can help turn mobile app interactions or customer service based on interactive voice responses (IVR) into differentiated customer experiences. Our TTS API has included a speech synthesis service with a static list of voices for some time, but now, with Custom Voice, moving beyond these predefined options is easier than ever.
Custom Voice lets you simply submit your audio recordings to get access to the new voice directly in the TTS API. Custom Voice TTS includes guidance on the audio requirements to help make sure you generate a high quality custom TTS voice model. Once this new model is trained, all you have to do to start using the newly trained voice is reference the model ID in your calls to the Cloud TTS API.
At Google, we are committed to building safe and accountable AI products, not only because it’s the right thing to do, but because it is a critical step in ensuring successful use in production. As part of Google Cloud’s Responsible AI governance process, we conducted a deep ethical evaluation of Custom Voice TTS, and its relation to synthetic media, in order to surface and mitigate potential harms that it may create. If you are interested in Custom Voice TTS, there is a review process to help ensure each use case is aligned with our AI Principles and adequate voice actor consent is given.
Additionally, to verify that voice actors are actually the ones producing the audio, you will need to submit an audio file producing a sentence that Google Cloud chooses (for example: “I agree that my voice will be used to create a synthetic custom Text-to-Speech voice).
We’re looking forward to seeing this API help businesses solve problems in an easy, fast, and scalable way. TTS Custom Voice is now GA in these languages:
English (US)
English (AU)
English (UK)
Spanish (US)
Spanish (Spain)
French (France)
French (Canada)
Italian (Italy)
German (Germany)
Portugues (Brazil)
Japanese (Japan)
We plan to continue expanding this lineup in order to meet your needs. Ready to try for yourself? Contact your seller to get started on your use case evaluation today!
Rapido: Finding the Quickest Route to Success with Google Maps Platform

3873
Of your peers have already read this article.
3:30 Minutes
The most insightful time you'll spend today!
Founded in 2015, Rapido operates a mobile app-based two-wheeler taxi service across more than 40 cities in India. More than 100,000 drivers provide Rapido two-wheeler taxi services, while more than 400,000 current or prospective drivers have downloaded the company’s app. Consumers have downloaded the app more than 5 million times, and the business receives about 5 million orders per month for taxi services.
“If a consumer wants to travel from point A to point B, they simply open up the app on their smartphone, select pickup and dropoff locations, and tap ‘request,'” explains Rishikesh SR, Co-Founder, Rapido. “We can track that request to the nearest available two-wheeler taxi and allocate the job to the right driver.”
Google a compelling opportunity
The business started operations on a cloud service. However, Google presented a compelling opportunity to Rapido to improve its location-based intelligence through a wide range of cloud-based map APIs, infrastructure, and mobile app development services. “Google Maps Platform was particularly interesting to our business and we saw enormous potential to use it to improve our service and gain a competitive edge,” says Rishikesh.
Rapido elected to use Geocoding API to enable its app to convert addresses to geographic coordinates, and the reverse, allowing consumers to identify point A and point B on their journey. The company also uses Directions API to identify the fastest route between pickup and dropoff locations, which enables Rapido to provide users with approximate prices for trips. Distance Matrix API is used to calculate the travel times and distances between locations, and Maps SDKs for Android and iOS to add interactive maps to the app.
Google Cloud Results
- Enables the business to optimize use of Maps Platform APIs
- Takes 5 million orders per month
- Establishes a robust platform for expansion
“Google Maps Platform is particularly useful for us as it identifies optimum routes for two-wheel services,” says Rishikesh. “This saves us time and money, while helping us deliver a better consumer experience.”
In addition, Rapido uses the Snap to Roads service to deliver best-fit geometry for sets of GPS coordinates within the Roads API, which identifies and provides metadata about the roads on which drivers travel. “Snap to Roads in Roads API allows us to optimize the path drivers take and helps ensure the fare charged is accurate,” says Rishikesh.
Improving user experiences
As Rapido matured, Rishikesh considered how to improve the user experience of the app while reducing the business’ costs. In 2017, Rapido asked Google Cloud Premier Partner and Google Maps Platform Partner Searce to help meet these objectives. Searce provided the technical and business advice that prompted Rapido to take advantage of the unlimited API calls, 24-hours-a-day, 7-days-a-week support, and strict SLAs available through the Google Maps APIs Premium Plan for Asset Tracking.
Searce also helped Rapido optimize its API calls and integrate directions and distance calls with the Roads API to smooth out variations in GPS readings received from the handsets of two-wheeler taxi owners. Finally, Searce helped Rapido deploy the Firebase mobile and web development platform to automate the mode configuration of the API keys, rather than maintain a time-consuming manual process. This move also minimized the likelihood of any issues arising if Rapido decided to start multiple projects or add more licenses, or combine Google Maps APIs Premium Plan for Asset Tracking with an external license.
Technical skill and experience
Searce finalized its initial engagement with Rapido last year and provides ongoing support and advice. “Searce’s technical skill with Google Maps Platform put us on the right path to provide a better, more relevant user experience,” says Rishikesh.
Rapido also now uses a range of Firebase services for app development, testing, and modification. The business employs Google Analytics for Firebase to measure customer use of and engagement with its app, enabling the business to make informed decisions about where to direct its resources. In addition, the business is using the Firebase Test Lab app-testing infrastructure to test its Android and iOS apps across a range of device configurations, view the outcomes, and make changes as needed.
Rapido uses Firebase Remote Config to change the app’s behavior and appearance on the fly in response to the results of A/B testing across sections of its user base. Furthermore, Rapido uses Firebase Crashlytics to provide app crash reports to its Firebase console.
Firebase Dynamic Links allows Rapido to direct users to linked content in the iOS or Android version of the app, while Firebase Cloud Messaging enables Rapido to deliver notifications and other messages to users. Cloud Firestore provides a NoSQL cloud database to store and sync data for the Rapido app.
Rapido has also started using the Firebase Realtime Database to store and sync information about customers that can be used to provide a more informed, personalized service.
At the same time, Rapido uses a BigQuery data warehouse to process about 10TB of data every month for analysis and reporting that supports decision-making across the business. The organization is also using application containerization through Google Kubernetes Engine on Google Cloud Platform.
“We are moving our apps from dedicated virtual machines to a scalable containerized environment that consumes fewer resources,” says Rishikesh. “It makes sense to work with Google – the business that designed the Kubernetes container-orchestration system.”
Rapido has also started using the Cloud Functions event-driven serverless compute platform to process smaller jobs. “This is ideal for small use cases in particular as we do not have to spin up virtual machine instances,” says Rishikesh.
Finally, Rapido is using image classification through the Vision AI service to analyze riders’ documentation, such as driving licenses. This allows the business to verify details such as names, addresses, and expiry dates with more than 90 percent accuracy – a high rate in a country where each state has its own license template.
Expanding rapidly to new cities
The Rapido app enables drivers to pick up customers quickly – in most cases, between 2 and 5 minutes.
Overall, the high-quality experience for consumers and drivers delivered by Google Maps Platform, combined with Firebase, has helped power Rapido to robust growth. The business now takes more than 5 million orders per month.
“With Google, we are delivering the right experience to users through Google Maps Platform, Firebase, and Google Cloud Platform services,” concludes Rishikesh. “We have realized our vision faster and now have a robust platform to grow in the future.”
More Relevant Stories for Your Company

Lending DocAI Shortens Borrowers’ Journey on Roostify
The home lending journey entails processing an immense number of documents daily from hundreds of thousands of borrowers. Currently, home lending document processing relies on some outdated digital models and a high dependency on manual labor, resulting in slow processing times and higher origination costs. Scaling a business that sorts

Trimoz Technologies and Google Cloud-built Vaccination Appointment Scheduler Managed 365,000 Appointments Daily!
When public health officials in Quebec set out to provide COVID-19 vaccination services for their 8 million residents in February 2021, they needed an easy-to-use, scalable solution to schedule appointments online. To make it simple for Quebecers to register for vaccines, the goal was to use Clic Santé, a familiar

2,602 Uses of AI for Social Good, and What We Learned from Them
For the past few years, we’ve applied core Google AI research and engineering to projects with positive societal impact, including forecasting floods, protecting whales and predicting famine. Artificial intelligence has incredible potential to address big social, humanitarian and environmental problems, but in order to achieve this potential, it needs to be accessible to organizations

Release of Go 1.18 is A New Milestone for Development of Secure Apps
On March 15th, the Go team announced Go 1.18 GA, the latest release of the Go programming language. The culmination of over a decade of design delivers the features our developers demanded: generics, fuzzing, and module workspaces. With this release, Go becomes the first major language to integrate fuzz testing
