





An AI-Powered Cost Cutting Guide: 8 Strategies for Maximizing Profits

1706
Of your peers have already read this article.
3:30 Minutes
The most insightful time you'll spend today!
We are increasingly seeing one question arise in virtually every customer conversation: How can the organization save costs and drive new revenue streams?
Everyone would love a crystal ball, but what you may not realize is that you already have one. It’s in your data. By leveraging Data Cloud and AI solutions, you can put your data to work to achieve your financial objectives. Combining your data and AI reveals opportunities for your business to reduce expenses and increase profitability, which is especially valuable in an uncertain economy.
Google Cloud customers globally are succeeding in this effort, across industries and geographies. They are improving ROI by saving money and creating new revenue streams. We have distilled the strategies and actions they are implementing—along with customer examples and tips—in our eBook, “Make Data Work for You.” In it, you’ll find ways you can pare costs, increase profitability, and monetize your data.
Find money in your data
Our Google Cloud teams have identified eight strategies that successful organizations are pursuing to trim expenses and uncover new sources of revenue through intelligent use of data and AI. These use cases range from scaling small efficiencies in logistics to accelerating document-based workflows, monetizing data, and optimizing marketing spend.
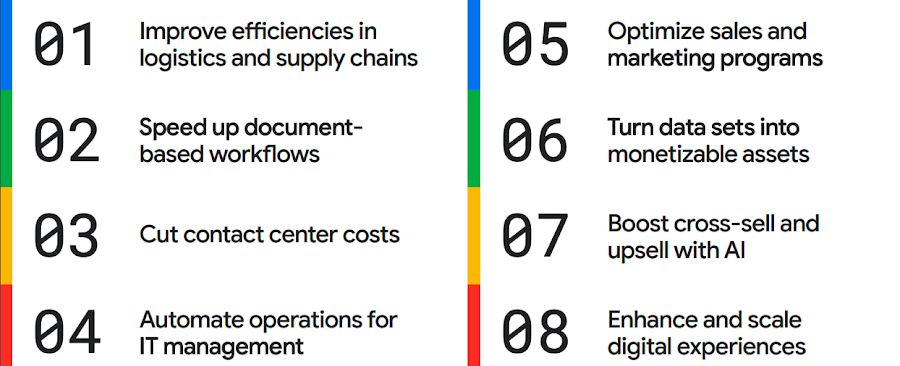
The results are impressive. They include massive cost savings and additional revenue. On-time deliveries have increased sharply at one company, and procure-to-pay processing costs have fallen by more than half at another. Other organizations have reaped big gains in ecommerce upselling and customer satisfaction.
We’ve found that businesses across every industry and around the globe are able to take action on at least one of these eight strategies. Contrary to common misperceptions, implementation does not require massive technology changes, crippling disruption to your business, or burdensome new investments.
What success looks like
If you worry your business is not ready or you need to gain buy-in from leadership, the success stories of the 15 companies in this report are helpful examples. Learning how organizations big and small, in different industries and parts of the world, have implemented these data and AI strategies makes the opportunities more tangible.
Carrefour
Among the world’s largest retailers, Carrefour operates supermarkets, ecommerce, and other store formats in more than 30 countries. To retain leadership in its markets, the company wanted to strengthen its omnichannel experience.
Carrefour moved to Google Data Cloud and developed a platform that gives its data scientists secure, structured access to a massive volume of data in minutes. This paved the way for smarter models of customer behavior and enabled a personalized recommendation engine for ecommerce services.
The company saw a 60% increase in ecommerce revenue during the pandemic, which it partly attributes to this personalization.
ATB Financial
ATB Financial, a bank in the Canadian province of Alberta, uses its data and AI to provide real-time personalized customer service, generating more than 20,000 AI-assisted conversations monthly. Machine learning models enable agents to offer clients real-time tailored advice and product suggestions.
Moreover, marketing campaigns and month-end processes that used to take five to eight hours now run in seconds, saving over CA$2.24 million a year.
Bank BRI
Bank BRI, which is owned by the Indonesian government, has 75.5 million clients. Through its use of digital technologies, the institution amasses a lot of valuable data about this large customer base.
Using Google Cloud, the bank packages this data through more than 50 monetized open APIs for more than 70 ecosystem partners who use it for credit scoring, risk management, and other applications. Fintechs, insurance companies, and financial institutions don’t have the talent or the financial resources to do quality credit scoring and fraud detection on their own, so they are turning to Bank BRI.
Early in the effort, the project generated an additional $50 million in revenue, showing how data can drive new sources of income.
How to get going now
“Make Data Work for You” will help you launch your financial resiliency initiatives by outlining the steps to get going. The process lays the groundwork for realizing your own cost savings and new revenue streams by leveraging data and AI.
Among these steps include building frameworks to operate cost efficiently, make informed decisions related to spending and optimize your data and AI budgets.
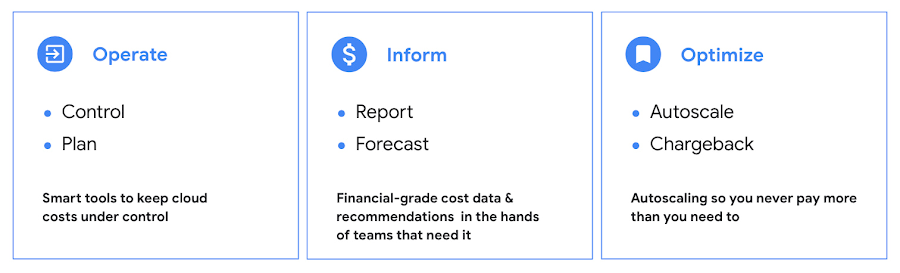
Operate: Billing that’s specific to your use-case
Control your costs by choosing data and analytics vendors who offer industry-leading data storage solutions and flexible pricing options. For example, multiple pricing options such as flat rate and pay-as-you-go allow you to optimize your spend for best price-performance.
Inform: make informed decisions based on usage
Use your cloud vendor’s dashboards or build a billing data report to gain insights on your spending over time. Make use of cost recommendations and other forecasting tools to predict what your future expenses are going to be.
Optimize: Never pay more than you use
While planning data analytics capacity, organizations often overprovision and overpay than what they actually use. Consider migrating your workloads that have unpredictable demand to a data warehousing solution that offers granular level autoscaling features so that you never have to pay for more than what you use.
There are other key moves that will set your initiative up for success including how to shorten time to value in building AI models and measuring impact. You can find details in the report.
A brighter future
The teams at Google Cloud helped the companies in “Make Data Work for You,” along with many more organizations, use their data and AI to achieve meaningful results. Download the full report to see how you can too.
Google Cloud Data Heroes Series: Honoring Data Practitioner’s Journey and Learning with GCP

4962
Of your peers have already read this article.
4:00 Minutes
The most insightful time you'll spend today!
Google Cloud Data Heroes is a series where we share stories of the everyday heroes who use our data analytics tools to do amazing things. Like any good superhero tale, we explore our Google Cloud Data Heroes’ origin stories, how they moved from data chaos to a data-driven environment, what projects and challenges they are overcoming now, and how they give back to the community.
For our first issue, we couldn’t be more excited to introduce Google Cloud Data Heroine Lynn Langit. Lynn is a seasoned business woman in Minnesota beginning her eleventh year as the Founder of her own consulting business, Lynn Langit Consulting LLC. Lynn wears many data professional hats including Cloud Architect, Developer, and Educator. If that wasn’t already a handful, she also loves riding her bike at any given season of the year (pictured on the right), which you might imagine gets a bit challenging when you have to invest in bike studded snow tires!

Tell us how you got to be a data practitioner. What was that experience like and how did this journey bring you to GCP?
I worked on the business side of tech for many years. While I enjoyed my work, I found I was intrigued by the nuanced questions practitioners could ask – and the sophisticated decisions they could make – once they unlocked value from their data. This initial intrigue developed into a strong curiosity and I ultimately made the switch from business worker to data practitioner over 15 years ago. This was a huge change in career considering I got my bachelor’s degree in Linguistics and German. And so I started small. I taught myself most everything both at the beginning and even now through online resources, courses, and materials. I began with database and data warehousing, specifically building and tuning many enterprise databases. It wasn’t until Hadoop/NoSQL became available that I pivoted to Big Data…
Back then, I supplemented my self-paced learning with Microsoft technologies, even earning all Microsoft certifications in just one year. When I noticed the industry shifting from on premise to cloud, I shifted my learning from programming to cloud, too. I have been working in the public cloud for over ten years already!
“I started with AWS, but recently I have been doing most everything in GCP. I particularly love implementing data pipelining, data ops, and machine learning.”
How did you supplement your self teachings with Google Cloud data upskilling opportunities like product deep dives and documentation, courses, skills, and certificates?
One of the first Google Cloud data analytics products I fell in love with was BigQuery. BigQuery was my gateway product into a much larger open, intelligent, and unified data platform full of products that combined data analytics, databases, AI/ML, and business intelligence.
I’ve achieved Skills Badges in BigQuery, Data Analysis, and more. I’ve also achieved Google’s Professional Data Engineer Certification, and have been a Google Developer Expert since 2012.
Most recently, I was named one of few Data Analysis Innovator Champions within the Google Cloud Innovators Program, which I’m particularly excited about because I’ve heard it’s a coveted spot for data practitioners and necessitates a Googler nomination to move from the Innovator membership to Champion title!
You’re undoubtedly a data analytics thought leader in the community. When did you know you moved from data student to data master and what data project are you most excited about?
I knew I had graduated, if you will, to the data architect realm once I was able to confidently do data work that matters, even if that work was outside of my usual domains: adTech and finTech..
For example, my work over the past few years has been around human health outcomes, including combatting the COVID-19 pandemic. I do this by supporting scientists and bioinformatic researchers with genomic-scale data pipelines. Did I know anything about genomics before I started? Not at all! I self-studied bioinformatics and recorded my learnings on GitHub. Along the way I adopted my learnings into an open source GCP course on GitHub aimed at researchers who are new to working with GCP. What’s cool about the course is that I begin from the true basics of how to set up a GCP account. Then I gradually work up to mapping out genomic-scale data workflows, pipelines, analyses, batch jobs, and more using BigQuery and a host of other Google Cloud data products.
Now, I’ve received feedback that this repository has made a positive impact on researchers’ ability to process and synthesize enormous amounts of data quickly. Plus, it achieves the greater goal of broadening accessibility to a public cloud like GCP.
In what ways do you think you uniquely bring value back to the data community? Why is it important to you to give back to the data community?
I stay busy always sharing my learnings back to the community. I record Cloud and Big data technical screencasts (demos) on Youtube, I’ve authored 25 data and cloud courses on LinkedIn Learning, and I occasionally write Medium articles on cloud technology and random thoughts I have about everyday life. I’m also the cofounder of Teaching Kids Programming, with a mission to help equip middle and high school teachers with a great programming curriculum on Java.
Begin your own hero’s journey
Ready to embark on your Google Cloud data adventure? Begin your own hero’s journey with GCP’s recommended learning path where you can achieve badges and certifications along the way. Join the Cloud Innovators program today to stay up to date on more data practitioner tips, tricks, and events.
Connect with Google’s data community at our upcoming virtual event “Latest Google Cloud data analytics innovations”. Register and save your spot now to get your data questions answered live by GCP’s top data leaders and watch demos from our latest products and features including BigQuery, Dataproc, Dataplex, Dataflow, and more. Lynn will take the main stage as an emcee for this event – you won’t want to miss!
Finally, if you think you have a good Data Hero story worth sharing, please let us know! We’d love to feature you in our series as well.
Real-time analytics for on-time delivery: Mercado Libre

3046
Of your peers have already read this article.
1:30 Minutes
The most insightful time you'll spend today!
Iteration and innovation fuel the data-driven culture at Mercado Libre. In our first post, we presented our continuous intelligence approach, which leverages BigQuery and Looker to create a data ecosystem on which people can build their own models and processes.
Using this framework, the Shipping Operations team was able to build a new solution that provided near real-time data monitoring and analytics for our transportation network and enabled data analysts to create, embed, and deliver valuable insights.
The challenge
Shipping operations are critical to success in e-commerce, and Mercado Libre’s process is very complex since our organization spans multiple countries, time zones, and warehouses, and includes both internal and external carriers. In addition, the onset of the pandemic drove exponential order growth, which increased pressure on our shipping team to deliver more while still meeting the 48-hour delivery timelines that customers have come to expect.
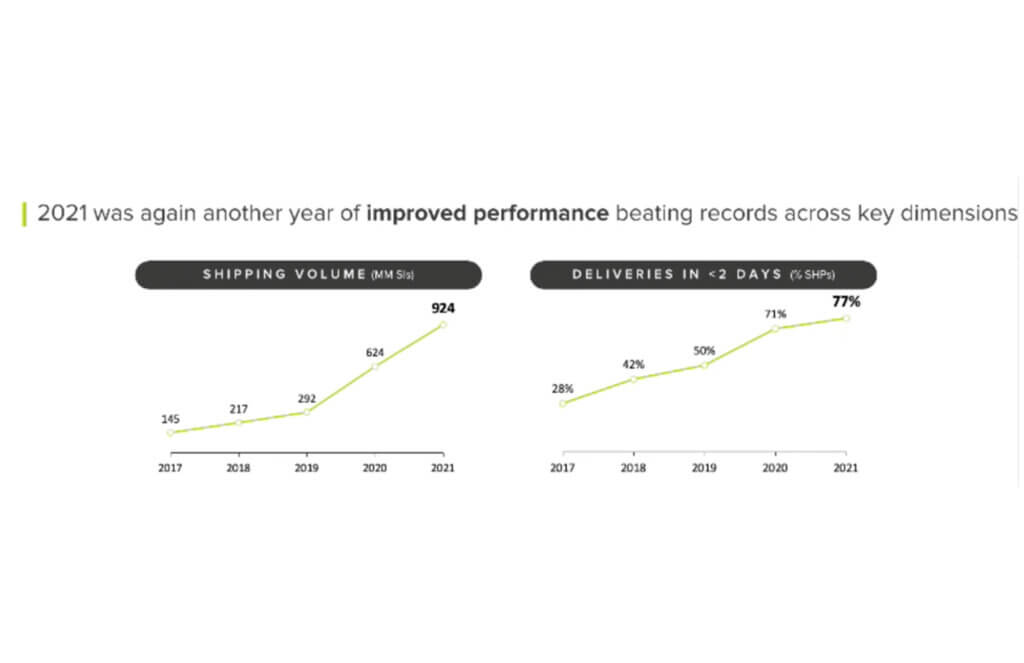
This increased demand led to the expansion of fulfillment centers and cross-docking centers, doubling and tripling the nodes of our network (a.k.a. meli-net) in the leading countries where we operate. We also now have the largest electric vehicle fleet in Latin America and operate domestic flights in Brazil and Mexico.
We previously worked with data coming in from multiple sources, and we used APIs to bring it into different platforms based on the use case. For real-time data consumption and monitoring, we had Kibana, while historical data for business analysis was piped into Teradata. Consequently, the real-time Kibana data and the historical data in Teradata were growing in parallel, without working together. On one hand, we had the operations team using real-time streams of data for monitoring, while on the other, business analysts were building visualizations based on the historical data in our data warehouse.
This approach resulted in a number of problems:
- The operations team lacked visibility and required support to build their visualizations. Specialized BI teams became bottlenecks.
- Maintenance was needed, which led to system downtime.
- Parallel solutions were ungoverned (the ops team used an Elastic database to store and work with attributes and metrics) with unfriendly backups and data bounded for a period of time.
- We couldn’t relate data entities as we do with SQL.
Striking a balance: real-time vs. historical data
We needed to be able to seamlessly navigate between real-time and historical data. To address this need, we decided to migrate the data to BigQuery, knowing we would leverage many use cases at once with Google Cloud.
Once we had our real-time and historical data consolidated within BigQuery, we had the power to make choices about which datasets needed to be made available in near real-time and which didn’t. We evaluated the use of analytics with different time windows tables from the data streams instead of the real-time logs visualization approach. This enabled us to serve near real-time and historical data utilizing the same origin.
We then modeled the data using LookML, Looker’s reusable modeling language based on SQL, and consumed the data through Looker dashboards and Explores. Because Looker queries the database directly, our reporting mirrored the near real-time data stored in BigQuery. Finally, in order to balance near real-time availability with overall consumption costs, we analyzed key use cases on a case-by-case basis to optimize our resource usage.
This solution prevented us from having to maintain two different tools and featured a more scalable architecture. Thanks to the services of GCP and the use of BigQuery, we were able to design a robust data architecture that ensures the availability of data in near real-time.
Streaming data with our own Data Producer Model: from APIs to BigQuery
To make new data streams available, we designed a process which we call the “Data Producer Model” (“Modelo Productor de Datos” or MPD) where functional business teams can serve as data creators in charge of generating data streams and publishing them as related information assets we call “data domains”. Using this process, the new data comes in via JSON format, which is streamed into BigQuery. We then use a 3-tiered transformation process to convert that JSON into a partitioned, columnar structure.
To make these new data sets available in Looker for exploration, we developed a Java utility app to accelerate the development of LookML and make it even more fun for developers to create pipelines.
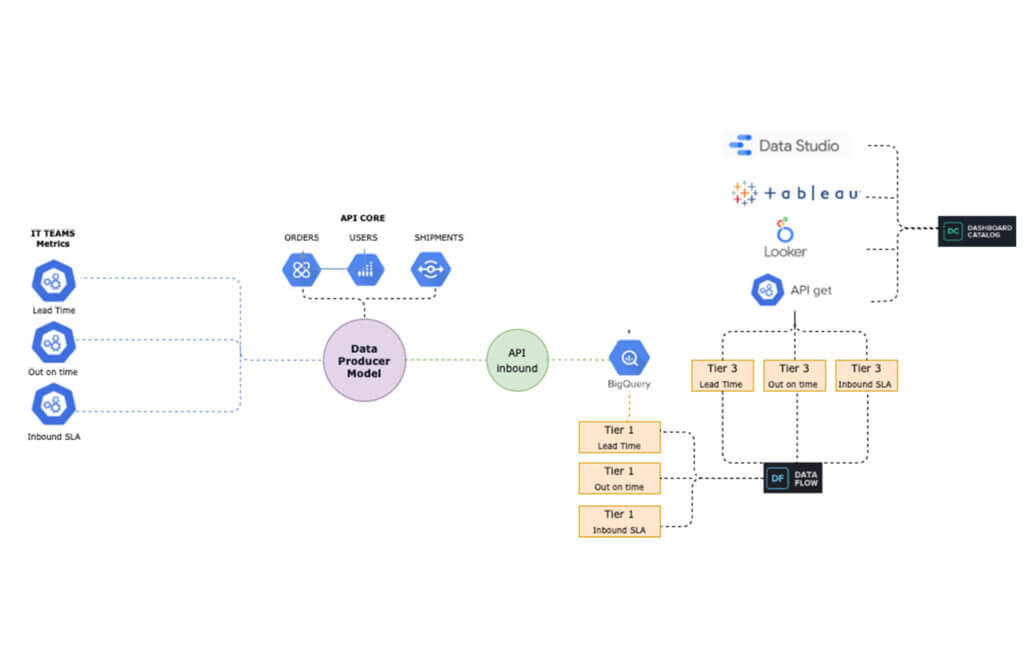
The complete “MPD” solution results in different entities being created in BigQuery with minimal manual intervention. Using this process, we have been able to automate the following:
- The creation of partitioned, columnar tables in BigQuery from JSON samples
- The creation of authorized views in a different GCP BigQuery project (for governance purposes)
- LookML code generation for Looker views
- Job orchestration in a chosen time window
By using this code-based incremental approach with LookML, we were able to incorporate techniques that are traditionally used in DevOps for software development, such as using Lams to validate LookML syntax as a part of the CI process and testing all our definitions and data with Spectacles before they hit production. Applying these principles to our data and business intelligence pipelines has strengthened our continuous intelligence ecosystem. Enabling exploration of that data through Looker and empowering users to easily build their own visualizations has helped us to better engage with stakeholders across the business.
The new data architecture and processes that we have implemented have enabled us to keep up with the growing and ever-changing data from our continuously expanding shipping operations. We have been able to empower a variety of teams to seamlessly develop solutions and manage third party technologies, ensuring that we always know what’s happening – and more critically – enabling us to react in a timely manner when needed.
Outcomes from improving shipping operations:
Today, data is being used to support decision-making in key processes, including:
- Carrier Capacity Optimization
- Outbound Monitoring
- Air Capacity Monitoring
This data-driven approach helps us to better serve you -and everyone- who expects to receive their packages on-time according to our delivery promise. We can proudly say that we have improved both our coverage and speed, delivering 79% of our shipments in less than 48 hours in the first quarter of 2022.
Here is a sneak peek into the data assets that we use to support our day-to-day decision making:
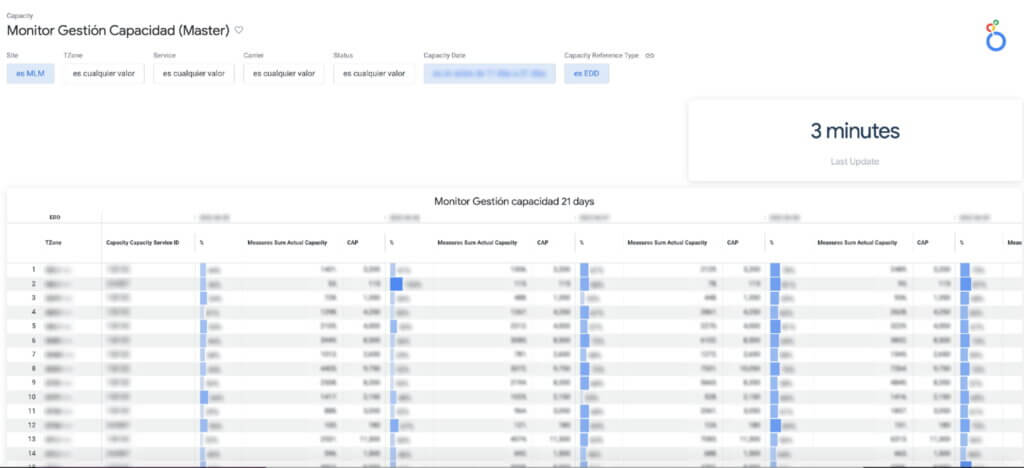
a. Carrier Capacity: Allows us to monitor the percentage of network capacity utilized across every delivery zone and identify where delivery targets are at risk in almost real time.
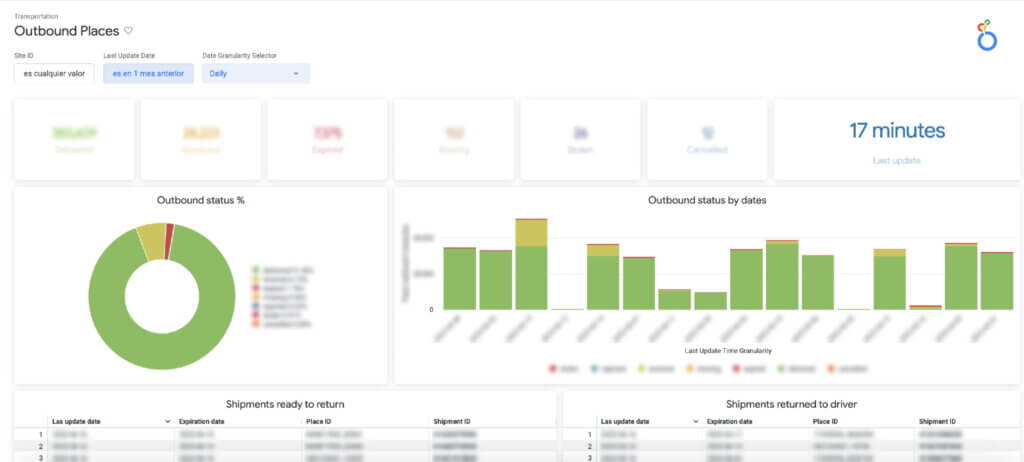
b. Outbound Places Monitoring: Consolidates the number of shipments that are destined for a place (the physical points where a seller picks up a package), enabling us to both identify places with lower delivery efficiency and drill into the status of individual shipments.
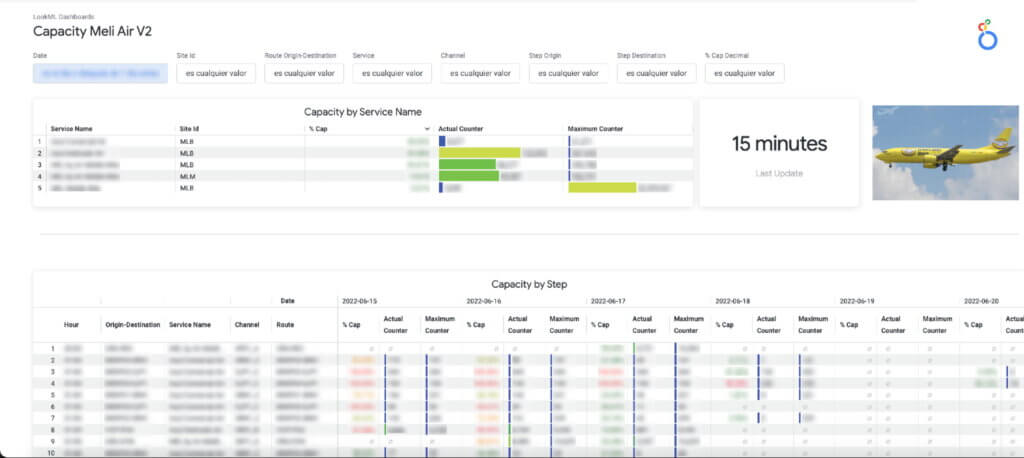
c. The Air Capacity Monitoring: Provides capacity usage monitoring for our aircrafts running each of our shipping routes.
Costs into the equation
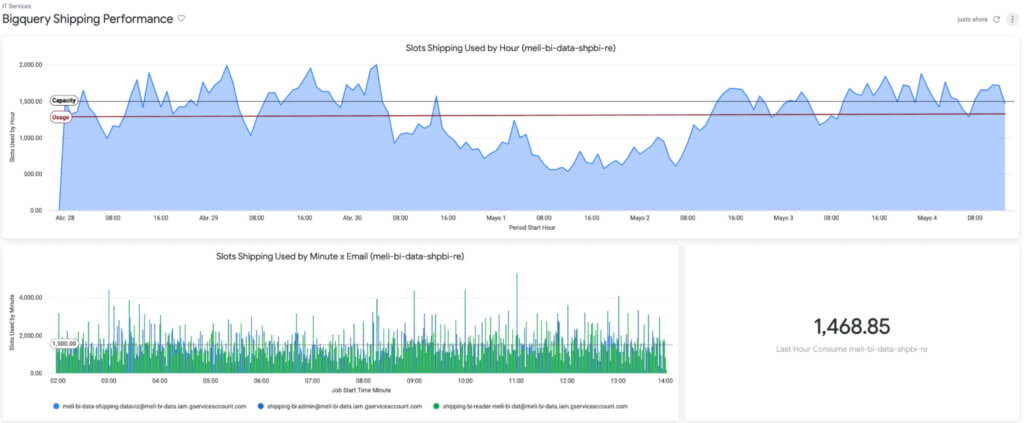
The combination of BigQuery and Looker also showed us something we hadn’t seen before: overall cost and performance of the system. Traditionally, developers maintained focus on metrics like reliability and uptime without factoring in associated costs.
By using BigQuery’s information schema, Looker Blocks, and the export of BigQuery logs, we have been able to closely track data consumption, quickly detect underperforming SQL and errors, and make adjustments to optimize our usage and spend.
Based on that, we know the Looker Shipping Ops dashboards generate a concurrency of more than 150 queries, which we have been able to optimize by taking advantage of BigQuery and Looker caching policies.
The challenges ahead
Using BigQuery and Looker has enabled us to solve numerous data availability and data governance challenges: single point access to near real-time data and to historical information, self-service analytics & exploration for operations and stakeholders across different countries & time zones, horizontal scalability (with no maintenance), and guaranteed reliability and uptime (while accounting for costs), among other benefits.
However, in addition to having the right technology stack and processes in place, we also need to enable every user to make decisions using this governed, trusted data. To continue achieving our business goals, we need to democratize access not just to the data but also to the definitions that give the data meaning. This means incorporating our data definitions with our internal data catalog and serving our LookML definitions to other data visualizations tools like Data Studio, Tableau or even Google Sheets and Slides so that users can work with this data through whatever tools they feel most comfortable using.
If you would like a more indepth look at how we made new data streams available from a process we designed called the “Data Producer Model” (“Modelo Productor de Datos” or MPD) register to attend our webcast on August 31.
While learning and adopting new technologies can be a challenge, we are excited to tackle this next phase, and we expect our users will be too, thanks to a curious and entrepreneurial culture. Are our teams ready to face new changes? Are they able to roll out new processes and designs? We’ll go deep on this in our next post.
Empower Your Firm’s Data Decisions with Dataplex Data Lineage

1509
Of your peers have already read this article.
2:30 Minutes
The most insightful time you'll spend today!
Today, we are excited to announce the general availability of Dataplex data lineage — a fully managed Dataplex capability that helps you understand how data is sourced and transformed within the organization. Dataplex data lineage automatically tracks data movement across BigQuery, BigLake, Cloud Data Fusion (Preview), and Cloud Composer (Preview), eliminating operational hassles around manual curation of lineage metadata.
With rising data volume spread across data silos, it can be challenging for organizations to ensure users have a self-service mechanism to discover, understand and trust the data. Organizations constantly struggle with questions such as:
- Is the data extracted from an authoritative source?
- What is the impact if I drop this table?
- The data in this table seems corrupted – where did this data come from, and when was it last refreshed?
- How is sensitive information being moved or copied? Is it in adherence to data governance practices?
To answer the above questions, organizations need to track how data is sourced and transformed, which can be complex and requires significant effort.
Dataplex data lineage describes each lineage relationship by detailing what happened and when it happened in an interactable lineage graph, providing data observability.
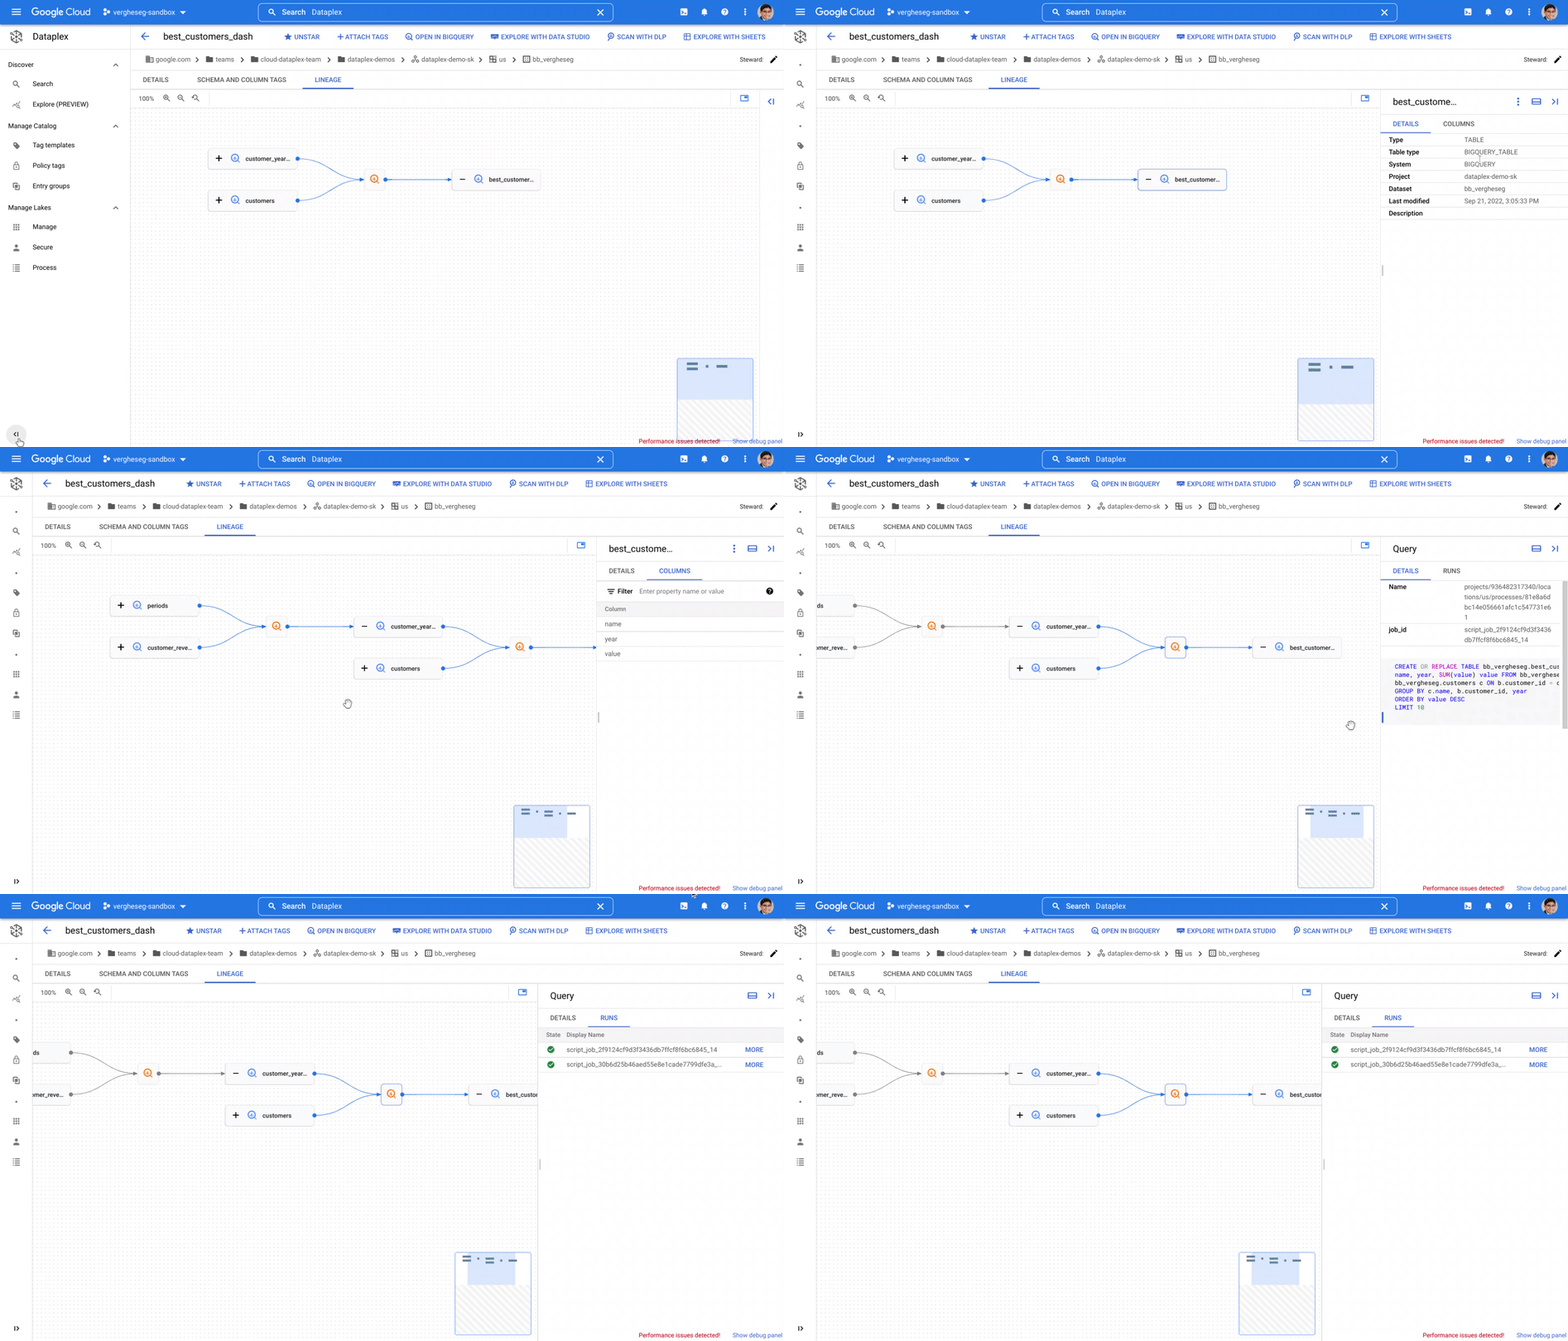
Data analysts who want to know if a table originates from an authoritative source can now answer this in a self-service manner with a simple look-up of lineage for the concerned table — available in Dataplex and in BigQuery for in-context analysis.
Data engineers can reduce time to identify and resolve data issues through root cause analysis using the operational metadata trace asserting a lineage relationship. Data lineage also aids deterministic change management by providing the ability to evaluate the impact of a change and collaborate with the corresponding stakeholders to minimize any adverse impact.
Finally, data lineage provides a map of data movement which can become the foundation for data governance practice. It enables data stewards and owners to evaluate and enforce adherence to governance requirements, especially when tracking the movement of sensitive information.
Dataplex data lineage provides APIs for extensibility so that organizations can report lineage from various systems and have a single map of how data entries are related.
What our customers are saying
L’Oréal, the world’s largest cosmetics company, is on a mission to ‘create the beauty that moves the world.’ “Dataplex data lineage helps us understand how data moves across our organization,” said Sébastien Morand, Head of Data Engineering team, L’Oréal. “As a fully managed solution, it becomes the main entry point to diagnose data issues and evaluate the impact of a change or incident — providing insight on what happened and when it happened, including reference to the execution metadata. Directly integrated into our beauty tech data platform, data lineage helps us reduce data issues and also enables us to mitigate issues faster when it does happen.”
“At Wayfair, we treat data-as-a-product and are building a robust data platform that provides self-service access and compliance constructs,” said Vinit Rajopadhye, Associate Director on Data Infrastructure & Data Enablement at Wayfair. “We are excited about Dataplex data lineage as it helps our data consumers trust data based on where it originates and the transformations applied.”
Hurb is an online travel agency in Brazil with a mission to optimize travel through technology. “Hurb has a rapidly growing data platform, with new data assets created and registered daily to support business decision-making and Machine Learning models,” said Vinícius dos Santos Mello, Senior Data Engineer. “Thanks to Dataplex data lineage features, we have end-to-end data observability across data in BigQuery. We can proactively address schema changes, data quality issues, and asset depreciation that could otherwise negatively affect the business.”
“As a company with many business domains and services, we handle a large volume of data and use it to power our decision making, so it is crucial to ensure data quality. Dataplex data lineage provides a visual understanding of the flow of data across our organization, improving efficiency of impact investigations when problems occur and increasing the reliability of the data.” said Mitsunori Fukase, Data Platform Department Group Manager, DeNA.
Get started with Dataplex data lineage
You can get started with Dataplex data lineage by enabling the Data Lineage API on your project. You can learn more here.
Additional Resources:
Move over Myths! Here’s What You Need to Know about Cloud Spanner

3530
Of your peers have already read this article.
3:00 Minutes
The most insightful time you'll spend today!
Intro to Cloud Spanner
Cloud Spanner is an enterprise-grade, globally distributed, externally consistent database that offers unlimited scalability and industry-leading 99.999% availability. It requires no maintenance windows and offers a familiar PostgreSQL interface. It combines the benefits of relational databases with the unmatched scalability and availability of non-relational databases.
As organizations modernize and simplify their tech stack, Spanner provides a unique opportunity to transform the way they think about and use databases as part of building new applications and customer experiences.
But choosing a database for your workload can be challenging; there are so many options in the market and each one has a different onboarding and operating experience. At Google Cloud we know it’s hard to navigate this choice and are here to help you. In this blog post, I want to bust the seven most common misconceptions that I regularly hear about Spanner so that you can confidently make your decision.
Myth #1 Only use Spanner if you have a massive workload
The truth is that Spanner powers Google’s most popular, globally available products, like YouTube, Drive, and Gmail, and has enabled many large scale transformations including that of Uber, Niantic and Sharechat. It is also true that Spanner processes more than 1 Billion queries per second at peak.
At the same time, many customers also use Spanner for their smaller workloads (both in terms of transactions per second and storage size) for availability and scalability reasons. For example, Google Password Manager has small workloads that run on Spanner. These customers cannot tolerate downtime, require high availability to power their applications and seek scale insurance for future growth scenarios.
Limitless scalability with the highest availability is critical in many industry verticals such as gaming and retail, especially when a newly launched game goes viral and becomes an overnight success or when a retailer has to handle a sudden surge in traffic due to a Black Friday/Cyber Monday sale.
Regardless of workload size, every customer on the journey to the cloud wants the benefits of scalability and availability while reducing the operational burden and the costs associated with patching, upgrades and other maintenance.
Myth #2 Spanner is too expensive
The truth is, when looking at the cost of a database, it is better to consider Total Cost of Ownership (TCO) and the value it offers rather than the raw list price. We deliver significant value to our customers starting at this price including critical things like availability, price performance, and reduced operational costs.
- Availability: Spanner provides high availability and reliability by synchronously replicating data. When it comes to Disaster Recovery, Spanner offers 0-RPO and 0-RTO for zonal failures in case of a regional instance and regional failure in case of multi-regional instances. Less downtime, more revenue!
- Price-performance: Spanner offers one of the industry’s leading price-performance ratios which makes it a great choice if you are running a demanding, performance sensitive application. Great customer experiences require consistent, optimal latencies!
- Reduced operational cost: With Spanner, customers enjoy zero downtime upgrades and schema changes, and no maintenance windows. Sharding is automatically handled so the challenges associated with scaling up traditional databases don’t exist. Spend more time innovating, and less time administering!
- Security & Compliance: By default, Spanner already offers encryption for data-in-transit via its client libraries and for data-at-rest using Google-managed encryption keys. CMEK support for Spanner lets you now have complete control of the encryption keys. Spanner also provides VPC Service Controls support and has compliance certifications and necessary approvals so that it can be used for workloads requiring ISO 27001, 27017, 27018, PCI DSS, SOC1|2|3, HIPAA and FedRAMP.
With Spanner, you have peace of mind knowing that your data’s security, availability and reliability won’t be compromised.
And best of all, with the introduction of Granular Instance Sizing, you can now get started for as little as $65/month and unlock the tremendous value spanner offers.
Pro tip : Use the auto-scaler to right size your Spanner instances. Take advantage of TTL to reduce the amount of data stored.
Myth #3 You have to make a trade off between scale, consistency, and latency
The truth is, depending on the use case and instance configuration, users can use Spanner such that they don’t have to pick between consistency, latency and scale.
To provide strong data consistency, Spanner uses a synchronous, Paxos-based replication scheme, in which replicas acknowledge every write request. A write is committed when a majority of the replicas (e.g 2 out of 3), called a quorum, agree to commit the write. In the case of regional instances, the replicas are within the region and hence the writes are faster than in the case of multi-region instances, where the replicas are distributed across multiple regions. In the latter case, forming a quorum on writes can result in slightly higher latency. Nevertheless, Spanner multi-regions are carefully designed in geographical configurations that ensure that the replicas can communicate fast enough and write latencies are acceptably low.
A read can be served strong (by default) or stale. A strong read is a read at a current timestamp and is guaranteed to see all the data that has been committed up until the start of the read. A stale read is a read executed at a timestamp in the past. In case of a strong read, the serving replica will guarantee that you will see all data that has been committed up until the start of the read. In some cases, this means that the serving replica has to contact the leader to ensure that it has the latest data. In case of a multi-region instance where the read is served from a non-leader replica, this would mean that read latency can be slightly higher than if it was served from a leader region. Stale reads are performed over data that was committed at a timestamp in the past and can, therefore, be served at very low latencies by the closest replica that is caught up until that timestamp. If your application is latency sensitive, stale reads may be a good option and we recommend using a stale read value of 15 seconds.
Myth #4 Spanner does not have a familiar interface
The truth is that Spanner offers the flexibility to interact with the database via a SQL dialect based on ANSI 2011 standard as well as via a REST or gRPC API interface, which are optimized for performance and ease-of-use. In addition to Spanner’s interface, we recently introduced a PostgreSQL interface for Spanner, that leverages the ubiquity of PostgreSQL to meet development teams using an interface that they are familiar with. The PostgreSQL interface provides a rich subset of the open-source PostgreSQL SQL dialect, including common query syntax, functions, and operators. It supports a core collection of open-source PostgreSQL data types, DDL syntax, and information schema views. You get the PostgreSQL familiarity, and relational semantics at Spanner scale.
Learn more about our PostgreSQL interface here.
Myth #5 The only way to get observability data is via the Spanner Console
The truth is that Spanner client libraries support OpenCensus Tracing and Metrics, which gives insight into the client internals and aids in debugging production issues. For instance, client-side traces and metrics include sessions and transactions related information.
Spanner also supports the OpenTelemetery receiver, which provides an easy way for you to process and visualize metrics from Cloud Spanner System tables, and export these to the Application Monitoring (APM) tool of your choice. This could be either an open source combination of a time-series database like Prometheus coupled with a Grafana dashboard, or it could be a commercial offering like Splunk, Datadog, Dynatrace, NewRelic or AppDynamics. We’ve also published reference Grafana dashboards, so that you can debug the most common user journeys such as “Why is my tail latency high” or “Why do I see a CPU spike when my workload did not change”. Here is a sample docker service, to show how the Cloud Spanner receiver can work with Prometheus exporter and Grafana dashboards.
We are continuing to embrace open standards, and continuing to integrate with our partner ecosystem. We also continue to evolve the observability experience offered by the Google console so that our customers get the best experience wherever they are.
Myth #6 Spanner is only for global workloads requiring copies in multiple regions
The truth is that, while Spanner offers a range of multi-region instance configurations, it also offers regional configuration in each GCP region. Each regional node is replicated in 3 zones within the region, while a multi-regional node is replicated at least 5 times across multiple regions. A regional configuration offers 4 nines of availability and protection against zonal failures.
Typically, multi-regional instance configurations are indicated if your application runs workloads in multiple geographical locations or your business needs 99.999% of availability and protection against regional failures. Learn more here.
Myth #7 Spanner schema changes require expensive locks
The truth is that Spanner never has table level locks. Spanner uses a multi-version concurrency control architecture to manage concurrent versions of schema and data allowing ad-hoc and online qualified schema changes that do not require any downtime, additional tools, migration pipelines or complex rollback/backup plans. When issuing a schema update you can continue writing and reading from the database without interruption while Spanner backfills the update, whether you have 10 rows or 10 billion rows in your table.
The same mechanism can be used for Point-in-time recovery (PITR) and snapshot queries using stale reads to restore both schema and the state of data at a given query-condition and timestamp up to a maximum of seven days.
Now that we’ve learned the truth about Cloud Spanner, I invite you to get started – visit our website.
Making Mothers’ Day Special: How Google Cloud Migration for 1-800-FLOWERS.COM, Inc Impacts CX

6831
Of your peers have already read this article.
2:30 Minutes
The most insightful time you'll spend today!
Editor’s note: In honor of Mother’s Day, we look at how 1-800-FLOWERS.COM, Inc. migrated to Google Cloud as part of its digital transformation to quickly deploy seamless and convenient customer experiences across multiple brands on Mother’s Day and every day.
As a leading provider of gifts designed to help customers express, connect, and celebrate, 1-800-FLOWERS.COM, Inc. has embraced cloud technologies to grow and transform its business through constant innovation. As part of our digital transformation, we recently completed the migration of our ecommerce platform and other services to Google Cloud. We’ve transitioned from a monolithic to a microservices platform, moved many workloads from our on-premises data centers to our Google Cloud environment, and scaled both horizontally and vertically.
Since our migration, we’ve developed efficient processes to launch new brands, improved the customer experience across all brands, and seen significantly increased site traffic.
Nurturing a more delightful customer journey
Customer delight is at the core of everything we do. Whether it be with a flower bouquet, a sweet treat, or a personalized keepsake, our mission is to deliver smiles. With the rise of the COVID-19 pandemic, we’ve all been challenged to find unique and safe ways to continue honoring the special connections in our lives and celebrating occasions with loved ones. Our customers have adapted by doing things such as sending gifts to isolated loved ones, sharing the same meal together virtually, or using video to engage with others through group activities like flower arranging and building charcuterie boards.
The customer experience is a top priority for us, and we constantly look for innovative ways to enhance the customer journey across our ecommerce platform of more than a dozen brands. As a result, we’ve continued to see a rise in demand as customers enjoy the ease and convenience of our site and discover our full family of brands.
Migrating to a cloud-first mindset
As we’ve continued to innovate and iterate on the customer experience, we knew we wanted to evolve our platform. We wanted to shift to a microservices platform, which would allow our team the opportunity to release updates to our site more often and set up the right continuous integration/continuous deployment (CI/CD) practices.
Working with Google Cloud, we were able to move our ecommerce platform to the cloud and standardize our site and brand deployment by building one release that could then be repeated across all of our brands. We built everything in a modular fashion, including microservices and code libraries, so that sites could be easily constructed and replicated for each brand. And because of this, we were able to launch Shari’s Berries extremely quickly after we acquired the brand in 2019.
Moving our platform to a completely homegrown solution of microservices was a daunting task. But our team handled it beautifully through load-testing, stress-testing, and building new monitoring tools. And with Google Cloud supporting us all along the way, managing the migration process was simple and easy from start to finish.
Arranging a better bouquet of services
Currently, we’ve migrated every customer-facing touchpoint for all of our brands to Google Cloud—whether it’s on the web or mobile, our AI bots, or our chat interfaces.
- We run on Google Kubernetes Engine and Istio.
- We have nearly 200 microservices built to help power our entire ecommerce stack across several cloud services running on Google Cloud.
- We’re utilizing BigQuery for our offline intelligence.
Results are coming up roses
Our new stack on Google Cloud has benefits for both us and our customers. We moved from a session-based to a token-based system, which provides enhanced security as well as a consistent, convenient experience across all our brands. Using service workers and a single-page app, we are able to download all the relevant site content to the browser in under two seconds to create an instant-click experience for each and every customer. We also use Google Analytics to measure our user interactions and provide personalized results to each customer. Our hope is that with this new system, we can learn from customer behavior to offer gift givers a more personalized shopping experience during each visit.
The benefits of our new tech stack have not only helped us enhance the solutions we offer to customers today, they’ve also enabled us to offer new ones at lightning speed. With our legacy system, we used to release new code once a week or once a month. Now, even during our peak periods, we’re able to release 10 to 15 times a day and can deploy and pivot quickly to create new microservices and microsites on the fly—often without having to touch any code.
Efficiencies abound
The benefits of moving our platform to Google Cloud have extended to our internal teams as well. Before the migration, we had only two environments for developing and testing, which made it time-consuming to test updates before they went into production. Now with Google Cloud, we have several different journey teams—which are made up of developers, product owners, and technical owners—all working in several different environments, solving problems, and creating new solutions together.
Everyone is now empowered to be self-sufficient, developing and releasing microservices on their own when they’re ready. This has given our developers more time to take part in continued development and learning opportunities. For example, we offer lunch-and-learn sessions as well as other resources for everyone to take advantage of so they can continue to learn and refine their skills.
Planting the seeds for future growth
As we look to the future and think about how we help our customers express, connect, and celebrate, we’ll continue to collaborate across teams to deliver solutions that spread smiles. Specifically, we’re exploring additional use of AI to help us better serve our customers across all our brands.
We’ve enjoyed the ongoing support we’ve received from the Google Cloud team as they help us build new solutions and design a road map for the future. Their support has helped the 1-800-FLOWERS.COM, Inc. team to realize the power of the cloud and bring the very best experience to our customers.
Learn more about 1-800-FLOWERS.COM, Inc., or check out our recent blog about cloud migration for the real world.
More Relevant Stories for Your Company

Blue Apron: Offering a better recipe for modern analytics
When Blue Apron had issues running its data warehouse on another cloud provider, it built an analytics platform using Looker and Google BigQuery to enable faster business decisions about food inventory. Google Cloud Results Enables near real-time business decisions to better manage food inventory and delivery by reducing query times

How Arvind Fashions Ltd leads the fashion industry with powerful data analytics on BigQuery
Arvind Ltd has been in the apparel industry for more than 90 years, with its retail powerhouse Arvind Fashions Ltd being the backbone of well-known names in the retail fashion industry in India. Arvind Fashions Ltd (Arvind) has seen significant growth in its portfolio with new franchises being added every

Soundtrack Your Brand: Delivering Sound That Stands Out From the Crowd with BigQuery
Editor’s note: Soundtrack Your Brand is an award-winning streaming service with the world’s largest licensed music catalog built just for businesses, backed by Spotify. Today, we hear how BigQuery has been a foundational component in helping them transform big data into music. Soundtrack Your Brand is a music company at

New to Cloud Firestore? Here are Some Basics You Need to Know
Learning to use a new database can be daunting, even more so if you don’t already have technical knowledge about databases. In this article, I will break down some database basics, terms you should know, what Firestore is, how it works, how it stores data, and how to get started
