





The Query Execution Graph: Your Key to Better BigQuery Analytics

3078
Of your peers have already read this article.
2:30 Minutes
The most insightful time you'll spend today!
BigQuery offers strong query performance, but it is also a complex distributed system with many internal and external factors that can affect query speed. When your queries are running slower than expected or are slower than prior runs, understanding what happened can be a challenge.
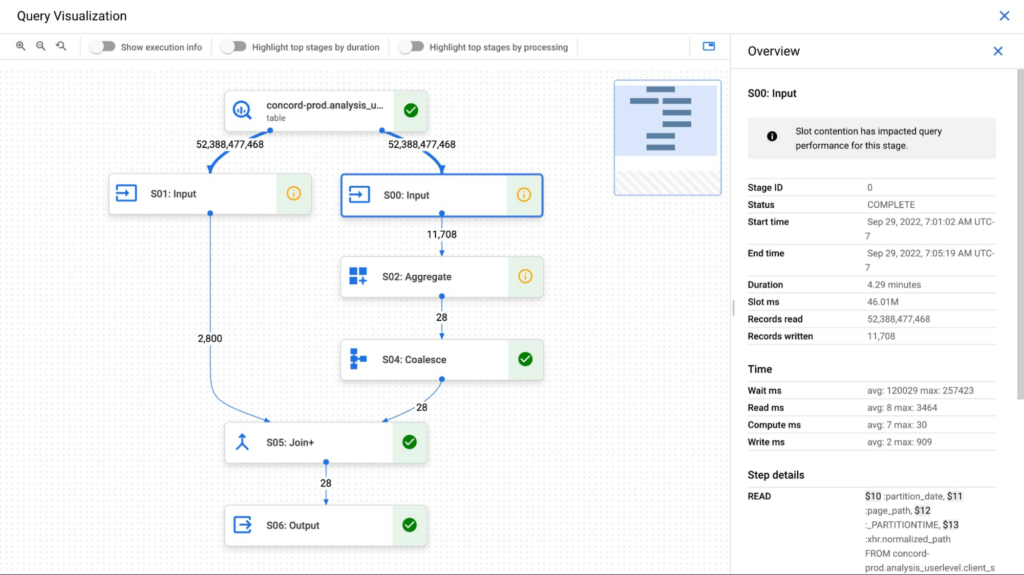
The query execution graph provides an intuitive interface for inspecting query execution details. By using it, you can review the query plan information in graphical format for any query, whether running or completed.
You can also use the query execution graph to get performance insights for queries. Performance insights provide best-effort suggestions to help you improve query performance. Since query performance is multi-faceted, performance insights might only provide a partial picture of the overall query performance.
Execution graph
When BigQuery executes a query job, it converts the declarative SQL statement into a graph of execution, broken up into a series of query stages, which themselves are composed of more granular sets of execution steps. The query execution graph provides a visual representation of the execution stages and shows the corresponding metrics. Not all stages are made equal. Some are more expensive and time consuming than others. The execution graph provides toggles for highlighting critical stages, which makes it easier to spot the potential performance bottlenecks in the query.
Query performance insights
In addition to the detailed execution graph BigQuery also provides specific insights on possible factors that might be slowing query performance.
Slot contention
When you run a query, BigQuery attempts to break up the work needed by your query into tasks. A task is a single slice of data that is input into and output from a stage. A single slot picks up a task and executes that slice of data for the stage. Ideally, BigQuery slots execute tasks in parallel to achieve high performance. Slot contention occurs when your query has many tasks ready for slots to start executing, but BigQuery can’t get enough available slots to execute them.
Insufficient shuffle quota
Before running your query, BigQuery breaks up your query’s logic into stages. BigQuery slots execute the tasks for each stage. When a slot completes the execution of a stage’s tasks, it stores the intermediate results in shuffle. Subsequent stages in your query read data from shuffle to continue your query’s execution. Insufficient shuffle quota occurs when you have more data that needs to get written to shuffle than you have shuffle capacity.
Data input scale change
Getting this performance insight indicates that your query is reading at least 50% more data for a given input table than the last time you ran the query and hence experiencing query slowness. You can use table change history to see if the size of any of the tables used in the query has recently increased.
What’s next?
We continue to work on improving the visualization of the graph. We are working on adding additional metrics to each step and adding more performance insights that will make query diagnosis significantly easier. We are just getting started.
Blue Apron: Offering a better recipe for modern analytics

1645
Of your peers have already read this article.
5:30 Minutes
The most insightful time you'll spend today!
When Blue Apron had issues running its data warehouse on another cloud provider, it built an analytics platform using Looker and Google BigQuery to enable faster business decisions about food inventory.
Blue Apron’s mission is to make incredible home cooking accessible to everyone. Launched in 2012, Blue Apron is reimagining the way that food is produced, distributed, and consumed.

Google Cloud Results
- Enables near real-time business decisions to better manage food inventory and delivery by reducing query times exponentially
- Helps improve customer service and optimize business processes with faster insights
- Reduces costs while reclaiming up to a week per month of engineering
The popularity of meal kit delivery services has surged in recent years as consumer attitudes toward home cooking and grocery shopping have shifted. As a pioneer in the category, Blue Apron helps its customers create incredible home cooking experiences by sending culinary-driven recipes with high-quality ingredients and step-by-step instructions straight to customers’ doors. Blue Apron also offers a monthly wine subscription service and a la carte culinary tools and products through its marketplace.
If that sounds simple, it isn’t. Ingredients for the meal kits must be sourced at the right time, quality, and price. Orders must be packed efficiently and in exactly the right proportions. Most importantly, meal kits must be delivered to the customer fresh and on time.
To meet these criteria and make data meaningful and intuitive to its managers, one of the tools Blue Apron relies on is Looker, an analytics platform that lets business users explore data and ask sophisticated questions using familiar terms.
A Google Cloud partner and winner of the 2016 Google Cloud Global Partner Award for Solution Innovation, Looker integrates its solution with Google Cloud Platform to help customers modernize their analytics.
Blue Apron previously used Looker with a single database instance hosted on another cloud provider. As data volumes grew and queries became more complex, it became difficult to scale. Blue Apron’s only options were choosing ever-larger server classes and increasing storage throughput by purchasing a higher number of provisioned IOPS. To improve speed, scalability, and cost efficiency, Blue Apron moved its data warehouse to Google BigQuery.
“The combination of Looker and Google BigQuery is powerful, allowing us to get data-hungry analysts essential information much faster,” says Sam Chase, Tech Lead, Data Operations at Blue Apron. “Because we choose to pay by the query, it’s also flexible and cost effective—plus storage is cheap, so we can just put data in and query what we need.”
The analytics platform of the future
When you’re making business decisions about a customer’s dinner, speed matters. Looker takes full advantage of the power of Google BigQuery, making it easy to build a data exploration platform. Blue Apron’s applications publish event data to Kafka—approximately 140 million events per day—and data is then streamed into Google BigQuery, which performs lightning-fast queries on both streamed and static data. Now, business users and analytics teams can make decisions based on near real-time information in Looker, instead of waiting until the next business day for results.
“After we moved to Google BigQuery, query time was reduced exponentially. It’s an astonishing difference, allowing us to run 300 queries per day,” says Sam.
Previously, Blue Apron spent up to a week out of every month optimizing its data warehouse to attempt to improve query performance. With Google BigQuery, all maintenance is handled by Google, reclaiming 25% of up to two engineers’ time. Even when multiple people are using Looker concurrently, query performance never degrades and storage never runs out.
“Because Google BigQuery is architected as a giant, shared cluster, growth is smooth,” says Lloyd Tabb, Founder and CTO of Looker. “Like a race car going from 0 to 120 mph, there are no shift points, just smooth acceleration. To us, it looks like the future.”
An empowering, integrated toolset
Looker takes advantage of aggressive caching and support for date-based table partitioning in Google BigQuery to increase performance, simplify the load process, and improve data manageability. By partitioning data by time, Blue Apron can also take advantage of better long-term storage pricing without sacrificing query performance. When using Google BigQuery with Looker, analysts can easily see how much data is going to be scanned before each query is run.
Blue Apron is also using Looker for Google BigQuery Data Transfer Service to provide actionable analytics for all of the company’s Google marketing data from Google AdWords and DoubleClick by Google in one place to understand campaign performance across channels, saving its data operations team months of work. Using Looker Blocks, marketers can quickly make sense of the data with reports and dashboards, and set alerts when campaign performance hits certain thresholds.
Looker Blocks for Google AdWords and DoubleClick by Google provide all the analysis you’d get straight from the Google console, plus additional value-add analysis that’s impossible to replicate without SQL. Complex metrics such as ROI on ad spend, flexible multi-touch attribution, and predictive lifetime value empower marketers with a better understanding of their customers and where to spend their next dollar.
In addition to these turnkey dashboards and pieces of analysis, marketers can customize views to meet their unique needs and workflows. These capabilities help the Blue Apron marketing team make decisions regarding the allocation of spend to maximize customer acquisition and retention.
“Everyone at Blue Apron is excited about using Google BigQuery with Looker,” says Sam. “Business users and marketers are more empowered to look for answers, instead of waiting for analytics teams. Because users know they can get results rapidly, our business processes are evolving and improving.”
For data cleansing and transformation, Blue Apron uses Google Cloud Dataproc to run fully managed Apache Spark clusters on Google Cloud Platform. It’s also leveraging Google BigQuery integration with Google Workspace to bring data into Google Sheets for further distribution and analysis.
“Transferring data between Google tools is fast because it all happens on the Google network,” says Sam. “We can pull data from Google BigQuery, run transformations with Spark, and then write it back to Google BigQuery. That’s very helpful in providing our business users and data analysts with the richest, most current data.”
A perfect match for better insights
As Blue Apron seeks to expand its reach and deepen its engagement with customers, it is making Google BigQuery and Looker available to more users, providing a high-quality interactive analytics experience. “Our ability to pull a lot of data in and compute fast results affects everyone in our company,” says Sam. “Using Google BigQuery and Looker to iterate quickly and build new models to make our operations more efficient will directly impact our customers.”
For Looker, Google BigQuery represents the next step in data warehouse evolution. “Google BigQuery is a perfect match for Looker, combining easy setup with near infinite scale-out and elasticity,” says Lloyd. “People can make smarter decisions faster that directly benefit their business and customers.”
Data Culture Integral for Building Data Platforms in EdTech Firms

5020
Of your peers have already read this article.
2:00 Minutes
The most insightful time you'll spend today!
With a data strategy and data warehouse in place, EdTechs are building a data culture that helps everyone – from educators and administrators, to employees in marketing and accounting – make more informed decisions with their data.
So how do you build a data culture in your organization? It starts by asking these questions:
- Are users able to find answers to their data questions from available data?
- Can they act based on available metrics?
- Can they tell a compelling story with the data at hand?
How well is your company using analytics? The matrix from Looker’s Analytical Maturity eBook, shows ranges from “vanity” (nice to see) metrics to “optimization.”

Adopting and rolling out your organization’s new data platform
As outlined in the previous blog in this series, From data chaos to data-driven: How dedicated data teams can help EdTechs influence the future of education, a comprehensive data team is essential for building a data warehouse. That data team should include a core education intelligence team. This team can align with analytically savvy members of each department they support. It’s critical that the Education Intelligence team understand each department’s reporting needs and can make adjustments based on user feedback.
Include these key components to ensure smooth adoption for internal teams:
- Share a roadmap: An effective rollout team always knows what’s next on their roadmap and communicates that to the entire organization. Launching analytics across an entire company at once usually leads to slow movement, miscommunication, and lack of adoption. A roadmap will ease this transition.
- Train everyone: This approach makes sure everyone is consistent during the data rollout. Show users how to make the most of the platform your data team has created, and be sure they know where they can go for help.
- Monitor and optimize: Monitor your organization’s analytics usage. Understand which individuals are using your education intelligence system to drive their day-to-day operations. These individuals can provide further insight into what is working. Identifying those who may need more guidance and support ensures they don’t miss out on benefits.
Guild Education: Creating a data culture
Guild Education started working with Google Cloud to build a data culture and implemented Looker as their data platform.
The company transformed their student success program—in which coaches work directly with connected employees throughout their educational journey—with Looker. “As enrollments increased, even spreadsheets were not able to accurately keep track of caseloads,” Sean McKeever, Senior Business Intelligence Analyst, recalls. “We needed a singular source of truth that could be updated in almost real-time.” In response, they created “Student Rosters” to manage a coach’s student outreach.
Users were thrilled with the new tools, and when the coaching team grew from 20 to 90, Sean created ambassador groups consisting of data specialists to support each department. This sparked Guild Education’s “data-driven evolution.”
“Unexpectedly, the Student Success task force also became an engine for new BI work,” Sean says. “They blew my highest expectations out of the water and started owning virtually the entire process: building requirements, prototyping, testing, and deploying new dashboards and panels—with hardly any help from the BI team.”
These successes have set Guild Education on its way to becoming a fully data-driven company. Unexpectedly, the Student Success task force also became an engine for new BI work…they blew my highest expectations out of the water and started owning virtually the entire process…with hardly any help from the BI team.
Sean McKeever
Senior Business Intelligence Analyst, Guild Education
Start your journey from data chaos to data-driven
We hope this three-part series has shown how data analytics has an important role to play in transforming the future of education. EdTech companies are unlocking the power of big data to serve their customers. “The education landscape is changing rapidly, and EdTech has a major role to play as institutions adapt to the massive shift in learners’ preferences and expectations,” says Jesus Trujillo Gomez, Strategic Business Executive, Education & Research, Google Cloud.
Feeling inspired? Let’s meet your EdTech challenges together and transform your data culture. Visit Google Cloud for education technology.
Guide for Measuring Cloud Spanner Performance for Your Custom Workload

4831
Of your peers have already read this article.
3:00 Minutes
The most insightful time you'll spend today!
Database migration to a new database platform or technology can be daunting for various reasons. One of the common concerns is database performance. It is hard to evaluate database performance early in the evaluation cycle without performing actual data migration and application changes. This becomes even more important in the case of Cloud Spanner where modernization is required at both the database and application layers.
The traditional approach to evaluate database performance is to deploy the application and database together, migrate historical data to the new database and then simulate load tests by running an application on the new database. Doing all this for an early performance evaluation of Cloud Spanner may feel like a lot of effort.
In this post, we will explore a middle ground to performance testing using JMeter. Performance test Cloud Spanner for a custom workload before making application code changes and executing data migration. More detailed step-by-step guide is published here.
Goals
- Estimate the number of Cloud Spanner nodes needed (and get a cost estimate).
- Performance test the most frequently used set of queries and transactions.
- Demonstrate the ability to scale horizontally.
- Better understand the optimizations needed for schema and sql queries.
- Determine latency of DML operations.
Limitations
- You cannot test using non-java client libraries.
- It is more complex to test non-jdbc compliant features like mutations, parallel reads etc.
Preparing for performance tests
- Identify top SQL queries, latency, frequency / hour and avg number of rows returned or updated for each. This information will also serve as a baseline for the current system.
- Determine Cloud Spanner region / multi-region deployment. Ideally, load should be generated from the Cloud Spanner instance’s leader region for minimum latency and best performance. Read Demystifying Cloud Spanner multi-region configurations for more details on various configurations of Cloud Spanner.
- Estimate the number of Cloud Spanner nodes required for a given workload based on (step 1). It is recommended to have a minimum of 2 nodes for linear scaling.
Note: Peak performance numbers of regional performance and multi regional performance are published. It is based on a 1KB single row transaction with no secondary indexes. - Request quota for Cloud Spanner nodes on a given region / multi-region. It can take up to 1 business day.
Setting up Cloud Spanner
Creating the schema for Cloud Spanner
You can use the following tools to generate a schema for Cloud Spanner if you are migrating from the following source databases. Alternatively, you can model the schema manually. Schema design has a huge performance impact, hence it is recommended to review the schema very carefully.
| Source | Target | Tool(s) | |
| 1. | MySQL / MariaDB | Cloud Spanner | HarbourBridgeStriim |
| 2. | Postgresql | Cloud Spanner | HarbourBridgeStriim |
| 3. | Oracle | Cloud Spanner | Striim |
| 4. | SQL Server | Cloud Spanner | Striim |
Note: Manual review and tuning of schema will be needed to optimize and mitigate potential hotspots. You will need to keep in mind schema design best practices when modeling your schema.
Populating seed data into Cloud Spanner
Performance of a database depends on the amount of data present. Existing data (and indexes) determines how much data is scanned on select queries and therefore performance. Hence, it is important to seed data into Cloud Spanner before performance testing.
For most realistic results, data should be migrated from an existing production source. Sometimes you cannot do that due to schema changes. One way is to utilize a custom ETL job to export and transform data and then import into Cloud Spanner. Another alternative could be to mock seed data using JMeter(More details in later sections).
JMeter performance tests
Writing Tests
JMeter will interact with Cloud Spanner just like your application. It will perform DML operations the same way as your application does. Hence, tests need to simulate production like transactions. For example if a transaction is made up of insert and/or update statements in several tables within transaction boundaries then JMeter should mimic the same.
JMeter has the following hierarchy:
Test Plan > Thread Group(s) > Sampler(s) (aka test)
Test plan is a top level component. It can contain global properties and libraries (like jdbc driver etc).
Thread Group(s) are representative of a database transaction. It contains one or more sampler(s). All the samplers within a thread group execute serially.
Sampler(s) should represent a single DML call. If your transaction needs to have multiple dml calls, you should create multiple samplers. Typically you will use JDBC Sampler for database calls. You can also use JSR 223 Sampler as described here, in case you need to use mutations or parallel reads etc. Results from one sampler can be passed to the next, as in real world application.
Executing tests and collecting results
JMeter tests should be executed as physically close to Cloud Spanner instances as possible to minimize network latency. Therefore it is best to execute them from Compute Engine (via private service connect) from the same region as the Cloud Spanner instance. In-case of multi region Cloud Spanner, GCE instances should be created in the Leader Region of the Cloud Spanner instance for lowest network latency.
JMeter should be executed via command line, it is a CPU intensive application so make sure you have allocated enough resources on the VM.
Refer to the Cloud Spanner monitoring dashboard to ensure that your Cloud Spanner instance’s CPU utilization is at or below the recommended values. In addition, use introspection tools to investigate performance issues with your database.
You might need to optimize your queries (add indexes) and re-execute tests in multiple waves to tune the performance as needed.
Try it yourself
Follow a detailed step by step tutorial on Measure Cloud Spanner performance test using JMeter to test Cloud Spanner performance yourself.
Qlik and Google Cloud Combo: Extending Integration of SAP Data on BigQuery

5463
Of your peers have already read this article.
2:00 Minutes
The most insightful time you'll spend today!
If your organization is one of the 52% of SAP customers whose top analytics pain point is data integration1, Google Cloud has got you covered. By working with partners like Qlik, we are expanding our integration options and bringing real-time replication capability for SAP to BigQuery.
Integrated data for accelerated insights
BigQuery—our fully managed, enterprise data warehouse that can scale up to petabytes on demand and execute queries in seconds—allows SAP customers to consolidate enterprise data silos and confidently derive more use and value from their data. Customers can accelerate and simplify the delivery of SAP data on BigQuery with the latest Qlik Data Integration platform offering for Google Cloud which allows data integration using an automated, near real-time data pipeline through Qlik Replicate, whether data originates from legacy SAP environments, SAP HANA, or SAP application servers. Additionally, Qlik Compose for Data Warehouses can be used to easily generate and automate logical data models from SAP directly in BigQuery freeing up more time for data analysts to leverage advanced built-in capabilities such as BigQuery ML to derive greater value and insights using standard SQL without the need for advanced programming expertise.
Delivering faster results with real-time
Traditional extract-transform-load (ETL) solutions operate on a batch basis, pulling data sets from SAP daily, hourly, or every minute. These tools often require manual mapping of multiple data fields so that data flows accurately. Given SAP’s highly complex table relationships, in which a single transaction can result in multiple changes, this can be a time consuming and tedious process. ETL can also increase the burden on your SAP systems.
Qlik Replicate simplifies this with its intuitive user interface where you can set up real-time data replication between SAP and BigQuery, eliminating the need for manual coding. And, to prevent system overhead, as soon as a new transaction is entered into SAP, the resulting data is replicated into BigQuery in a process known as change data capture (CDC) from SAP’s log layer. This means that data transfer can benefit from high performance with minimal impact on the source system’s resources. Read our latest white paper to learn how to extract SAP data into BigQuery leveraging Qlik Replicate.
Solution expertise for all core SAP workloads
It doesn’t matter what database your SAP system runs on, Qlik Replicate supports all core SAP systems. It automates real-time data replication and decodes SAP’s complex, application-specific data structures into formats that flow smoothly into BigQuery. This ensures that anyone who depends on data analytics has the most current and relevant SAP data they need. For its robust solution capabilities Qlik has received a new “SAP on Google Cloud Expertise” designation for supporting:
- Fast onboarding and accelerated replication of SAP data into Google Cloud
- Real-time and continuous data replication from SAP applications to BigQuery
- Support for all core SAP modules and a broad set of data sources
- Automated data integration, which cuts resource requirements for initial delivery and ongoing maintenance
Proven customer results
Many SAP customers have experienced the benefits of leveraging Qlik alongside BigQuery for data analytics and AI at scale, including German luxury department store chain Breuninger. In order to meet its customers’ growing and changing expectations,Breuninger needed to accelerate its time to insight from data sources across a highly dispersed landscape of on-premises databases and systems, including SAP. The company uses Qlik Replicate to feed corporate data from modules in its SAP system into BigQuery and integrate its varying on-premises databases with the Google Cloud environment. This has yielded game-changing, real-time customer insights for the retailer.
What could your business do with faster, more integrated insights? Learn more about BigQuery for SAP customers and also how Qlik and Google Cloud can help you modernize and automate data integration and analytics.
No More ‘Tab Game’ with Easy Tutorials on Google Cloud Console

3528
Of your peers have already read this article.
2:00 Minutes
The most insightful time you'll spend today!
When it comes to learning how to implement some technology, we all have our own version of what I call the “tab game”—that is, your setup for all the tabs and windows you need open at once. You may have several monitors so you can see documentation, your IDE, and terminal windows at the same time. You may have several guides and references open at once in one window to get all the information you need.

Personally, I like to work just from my laptop because I like to move around and work from various comfy spots. I think my tab game would probably enrage most devs because it involves a lot of swiping back and forth between windows *and* toggling tabs. It’s not pretty. That is, it wasn’t pretty until I discovered tutorials in the Google Cloud Console!
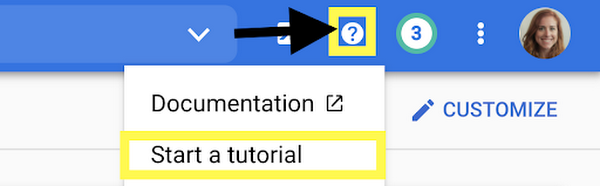
Jen really didn’t know about tutorials in the Google Cloud Console?
Yes, I honestly didn’t know about them! I’m sharing about it because if I can work for Google and not know, then I can’t be the only one, and it would be a shame to miss out on this because it’s a brilliant idea. Also I wrote some pretty sweet tutorials for the console, but I swear that the main reason I’m telling you is because it’s a cool thing!
There are several reasons that these tutorials are great:
- You can view the instructions and the console at the same time. No more playing the tab game!
- The tutorials include links and highlights, making it easy to find the screens and buttons you’re looking for
- You can run code from Cloud Shell, so you don’t need a separate window for an IDE
- You can use the demo data provided to try things out, or you can apply the steps to your existing projects using data that suits your app’s needs
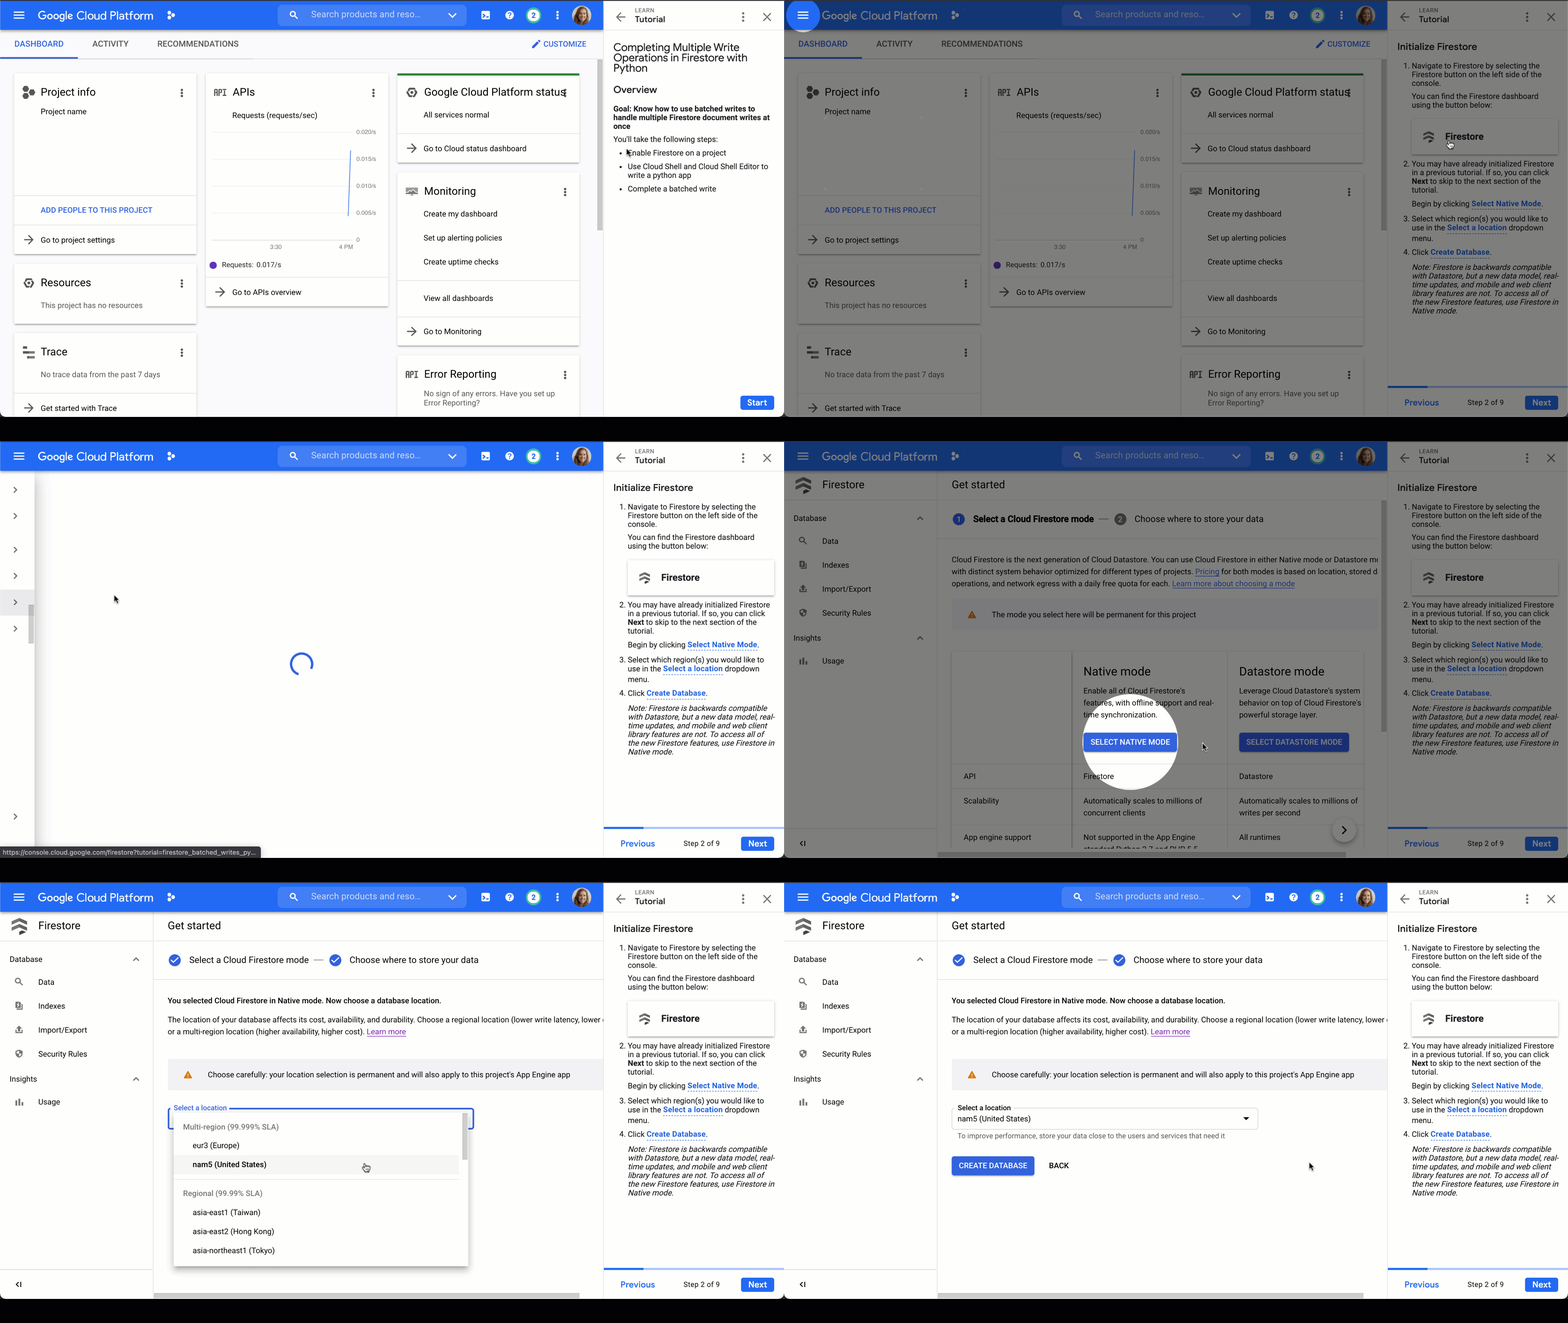
Firestore tutorials
I’m developing a series of tutorials in the Google Cloud Console designed to take you through everything you need to know about Firestore–from manually adding data in the Google Cloud Console to triggering Cloud Functions to make changes for you. Below are links and summaries for the currently available tutorials. Check back regularly to find the latest additions as they’re released!
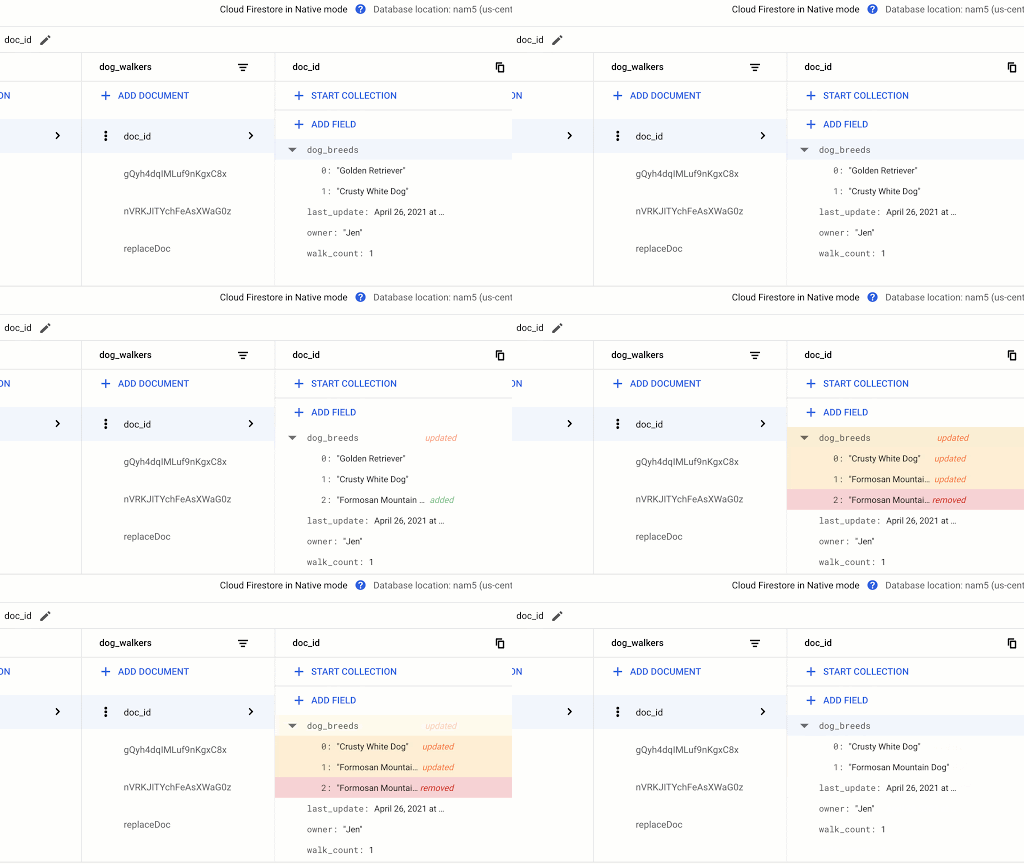
- Enable Firestore on a project
- Learn about the Firestore data model
- Add a collection of documents
- Add fields to a document
- Delete documents and collections
Updating Data in Firestore using Node.js or using Python
- Add a collection of documents
- Explore available data types
- Replace the data of document
- Replace fields in a document
- Handle special cases: incrementing, timestamps, and arrays
Reading Data from Firestore using Node.js or using Python
- Add a collection of documents
- Explore available data types
- Read a collection
- Read a single document
- Order documents
- Query documents
Transactions in Firestore using Node.js
- Add a collection of documents
- Update data without a transaction to observe issue
- Complete a transaction
- Complete a batched write
Batched Writes in Firestore using Node.js or using Python
- Use Cloud Shell and Cloud Shell Editor to write a Node.js or Python app
- Complete a batched write
Firestore triggers for Cloud Functions
- Initialize Cloud Functions using the Firebase CLI
- Write a Cloud Function triggered by a new document write to Firestore
- Add data to Firestore in the Cloud console Firestore dashboard
- Create a web app that uses Firestore using the Firebase SDK
- Deploy Firestore security rules that enable access to the required data
- Enable data persistence in the web app
- Observe app behavior with and without network connection
Chime in
Is there a particular action or concept in Firestore that you’d like to see a tutorial for? Is there another Google Cloud product that you want to learn more about? Tweet @ThatJenPerson and you may just see your suggestion come to life in the Google Cloud Console!
More Relevant Stories for Your Company

“It’s an Astonishing Difference”: What Data Operation Execs say About Google Cloud’s Data Warehouse
The popularity of meal kit delivery services has surged in recent years as consumer attitudes toward home cooking and grocery shopping have shifted. As a pioneer in the category, Blue Apron helps its customers create incredible home cooking experiences by sending culinary-driven recipes with high-quality ingredients and step-by-step instructions straight to customers’

New to Cloud Firestore? Here are Some Basics You Need to Know
Learning to use a new database can be daunting, even more so if you don’t already have technical knowledge about databases. In this article, I will break down some database basics, terms you should know, what Firestore is, how it works, how it stores data, and how to get started

Unification of Dataplex and Data Catalog: A Full Spectrum of Data Governance and Data Management at Scale
Today, we are excited to announce that Google Cloud Data Catalog will be unified with Dataplex into a single user interface. With this unification, customers have a unified experience to search and discover their data, enrich it with relevant business information, organize it by logical data domains, and centrally govern

Lending DocAI Shortens Borrowers’ Journey on Roostify
The home lending journey entails processing an immense number of documents daily from hundreds of thousands of borrowers. Currently, home lending document processing relies on some outdated digital models and a high dependency on manual labor, resulting in slow processing times and higher origination costs. Scaling a business that sorts
