





3 Ways To Reduce App Downtime With Google Cloud’s API Monitoring Tools

3076
Of your peers have already read this article.
2:30 Minutes
The most insightful time you'll spend today!
How many times have you closed an application when you encounter the “spinning wheel of death” (a melodramatic way of saying an application that is taking too long to load)? In today’s digital economy where many organizations rely on applications as a primary source of revenue, that spinning wheel of death (or poor application performance) can mean lost users or revenue. And just about every modern application relies on APIs as the nervous system across distributed systems, third-party services and microservice architectures. While meeting the need for rapid release cycles and frequent API updates, it is also imperative for IT teams to ensure that your APIs are meeting SLOs, performance requirements, and proactively mitigating issues.
Why are synthetic monitoring tools not enough?
When thousands or even millions of users are making multiple requests to your APIs, just relying on synthetic monitoring tools (that rely on sampling or limited API availability information) is not enough for precision diagnoses or useful forensics. At the same time, monitoring every single aspect just increases your overhead and mean time to diagnosis. Apropos, API monitoring has become absolutely critical — and a fusion of art and science — for operations teams to make sure all APIs are running and performing as intended. If you are worried about monitoring blind spots or overheads, let us look at 3 key practices you can follow to stop dreading your sev1 alerts.
#1 Prioritize alerts for critical events requiring immediate investigation
- Ask any engineer on-call for a critical service and they will tell you about the overheads created by incorrectly prioritized alerts. For example let us imagine a distributed application with 20 APIs. Even if you set up basic alert monitors across latency, error, and traffic for these APIs, you end up monitoring and maintaining 60 alert definitions – which is a lot. To balance avoiding monitoring blindspots and alert fatigue at the same time, operations teams must develop a clear understanding of all events and prioritize configuring alerts for events supporting critical traffic.
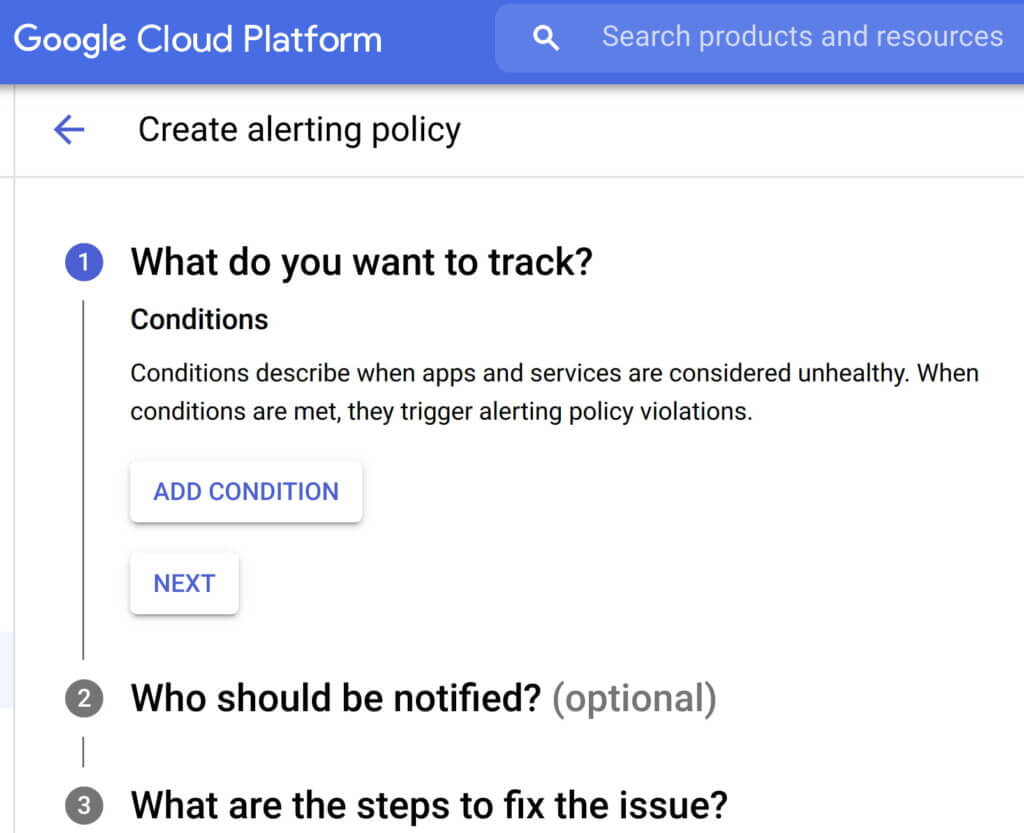
- Consider quality over quantity while defining new alert conditions where each new condition is urgent, actionable, and actively or imminently user-visible. Every alert condition created should also contain intelligence that requires active engagement from a user as opposed to a mere robotic response. Apigee’s API monitoring allows creation of alert conditions based on metrics or logs while providing actionable information (Ex: status code, rate etc.,) and playbooks for diagnosi
- In today’s multilayered systems, one team’s symptom (“what’s broken?”) is another downstream system’s cause (“Why?”). Even if some events are not suitable for actionable alerts, a failure needs to create an informational broadcast to a downstream system to mitigate the impact of the upstream dependency. In such cases, investing in automating alerts, grouping multiple incidents in notification channels, and incident tracking. For example, Apigee lets you integrate and group your alert notifications in channels like Slack, Pagerduty, webhooks etc.,
- Modern production systems are ever-evolving where an alert that’s currently rare might become frequent and automatable. Analogous to ticket backlog grooming, alert policies need to be reviewed periodically to make sure new conditions are identified and existing alerts are refined with new thresholds, prioritization and correlation. Controls like Advanced API Ops leverage AI and ML to detect anomalous traffic differentiated from random fluctuations to help define accurate alert definitions
Check out some examples of alerts here
#2 Isolate problem areas quickly with dashboards
Google’s Site Reliability Engineering book presents the case for efficient diagnosis by building dashboards that answer basic questions about every service, normally including some form of the four golden signals — latency, traffic, errors and saturation. But at the same time, capturing just these golden metrics at different levels of granularity can quickly add up. Like all software systems, monitoring can become an endless pit of complexity, complicated to change and a burden to maintain. In the same book, the most effective direction to create a well-functioning standalone system is to collect and aggregate basic metrics, paired with alerting and dashboards.
If you are running a large scale API program with a dedicated team to monitor your APIs, you can leverage the out-of-the-box monitoring dashboards in your API Management solution (like Apigee’s API monitoring) to gather real-time insights into your API performance, availability, latency, and errors. In other cases, you can use solutions like Cloud Monitoring that can provide visibility across your full application stack where individual metrics, events, and metadata can be visualized in a rich query language for rapid analysis. Leveraging a single system for your application stack provides observability in context and can reduce your time spent navigating between systems (Apigee customers can use Cloud Monitoring by default or integrate with other systems using Cloud Monitoring API)
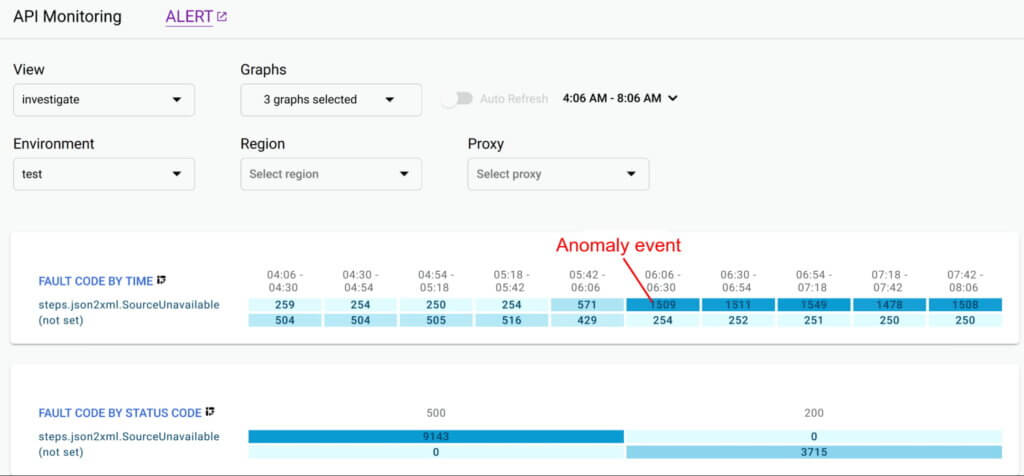
Even after you collect and aggregate the metrics, it is important to have impactful data visualizations to quickly understand the issue and identify correlations during diagnosis. In data visualizations as well, focusing on too many dashboards creates a steep learning curve and increases mean time for every diagnosis. For example, Apigee API Monitoring provides the following visualizations as a standard to balance simplicity and efficiency:
- Timeline view to diagnose traffic (in 1 min intervals), error rates (4xx and 5xx across traffic) and latencies (50th, 90th, 95th and 99th percentiles)
- Pivot tables of metrics and attributes for all API traffic, to help compare activity across different metrics
- Treemaps of recent API traffic by proxy to get a snapshot of incidents, error rates and latencies
#3 Incorporate distributed tracing into your end to end observability strategy
Modern application development accelerated the adoption of technologies and practices like cloud, containers, APIs, microservice architectures, DevOps, SRE etc. While this increases release velocity, it also introduces complexity and more points of failure in an application stack. For example, a slow response to a customer request spans across multiple micro services owned (and monitored) by various teams who might not observe any individual performance issues. Without an end-to-end contextual view of a request, it is nearly impossible to isolate the point of high latency.
In such cases, distributed tracing is the best way for DevOps, Operations and SREs to get answers to questions such as service health, root cause of defects, or performance bottlenecks in a distributed system. Organizations should invest in instrumenting their distributed applications using open source standards such as OpenCensus and Zipkin. Using tools like Cloud Trace with a broad platform, language and environment support can help easily ingest data from any source — open instrumentation or proprietary agents.
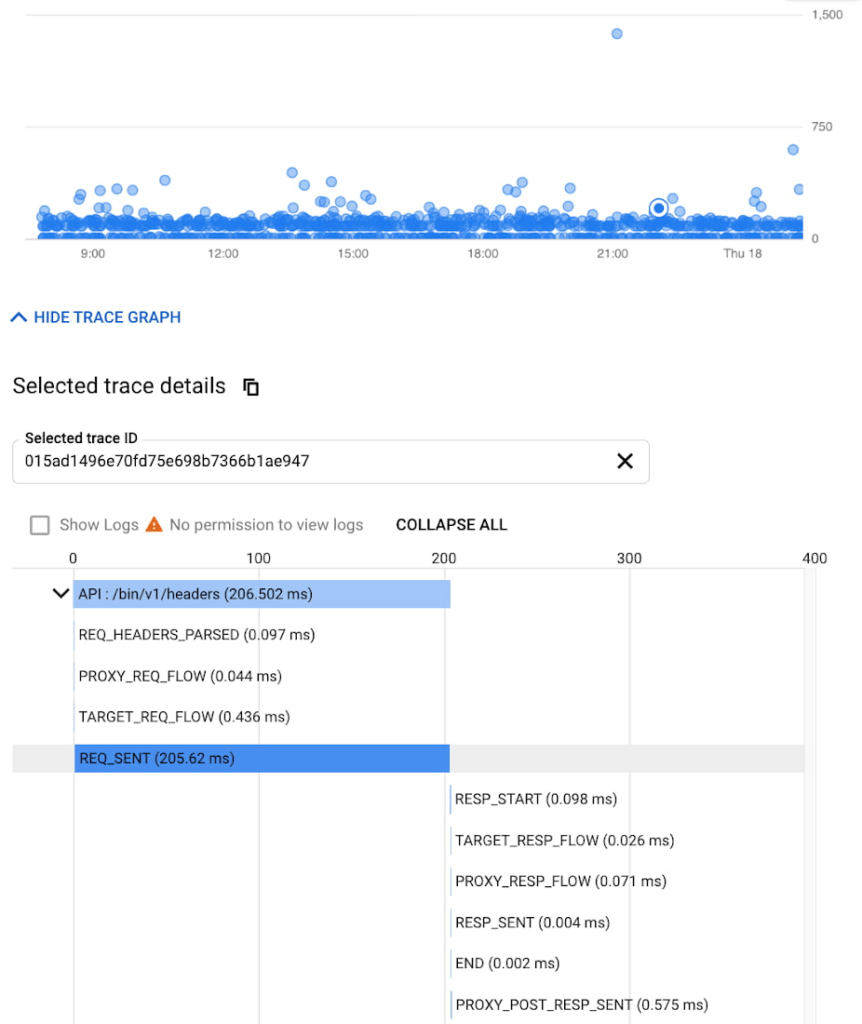
While distributed tracing helps in narrowing the issue to a given service, in some cases you might need further context to pinpoint the root cause. For example: Even if you have isolated the source of a performance issue to an API proxy, it is still a tedious process to identify the right bottleneck among multiple policies being executed. Tools like Apigee Debug enable you to zoom into an API proxy flow and probe the details of each step to see internal details like policy executions, performance issues, and routing etc.,
As soon as a request starts to span across a handful of microservices, tools like distributed tracing and Debug will become crucial elements of your monitoring strategy. When every service in a distributed system emits a trace, the amount of data can quickly become overwhelming leading to the classic “needle in the haystack” problem. In such scenarios, it becomes vital to ask the right questions and choose between head-based sampling (randomly selecting which traces will be sampled for analysis) and tail-based sampling (observe all trace information and sample the traces with unusual latency or errors) based on application complexity
Implement effective API monitoring in Apigee
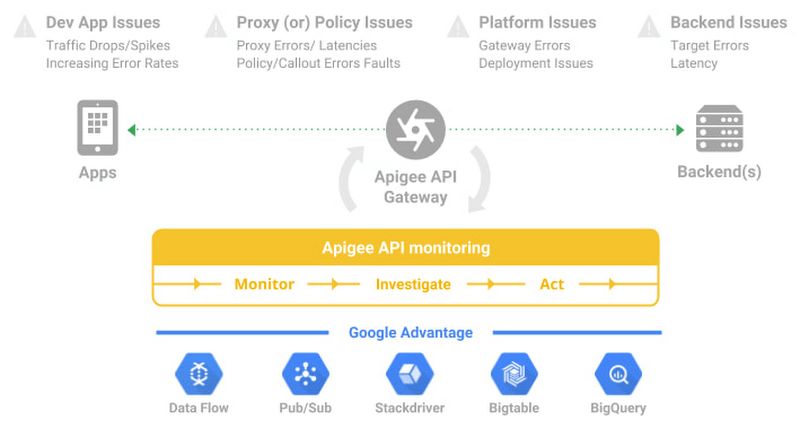
Apigee’s API monitoring (based on metrics exposed by the internals of the system) capabilities work with your existing monitoring infrastructure to help reduce mean time to diagnosis and increase application resiliency. Specifically, operations teams can leverage
- Monitoring dashboards to gain in-depth insights into API availability and performance metrics.
- Debug to precisely diagnose with deeper insights into an API proxy flow without toggling multiple tools.
- Alerts and notifications to gather contextual Insights, facilitate customization, and grouping with first class integrations to various tools (like Slack, PagerDuty, email and support for webhooks).
- Best of Google technologies such as Data Flow, Pub/Sub, Stackdriver, Bigtable and BigQuery to handle massive volumes and complex metrics at scale
Using Apigee’s API monitoring will help you maintain high application resiliency with comprehensive controls to reduce mean time to diagnosis and resolution. Get started with Apigee today or explore Apigee’s API monitoring for free here. Check out our documentation for additional information on API monitoring.
Want to Code for the Cloud? Get Started with the Native App Development Track

6732
Of your peers have already read this article.
2:00 Minutes
The most insightful time you'll spend today!
Earlier this year, we launched the Google Cloud skills challenge, which provides 30 days of free access to training to build your cloud knowledge and an opportunity to earn skill badges that showcase your Google Cloud competencies. Today, we’re adding a Native App Development track to the skills challenge, joining the Getting Started, Data Analytics, Kubernetes, Machine Learning (ML) and Artificial Intelligence (AI) tracks.
The Native App Development track is designed for cloud developers who want to learn to build serverless web apps and Google Assistant applications on Google Cloud using Cloud Run and Firebase. Specifically, you’ll have an opportunity to earn three skill badges in the Native App Dev track: Serverless Firebase Development, Serverless Cloud Run Development, and Build Interactive Apps with Google Assistant. To earn a skill badge, you complete a series of hands-on labs and take a final assessment challenge lab to test your skills.
Here’s an overview of each badge.
Serverless Firebase Development
To earn this skill badge, you’ll learn how to build serverless web apps, import data into a serverless database, and build Google Assistant applications using Firebase, Google’s backend-as-service platform for creating mobile and web applications.
Serverless Cloud Run Development
For this badge, you’ll discover how to use Cloud Run, a fully managed serverless platform, to connect and leverage data stored in Cloud Storage. You’ll learn how to use Cloud Run to build a resilient, asynchronous system with Pub/Sub, build a REST API gateway as well as build and expose services.
Build Interactive Apps with Google Assistant
To earn the final skills badge, you’ll build Google Assistant applications by creating a project in the Actions console, integrating Dialogflow, testing your action in the Actions simulator, and adding Cloud Translation API to your assistant application.
Ready to jump into the skills challenge? Sign up here.
You can also check out this quick video below to learn how to join the skills challenge.
3782
Of your peers have already watched this video.
8:00 Minutes
The most insightful time you'll spend today!
Target Leverages Google Cloud to Create Market-defining Online Experience
In the hyper-competitive world of online retail sales, ease-of-use and transaction speed can make or break business outcomes. However, a few years ago US Retail giant Target was going through a period of uncertainty.
While the company had over 1800 stores across the US with an estimated 85% of US consumers shopping at a Target store and over 25 million people visiting the Target website or using its app each month, it was still losing ground.
In spite of having millions of loyal customers, the company was dangerously late on digital and its technology wasn’t keeping pace with unstable systems to boot. The company faced the twin challenges of trying to operate today’s business as efficiently as possible and creating tomorrow’s business as quickly as possible. On the one hand it needed productivity and stability and on the other it wanted speed and disruption. Not an easy task to accomplish.
That’s when Target decided to use Google Cloud to solve its challenges. See how Target leveraged Google Cloud to create a market-defining online experience that has made customers happier and more loyal.
How Ather Energy is leveraging the Cloud to build and scale smart mobility solutions for India

8363
Of your peers have already read this article.
8:30 Minutes
The most insightful time you'll spend today!
In 2013, long before the world was discussing clean energy and sustainable practices, two IIT Madras graduates — Swapnil Jain and Tarun Mehta — had an idea to develop India’s first-ever electrical scooter.
This was at a time when auto manufacturers were still focusing on fossil-fuel-driven vehicles and ‘eco-friendly’ mobility solutions were more a trendy alternative catering to a niche market.
The duo founded Ather Energy in 2013 and launched their first fully-electric scooter, the Ather S340, in Bengaluru in 2016. Since then, the company has released several new models into the market and is planning to expand to eight more cities by the end of the year.
To support the smooth running of their vehicles, lower costs, improve time to market, and create great customer experience, Ather turned to Google Cloud.
Read the Full Story on YourStory
Khan Academy’s Shortcut to Growth: The Trick Behind the Scenes

3582
Of your peers have already read this article.
4:15 Minutes
The most insightful time you'll spend today!
Based in Mountain View, California, Khan Academy is a not-for-profit that produces and posts a vast collection of free educational online videos about math and science topics ranging from algebra and trigonometry to biology and economics.
Millions of students, educators, and self-learners around the world watch the videos, both on the Khan Academy’s YouTube channel and on its hugely popular website (www.khanacademy.org), where students answer some 1.5 million practice questions per school day. The Khan Academy development team continually tweaks the site based on how visitors choose to learn.
Challenge
Khan Academy’s beginnings date back to 2004, when Sal Khan’s cousin asked him to remotely tutor her daughter in math. Khan was happy to help and more than qualified, given his three MIT degrees and his Harvard MBA.
As more relatives and friends asked Khan for tutoring assistance, he began videotaping short lessons and posting them to YouTube. His knack for distilling complex concepts into easy-to-follow tutorials helped the videos go viral.
Sal knew he needed to offload the technical and maintenance concerns so he could work on what was important. To grow, it was important for him to be able to stop worrying about things like deployment issues and running his own server.
Ben Kamens, lead developer for Khan Academy
Khan maintained a website for his growing video library for several years, but the platform experienced limitations as traffic increased.
At the same time, media attention was growing, and technology industry leaders, including Microsoft founder Bill Gates and Silicon Valley venture capitalist John Doerr, began lending their support and evangelizing Khan’s mission and work. It was at this point that Khan quit his job as a hedge fund analyst to devote his full-time attention to the site’s growing potential.
“With Google App Engine, we don’t need a system administrator or anyone dedicated to deploying our app, so 99 percent of our time is spent working on our application,” says Ben Kamens, lead developer, Khan Academy.
“Sal knew he needed to offload the technical and maintenance concerns so he could work on what was important, which was to make more videos for the Khan Academy library,” explains Ben Kamens, lead developer for Khan Academy. “To grow, it was important for him to be able to stop worrying about things like deployment issues and running his own server.”
Solution
Khan Academy chose App Engine as its hosting and application development platform because App Engine could easily house its growing collection of 2,000-plus videos, resolving the organization’s overall server and maintenance issues with a single solution.
Using App Engine freed the team to focus on the user experience and the array of content that makes the academy such a powerhouse.
“A lot of what the Khan Academy is about is collecting data on student behavior so we can teach them better,” Kamens says. “Did they use a hint? Have they watched the video before? That data is being stored on Google App Engine so we can figure out what the most effective videos are, or where students struggle the most.”
Khan Academy provides individual profiles to students so they can analyze their learning progress, which means the organization needs systems running in the background to collect and track of all this data. Because App Engine takes care of server support, Khan Academy’s five developers can spend almost all of their time improving site functionality.
“If we didn’t have Google App Engine, we’d be spending a lot more time figuring out server setup and working on routers,” Kamens says. “Our ability to focus on the actual product is the benefit of Google App Engine.”
With the App Engine dashboard, which provides information like response time, uptime, and error rates, the development team also has an easy way to watch over site performance. “It lets us see what the average response time is, so we can keep it really low,” Kamens explains.
Results
During the US school year, Khan Academy receives more than 3.8 million unique visits a month — all served through App Engine. To support this much traffic, a typical company would need an internal system administration staff.
“With Google App Engine, we don’t need a system administrator or anyone dedicated to deploying our app, so 99 percent of our time is spent working on our application,” explains Kamens. “Our application lives on Google App Engine, and we bank all of our scalability and traffic concerns on Google App Engine. Even huge traffic spikes from Sal’s media appearances don’t worry us since we know that Google App Engine will handle the spike.”
Kamens also likes the fact that he and his team can turn to the Google App Engine support team for assistance when they need it. He also finds helpful tips on the Google App Engine blog.
The Khan Academy staff has come to completely rely on App Engine. “We are constantly using more of Google App Engine’s capabilities and have been happy with the performance,” Kamens says. “It’s nice to have an easy deployment process since we deploy the site on average at least once a day, [and] sometimes up to nine or 10 times [a day].”
Wunderkind Leverages Google Cloud to Address the Growing Needs of its Customer Base

5326
Of your peers have already read this article.
1:30 Minutes
The most insightful time you'll spend today!
Editor’s note: We’re hearing here how martech provider Wunderkind easily met the scaling demands of their growing customer base on multiple use cases with Cloud Bigtable and other Google Cloud data solutions.
Wunderkind is a performance marketing channel and we mostly have two kinds of customers: online retailers, and publishers like Gizmodo Media Group, Reader’s Digest, The New York Post and more. We help retailers boost their e-commerce revenue through real-time messaging solutions designed for email, SMS, onsite, and advertising. Brands want to provide a one-to-one experience to more of their customers, and we use our extensive history with best practices in email marketing and technology to help brands reach more customers through targeted messaging and personalized shopping experiences. With publishers, it’s a different value proposition, we use the same platform to provide a non disruptive and personalized ad experience for their website. For example, if you are on their site and then you left, we might show an ad tailored to you when you come back later – depending on the campaign.
After running into limitations with our legacy database system, we turned to Cloud Bigtable and Google Cloud, which helped us be more flexible and easily scale for high traffic demand – which can be a stable 40,000 requests per second, and meet the needs of our growing number of data use cases.
Three different databases power our core product
In our core offering, companies send us user events from their websites. We store these events and later decide (using our secret sauce) if and how to reach out to those users on behalf of our customers. Because many of our customers are retailers, Black Friday and Cyber Monday are big traffic days for us as. On such days, we can get 31 billion events, sometimes as many as 200K events per second. We show 1.6 billion impressions that have seen close to 1 billion pageviews. And at the end of all this, we securely send about 100 million emails. We noticed the same thing for election time; traffic reached the same high volume. We need scalable solutions to support this level of traffic as well as the elasticity to let us pay only for what we use, and that’s where Google Cloud comes in.
So how does this work? Our externally facing APIs, which are running on Google Kubernetes Engine, receive those user events—up to hundreds of thousand per second. All the components in our architecture need to be able to handle this demand. So from our APIs, those events go to Pub/Sub, Dataflow and from there they are written to Bigtable and BigQuery, Google Cloud’s serverless, and highly scalable data warehouse. This business user activity data underpins almost all our products. Events can be things like product views or additions to shopping carts. When we store this data in Bigtable, we use a combination of email address and the customer ID as the Bigtable key and we record the event details in that record.
What do we do with this information next? It’s important to mention that we also mark the last time we received an event about a user in Memorystore for Redis, Google Cloud’s fully managed Redis service. This is important because we have another service that is periodically checking Memorystore for users that have not been active for a campaign-specific period of time (it can be 30 minutes, for example), then deciding whether to reach out to them.
How we decide when we reach out is an intelligent part of our product offering, based on the channel, message, product, etc. When we do reach out, we use Memorystore for Redis as a rate limiter or token bucket. In order not to overwhelm the email or texting providers we send API requests to, we throttle those requests using Memorystore. (We prefer to preemptively throttle the outgoing API requests as opposed to handling errors later.)
When we do reach out, often we will need details for a specific product—let’s say if the website belongs to a retailer. We usually get that information from the retailer through various channels and we store product information in Cloud SQL for MySQL. We pull that information when we need to send an email with product information, and we use Memorystore for Redis to cache that information, since many of the products are repeatedly called. Our Cloud SQL instance has 16 vCPUs, 60GBs of memory and 0.5TB of disk space and when we perform those product information updates, we have about a thousand write transactions per second. We are also in the process of migrating some tables from a self managed MySQL instance, and we keep those tables synchronized with Cloud SQL using Datastream.
Our user history database was originally stored in AWS DynamoDB, but we were running into problems with how they structured the data, and we’d often get hot shards but with no way to determine how or why. That led to our decision to migrate to Bigtable. We set up the migration first by writing the data to two locations from Pub/Sub, performed some backfill of data until that was up and running, and then started working on the reading. We performed this over a few short months, then switched everything to Bigtable.
So, as mentioned, we are using Bigtable for multiple databases. The instance that stores our user events has about 30 TB with about 50 nodes.
Profile management
A second use case for Bigtable is for user profile management, where we track, for example, user attributes based on subscription activity, whether they’ve opted in or out of various lists, and where we apply list-specific rules that determine which targeted emails we send out to users.
Our very own URL shortener
Our third use case for Bigtable is our URL shortener. When our customers build out campaigns and choose a URL, we append tracking information to the query string of the URLs and they become long. Many times, we are sending them via SMS texts, so the URLs need to be short. We originally used an external solution, but made the determination that they couldn’t support our future demands. Our calls tend to be very bursty in nature, and we needed to plan for a future state of supporting higher throughput. We use a separate table in Bigtable for this shortened URL. We generate the short slug that is 62 bit-encoded and use it as the rowkey. We use the long slug as a Protobuf-encoded data structure in one of the row cells and we also have a cell for counting how many times it was used. We use Bigtable’s atomic increment to increase that counter to track how many times the short slug was used.
When the user receives a text message on their phone, they click the short URL, which goes through to us, and we expand it to the long slug (from Bigtable) and redirect them to the appropriate site location. Obviously, for the URL shortener use case, we need to make the conversion very quickly. Bigtable’s low latency helps us meet that demand and we can scale it up to meet higher throughput demands.
Meeting the future with Google Cloud
Our business has grown considerably, and as we keep signing up new clients, we need to scale up accordingly, and Bigtable has met our scaling demands easily. With Bigtable and other Google Cloud products powering our data architecture, we’ve met the demand of incredibly high traffic days in the last year, including Black Friday and Cyber Monday. Traffic for these events went much higher than expected, and Bigtable was there, helping us easily scale on demand.
We are working on leveraging a more cloud native approach and using Google Cloud managed services like GKE, Dataflow, pub/sub, Cloud SQL , Memorystore, BigQuery and more. Google has those 1st party products and we don’t see the value in rolling out or self managing such solutions ourselves..
Thanks to Google Cloud, we now have reliable and flexible data solutions that will help us meet the needs of our growing customer base, and delight their users with fast, responsive, personalized shopping messaging and experiences.
Learn more about Wunderkind and Cloud Bigtable. Or check out our recent blog exploring the differences between Bigtable and BigQuery.
More Relevant Stories for Your Company

Dataflow Guarantees 50+% Increase in Developer Productivity and Infrastructure Cost Savings: Read More
In our conversations with technology leaders about data-driven transformation using Google Data Cloud - industry’s leading unified data and AI solution - , one important topic is incorporating continuous intelligence to move from answering questions such as “What has happened? to questions like “What is happening?” and “What might happen?”.

Optimizing Cloud Load Balancing in Hybrid and Multicloud Architectures
Today’s enterprise applications are often assembled across distributed environments. This includes the integration of services across multi-cloud, multi-SaaS and on-premises environments. While the approach has the advantage of enabling enterprises to choose the best service available to support their applications, it adds the complexity of delivering services across heterogeneous environments.




Accelerate App Development and Delivery: The Modern Way
Cloud-native, Kubernetes, Serverless have been the hottest and most widely discussed topics given the velocity and agility benefits. Learn more about how you can leverage these modern app development practices to ship software faster, while reducing costs and improving security and compliance. Learn how Google Cloud lets you modernize existing

Cardinal Health Leads the Way in Healthcare App Modernization
Apps play a critical role in an ever-expanding range of healthcare services, as patients and providers increasingly expect streamlined, engaging digital experiences. This means that IT must become faster, more agile, and free from the constraints of everyday infrastructure management. At Cardinal Health, we are continuously enhancing our technology to
