





Latest News: Secure Digital Infrastructure Services with Apigee Advanced API Security for Google Cloud

4468
Of your peers have already read this article.
3:30 Minutes
The most insightful time you'll spend today!
Organizations in every region and industry are developing APIs to enable easier and more standardized delivery of services and data for digital experiences. This increasing shift to digital experiences has grown API usage and traffic volumes. However, as malicious API attacks also have grown, API security has become an important battleground over business risk.
To help customers more easily address their growing API security needs, Google Cloud is announcing today the Preview of Advanced API Security, a comprehensive set of API security capabilities built on Apigee, our API management platform. Advanced API Security enables organizations to more easily detect security threats. Here’s a closer look at the two key functionality included in this launch: identifying API misconfigurations and detecting bots.
Identify API misconfigurations
Misconfigured APIs are one of the leading reasons for API security incidents. In 2017, Gartner® predicted that by 2022 API abuses will be the most frequent attack vector resulting in data breaches for enterprise web applications. Today, our customers tell us application API security is one of their top concerns, which is supported by an independent study from 2021 by Fugue and Sonatype. The report found that misconfigurations are the number one cause of data breaches, and that “too many cloud APIs and interfaces to adequately govern” are frequently the main point of attack in cyberattacks.
While identifying and resolving API misconfigurations is a top priority for many organizations, the configuration management process can be time consuming and require considerable resources.
Advanced API Security can make it easier for API teams to identify API proxies that do not conform to security standards. To help identify APIs that are misconfigured or experiencing abuse, Advanced API Security regularly assesses managed APIs and provides API teams with a recommended action when configuration issues are detected.
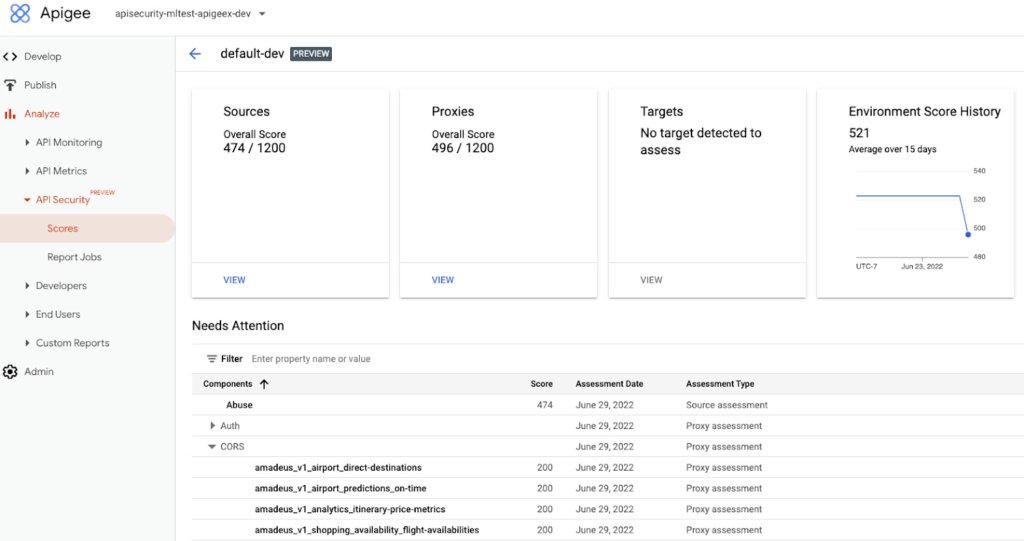
Advanced API Security identifies misconfigured API proxies, including the missing CORS policy.
APIs form an integral part of the digital connective tissue that make modern medicine run smoothly for patients and healthcare staff. One common healthcare API use case occurs when a healthcare organization inputs a patient’s medical coverage information into a system that works with insurance companies. Almost instantly, that system determines the patient’s coverage for a specific medication or procedure, a process which is enabled by APIs. Because of the often-sensitive personal healthcare data being transmitted, it is important that the required authentication and authorization policies are implemented so that only authorized users, such as an insurance company, can access the API.
Advanced API Security can detect if those required policies have not been applied, an alert which can help reduce the surface area of API security risks. By leveraging Advanced API Security, API teams at healthcare organizations can more easily detect misconfiguration issues and can reduce security risks to sensitive information.
Detect Bots
Because of the increasing volume of API traffic, there is also an increase in cybercrime in the form of API bot attacks—the automated software programs deployed over the Internet for malicious purposes like identity theft.
Advanced API Security uses pre-configured rules to help provide API teams an easier way to identify malicious bots within API traffic. Each rule represents a different type of unusual traffic from a single IP address. If an API traffic pattern meets any of the rules, Advanced API Security reports it as a bot.
Additionally, Advanced API Security can speed up the process of identifying data breaches by identifying bots that successfully resulted in the HTTP 200 OK success status response code.
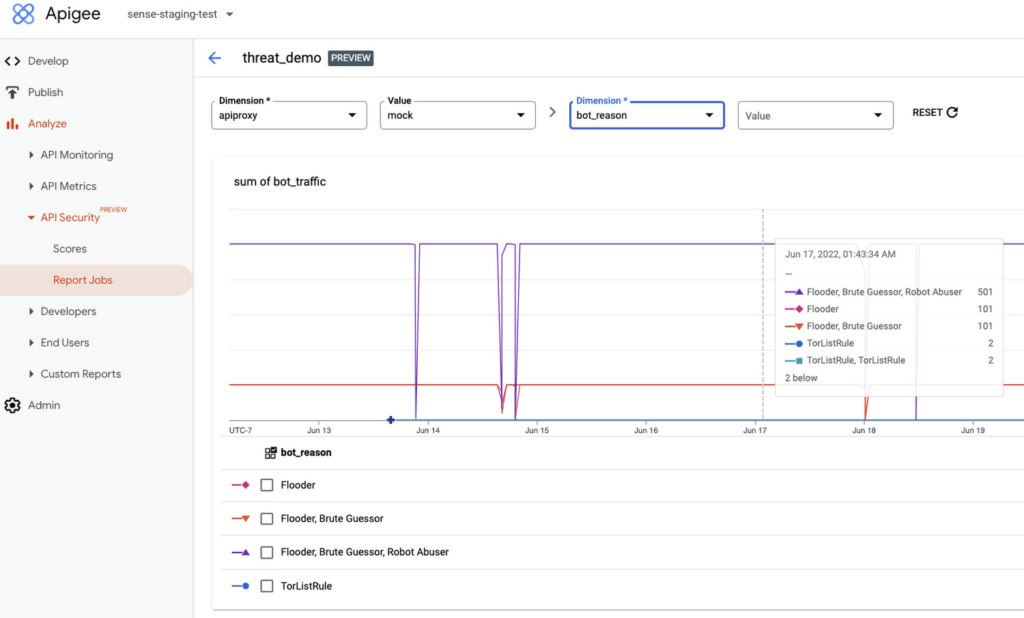
Financial services APIs are frequently the target of malicious bot attacks due to the high-value data that is processed. A bank that has adopted open banking standards by making APIs accessible to customers and partners can use Advanced API Security to make it easier to analyze traffic patterns and identify the sources of malicious traffic. You may experience this when your bank allows you to access your data with a third-party application. While a malicious hacker could try to use a bot to access this information, Advanced API Security can help the bank’s API team to identify and stop malicious bot activity in API traffic.
API Security at Equinix
Equinix powers the world’s digital leaders, bringing together and interconnecting infrastructure to fast-track digital advantage. Operating a global network of more than 240 data centers with a 99.999% or greater uptime, Equinix simplifies global interconnections for organizations, saving customers time and effort with the Apigee API management platform.
“A key enabler of our success is Google’s Apigee, delivering digital infrastructure services securely and quickly to our customers and partners,” said Yun Freund, senior vice president of Platform at Equinix. “Security is a key pillar to our API-first strategy and Apigee has been instrumental in enabling our customers to securely bridge the connections they need for their businesses to easily identify potential security risks and mitigate threats in a timely fashion. As our API traffic has grown, so has the amount of time and effort required to secure our APIs. Having a bundled solution in one managed platform gives us a differentiated high-performing solution.”
Getting started
To learn more, check out the documentation or contact us to request access to get started with Advanced API Security.
To learn more about API security best practices, please register to attend our Cloud OnAir webcast on Thursday, July 28th, 2:00 pm PT.
GKE Feature Guide: 5 Ways to Optimize Your Kubernetes Clusters

1569
Of your peers have already read this article.
7:00 Minutes
The most insightful time you'll spend today!
In this post, we’ll be discussing 5 features in GKE you can use to optimize your clusters today. To get started with testing these in GKE, check out our interactive tutorials for getting started with standard and autopilot clusters.
If you find value from running workloads on Kubernetes clusters in your organization, chances are your footprint will grow – be it through larger clusters or more clusters.
Whichever your approach, one thing is certain: you’ll have more resources that you pay for. And you know what they say – more resources, more problems. The more resources you have across clusters, the more critical it becomes to make sure you’re using them efficiently.
Google Kubernetes Engine has numerous features built-in that you as a cluster admin can use to navigate this continuous journey of optimizing your use of resources in GKE.
Let’s review five of them you can get started with today.
#1 – Cluster view cost optimization in the console
If you don’t know where to start with optimizing your clusters, the best place to start is looking for a big problem that stands out. That’s probably most visible by looking at a view that spans all of your clusters.
In GKE, we have a cluster-level cost optimization tab built into the console, rich with information that may be cumbersome to gather on your own otherwise.
You can find this as seen in the following image:
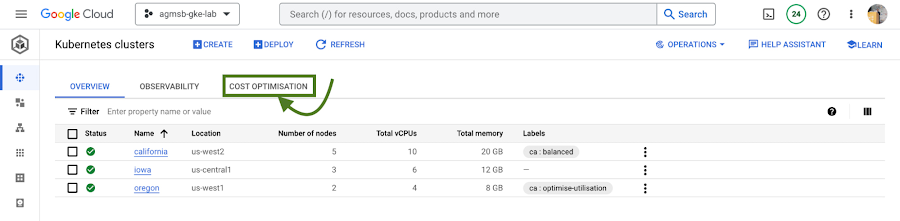
Fig. 1 – Navigating to the cost optimization tab in the cloud console
Once you navigate to this tab, you’re greeted with a time series visualization.
For GKE standard clusters, this visualization is a time series representation that shows three key dimensions for CPU and Memory across all of your clusters in a project:
Total CPU/Memory allocatable– # of CPU or GB of memory that can be allocated to user workloadsTotal CPU/Memory request– # of CPU or GB of memory that has been requested by user workloadsTotal CPU/Memory usage– actual usage by # of CPU or GB of memory by user workloads
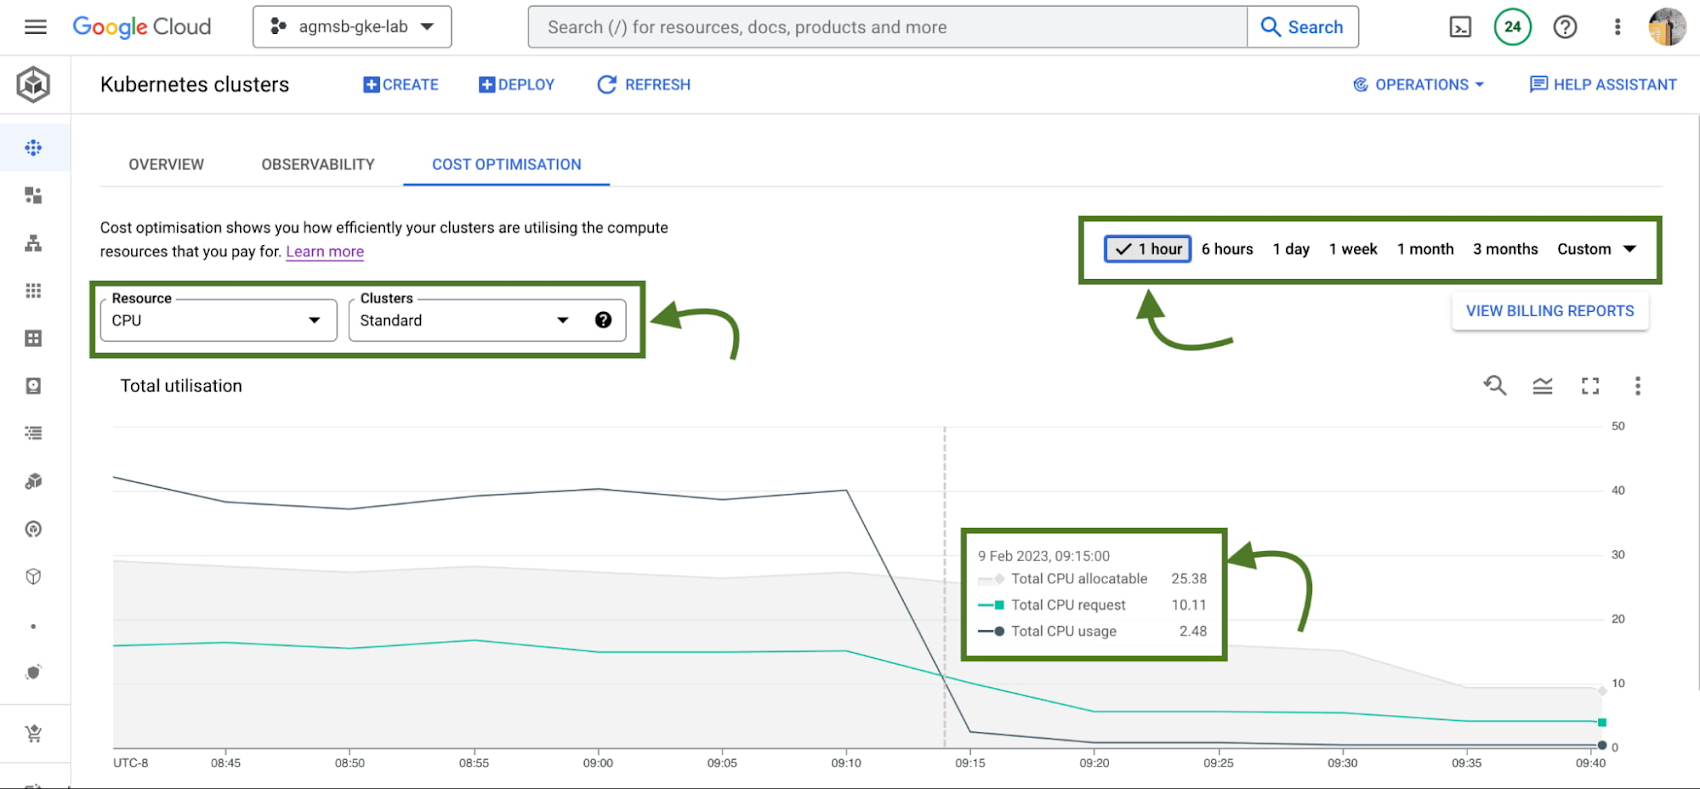
Fig. 2 – Allocatable, requested, and usage time series data across CPU or memory in all standard GKE clusters over a specified window
Analyzing these in relationship to one another can help identify answers to important optimization questions such as:
- Do we have too much allocatable CPU and memory idle across our GKE standard clusters? If so, can we do things like re-evaluate the machine types we use in node pools? This can help us bin pack the cluster, by having a higher percentage of allocatable resources allocated to Pod requests.
- Are workloads running in our GKE standard clusters requesting too much CPU and memory that goes unused? If so, can we do things like work with workload owners to adjust requests? This can help us workload right-size, by setting requests to more closely reflect expected usage.
If we’re using GKE Autopilot, this time series visualization will look slightly different, as seen in the following image:
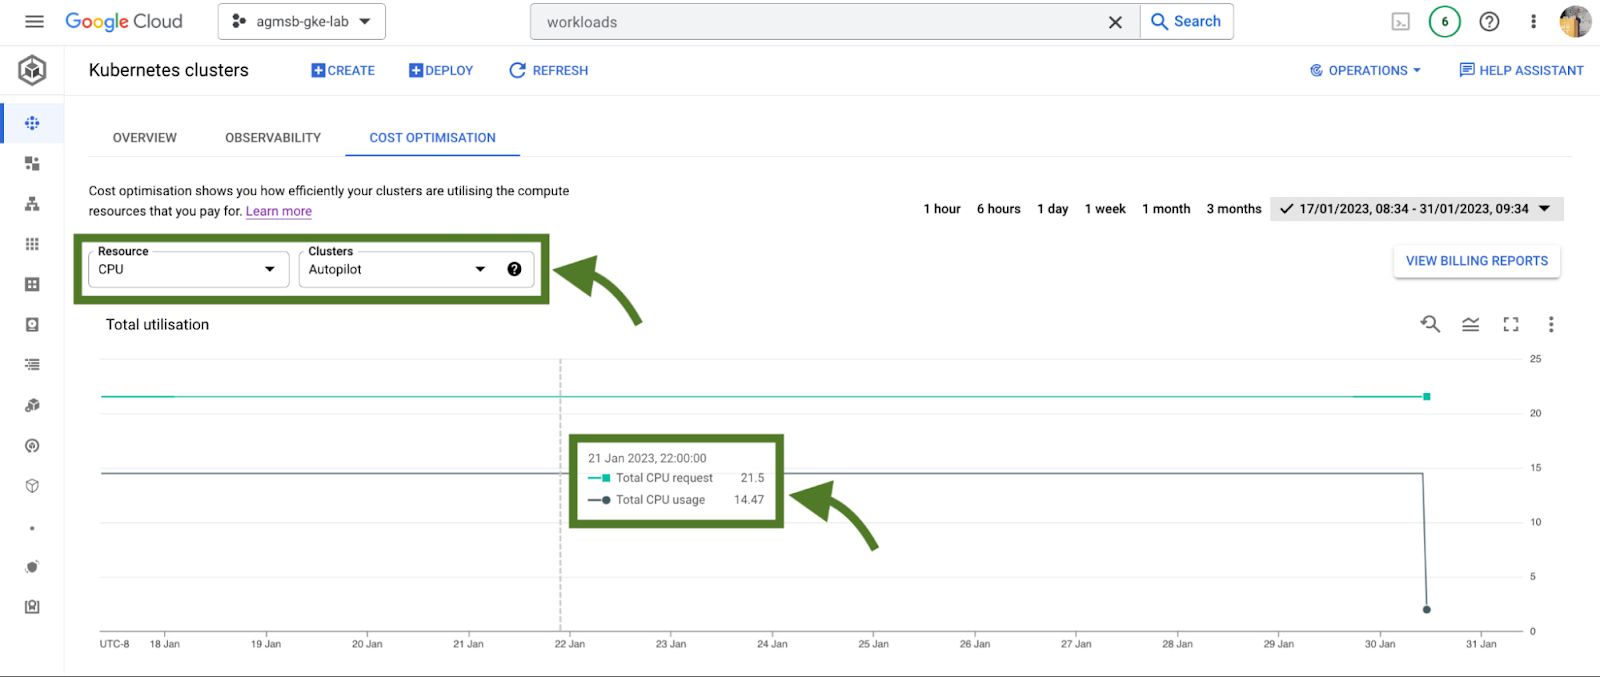
Fig. 3 – Requested and usage time series data across CPU or memory in all GKE Autopilot clusters
In the case of GKE Autopilot clusters, we’re only able to view the Total CPU/Memory request and the Total CPU/Memory usage data. But nothing here is actually missing!
In Autopilot clusters, you only pay per Pod based on its requests; Autopilot automatically handles provisioning the infrastructure that gives us our allocatable resources based on whatever you set Pod requests to. When we trade in that ownership of node provisioning, we also trade in the control to optimize at that layer.
For a cluster administrator, this information can be a spark to spur actions such as diving into individual clusters or meeting with workload teams to work through their requests and limits that they set for workloads. In our research, this is perhaps the most impactful area many teams optimize. We’ll dive into how GKE can enable this exercise a bit further in this blog.
When going down those paths, it helps to have financial data to quantify the impact of the optimization to the business. Gathering this info on your own can require a bit of work (for some, a lot of spreadsheets as well!), but luckily GKE has another native feature to help make this easily accessible to you.
#2 – GKE cost allocation
GKE cost allocation is a native GKE feature that integrates workload usage with Cloud Billing and its reports, allowing you to see and alert on billing not only on a per-cluster level, but on a per-Kubernetes namespace or per-Kubernetes label level.
It must be enabled on your cluster in order for it to function, so if you’re working with an existing GKE cluster and want to enable it, use the following gcloud command once you have set your appropriate zone or region:
$ gcloud beta container clusters create $CLUSTER_NAME \
    --enable-cost-allocation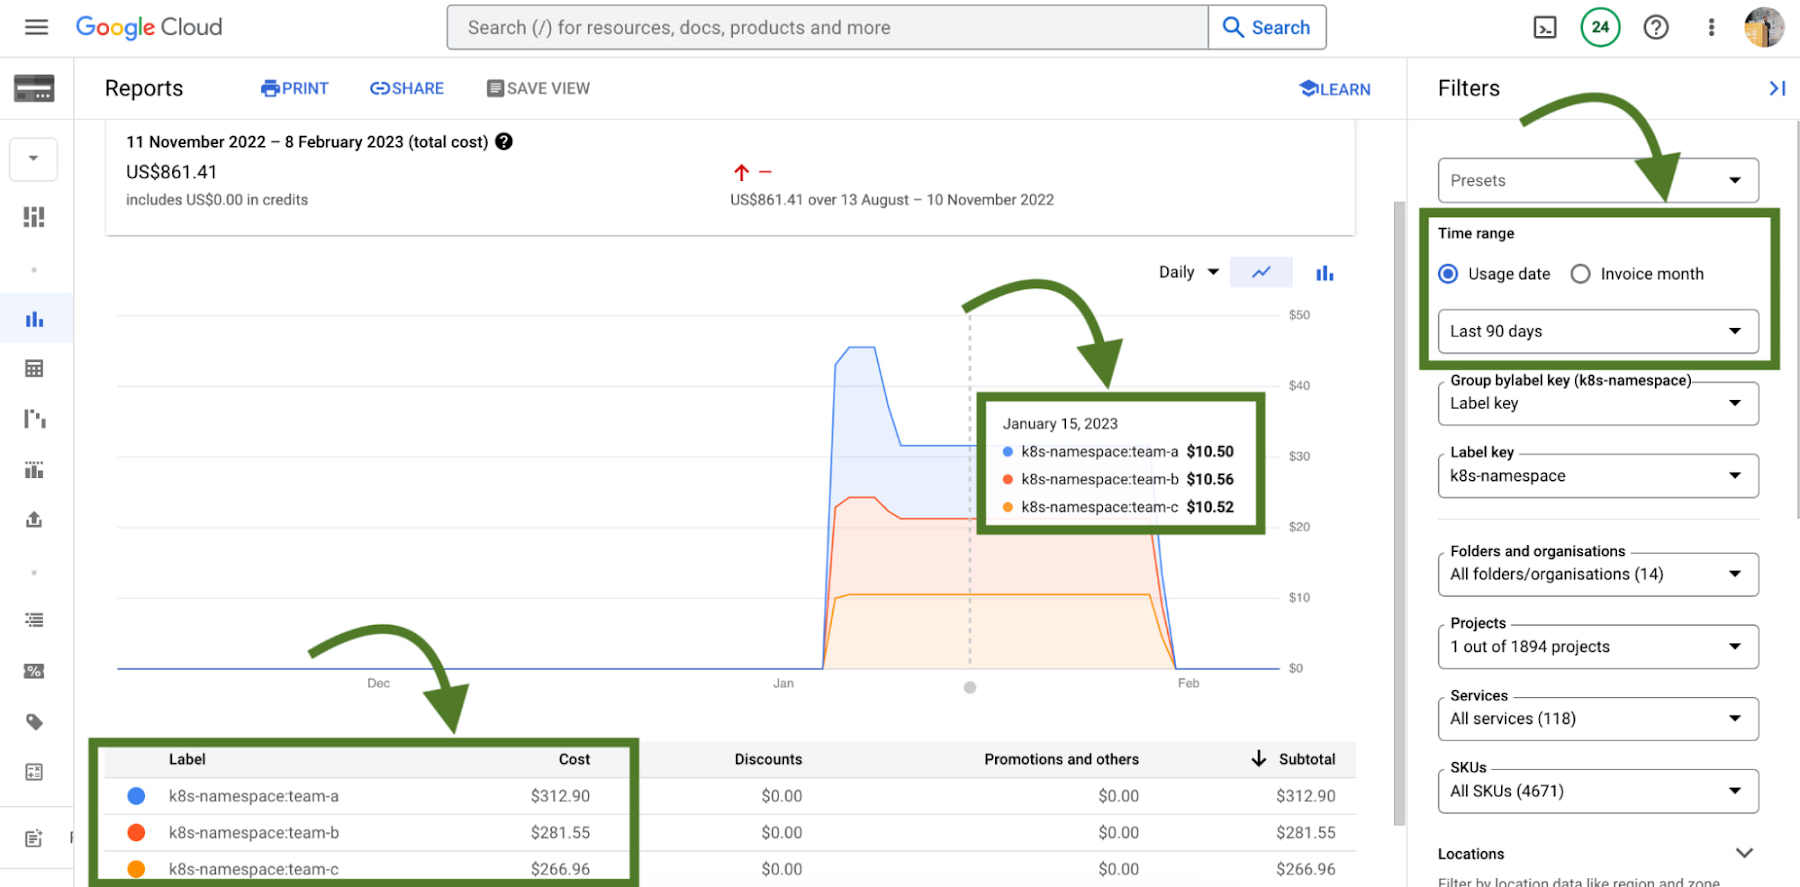
Without GKE cost allocation, the financial impact of a cluster and all of the different workloads it might run were a bit obfuscated. With the cluster as the deepest level of detail in billing, finding areas to optimize or even performing showback and chargeback was a challenge.
With Namespaces and Labels bubbling up into billing reports, you can now understand the cost of the CPU/Memory requests that workloads define in Kubernetes. A caveat – this works best when you are using Namespaces and Labels to logically define and organize teams and their workloads.
This integration also gives the bigger picture of optimization – in that GKE does not typically live on an island! In theory, workloads in a team’s namespace could be using external backing services like Cloud Memorystore that are also a key part of its usage.
Because Cloud Billing data has all GCP services, we can now filter and query across namespaces and their corresponding backing services.
# 3 – Workload view cost optimization in the console
Once you have teams identified that you may want to work with, GKE provides a cost optimization tab at the workload level, where you can then begin to drill down and identify specific workloads that could be optimized through an exercise called “workload right-sizing”. This is the act of making sure that Pod requests more closely reflect their expected usage.
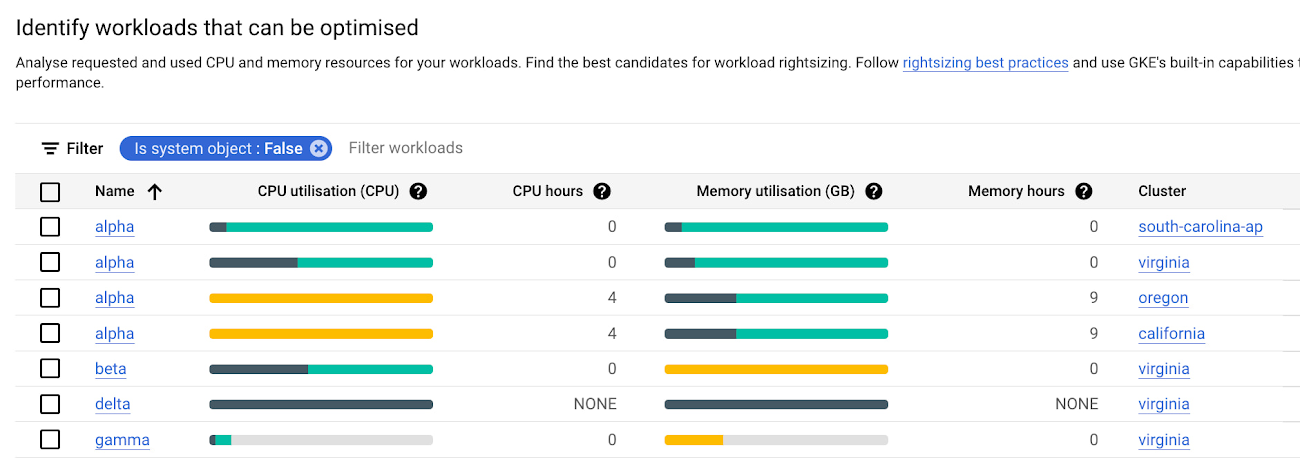
As you can see here, we’re given bar charts to represent the relationship of usage, requests, and limits to one another.
- Dark green: CPU/Memory usage
- Light green: CPU/Memory requests
- Grey: CPU/Memory Limits
- Yellow: Scenarios in which CPU/Memory usage exceeds requests
You can also hover over each individual workload bar chart to reveal a small on-screen report of this data. Similar to the cluster view cost optimization tab, you can filter down to a custom time window; we recommend viewing this data in a window greater than an hour (IE a day, week, month) to potentially uncover diurnal or weekly patterns that would otherwise be obfuscated.
In the preceding screenshot of these charts, we can call out a few patterns that might stand out to you:
- If we have too much light green stacked above dark green in a bar, we may have workloads that are over provisioned.
- If we have a yellow bar, we have a workload where requests are not set high enough, which can be a stability/reliability risk – consuming additional resources on its node and potentially being throttled or OOMKilled if it hits its limits.
- If we have a bar that is all dark green, this means that we don’t have requests set for a workload – which is not best practice! Set those requests.
With this information, it becomes easier to quickly identify workloads that need requests and limits tuned for either cost optimization or stability and reliability.
# 4 – Recommendations for adjusting workload requests
In scenarios where we need to increase or reduce CPU/Memory requests, it is easier to know that it needs to be done than to know how it needs to be done. What should we set the requests to?
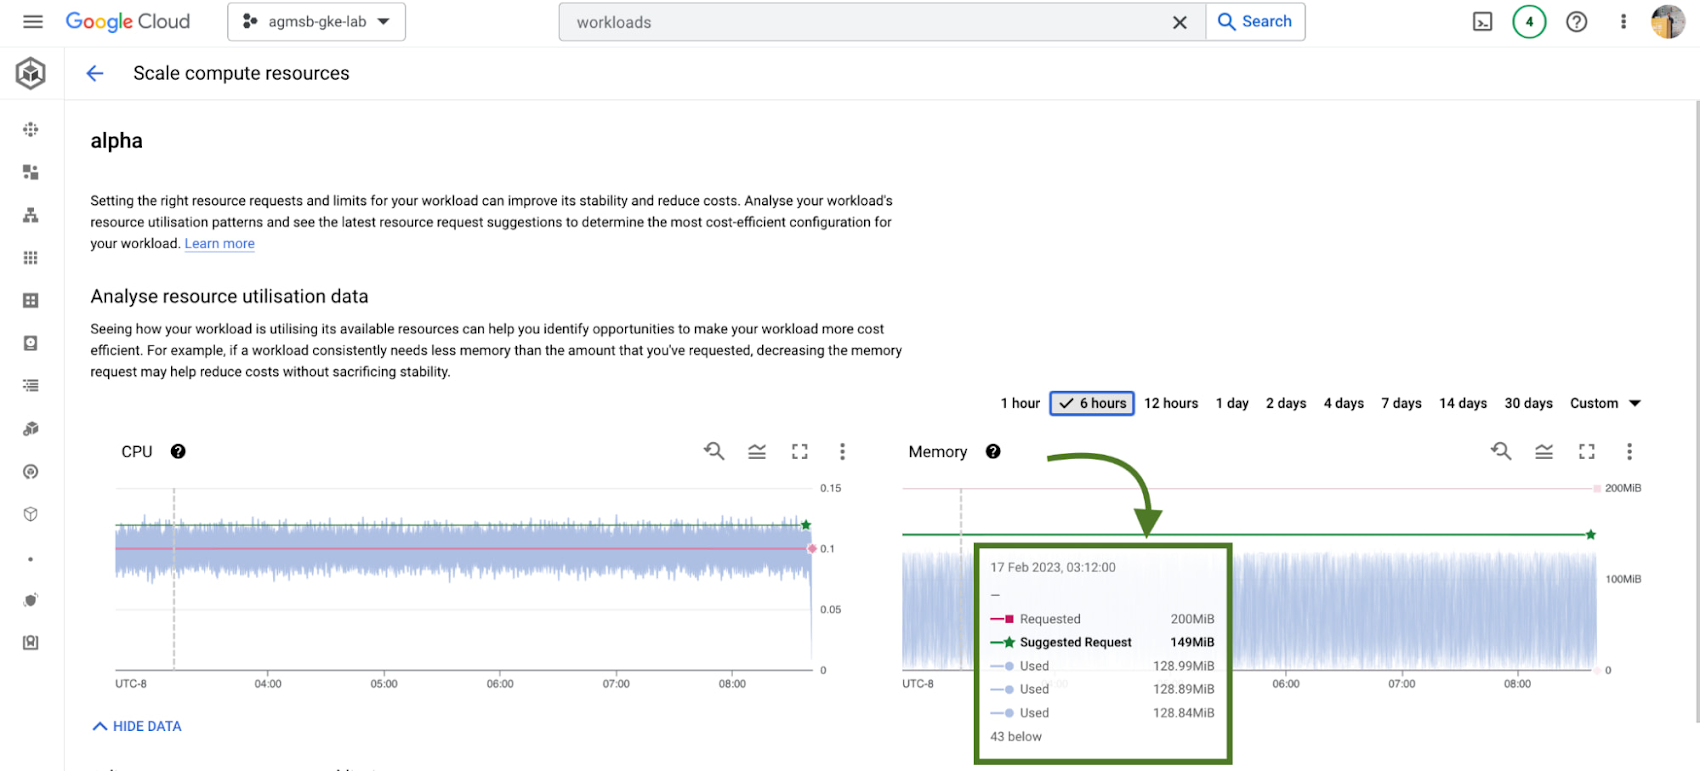
GKE integrates recommendations from the Kubernetes Vertical Pod Autoscaler (VPA) directly into its workload console, currently for all deployments in your clusters. You can find this by navigating to the Actions > Scale > Scale compute resources menu when viewing the page for a specific workload.
It’s important to remember that these recommendations are just that – recommendations. They’re based on historical usage data, so when viewing these values, it’s important to work with workload owners to see if these suggestions make sense to incorporate into their respective Kubernetes manifests.
# 5 – Cost estimation and cluster creation setup guides
Finally, if you’re just getting started with GKE and you want to get started on the right, optimized foot, we have tooling incorporated into the GKE cluster creation page.
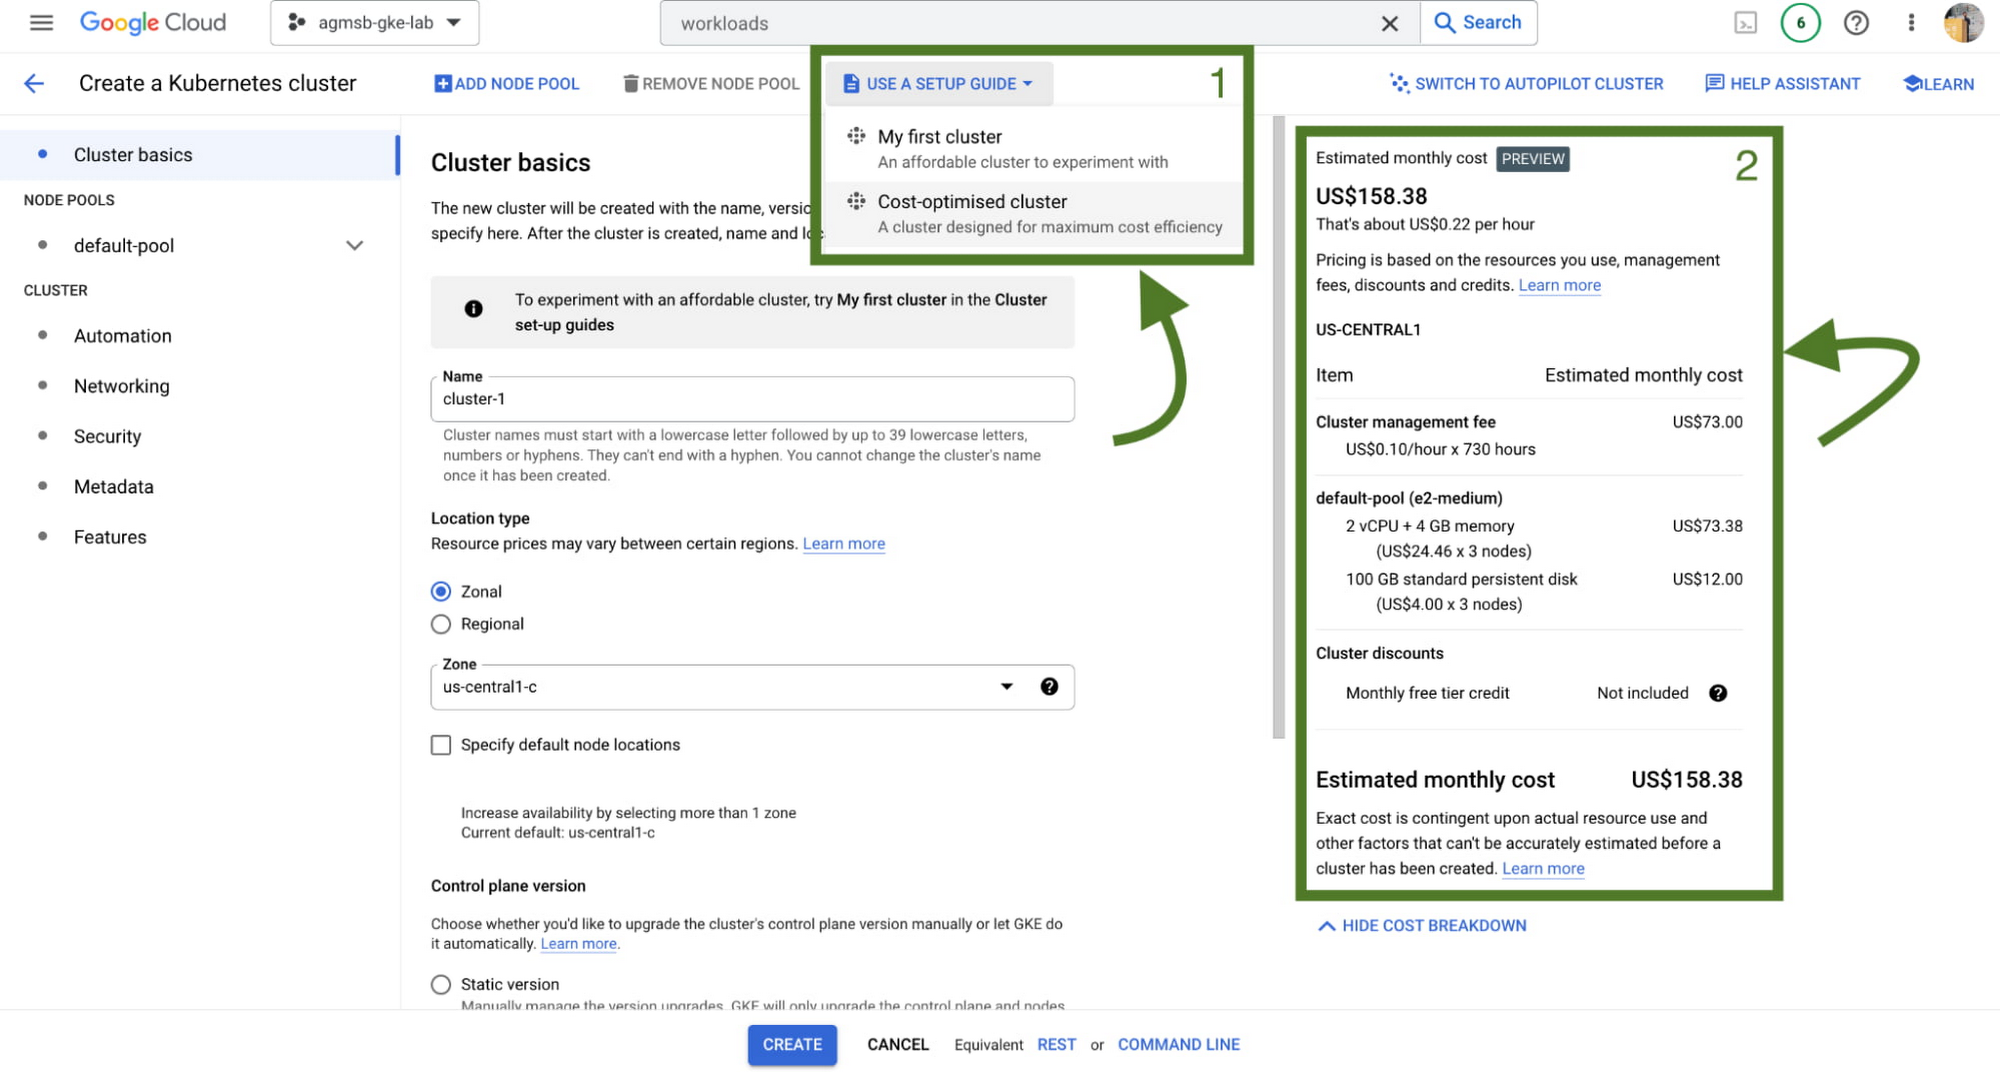
First, we have a setup guide that will help you create an opinionated GKE standard cluster with some things we discussed here already enabled, such as GKE cost allocation and Vertical Pod Autoscaler.
Second, we also have a cost estimation panel that, depending on the configuration of your GKE standard cluster, will show you an estimated monthly cost. This even helps you get a range of potential costs if you expect your cluster to scale up and down!
Now what?
Optimization across a set of GKE clusters can include a handful of areas to think about – and isn’t a one time task! Instead, it’s a continuous journey that cluster administrators, workload owners, and even billing managers all take part in. GKE provides the tooling to make this journey and process easier, with the right data and insights at your fingertips.
To familiarize yourself with these features in GKE, check out our interactive tutorials for getting started with standard and autopilot clusters.
You can also watch a demo showing most of these features in the following video:
A special thanks to Laurie White, Fernando Rubbo, and Bobby Allen for their review on this blog post.
Google Maps’ Cloud-based Styling Features Betters UX, Control and Flexibility

3361
Of your peers have already read this article.
2:00 Minutes
The most insightful time you'll spend today!
This year at Google I/O, we announced the general availability of Cloud-based maps styling for the Maps JavaScript API. In an effort to provide you with more options and more control to help create the best experience for your users, today we’re releasing new features to Cloud-based maps styling. You may already be familiar with these features from the consumer Google Maps web and mobile apps—Landmarks and Building Footprints. We’re also releasing updates to our industry optimized map styles to provide even more map details while providing the flexibility to craft the best experience for your users. Let’s take a look.
Help users quickly scan and orient themselves with Landmarks
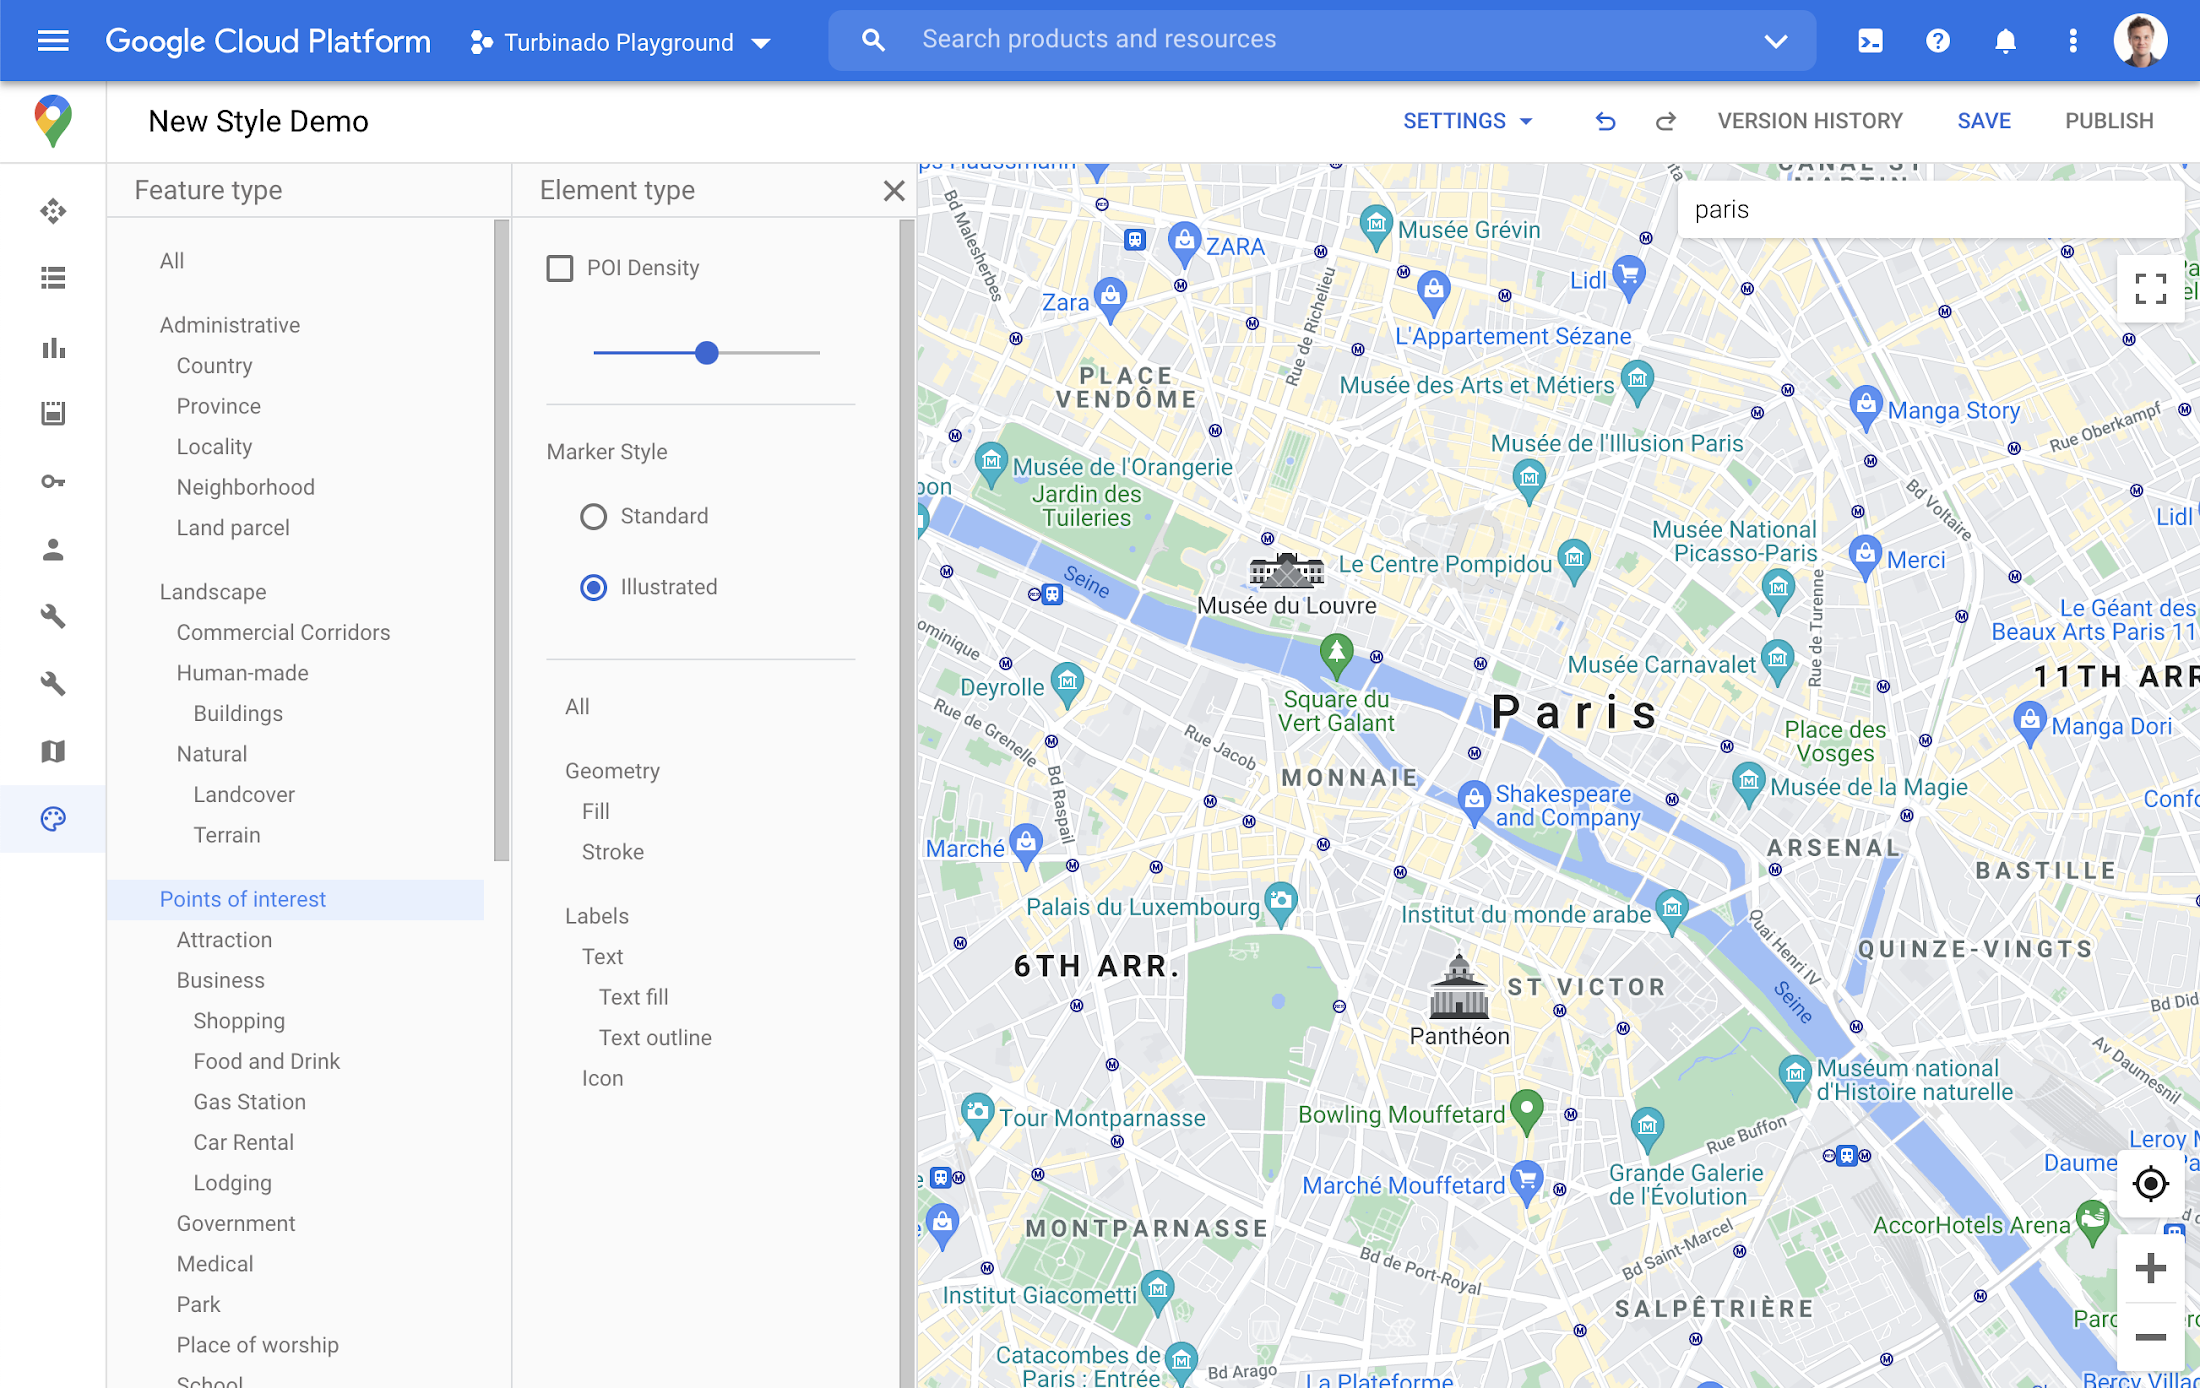
You may have noticed some enhancements for prominent places in the consumer Google Maps web and mobile apps, these landmarks help show your users points of interest that help them orient and navigate cities they are exploring or visiting.

You now have the ability to bring this same experience to your users by creating maps using Cloud-based maps styling. This feature is available in 100 cities globally including New York, Dubai, Paris, Mumbai, and Singapore. To enable landmarks for your map, log into the Cloud console and in our style editor navigate to the Points of interest feature type and select ‘Illustrated’ under Marker Style.
Simplify maps features by switching to Building Footprints
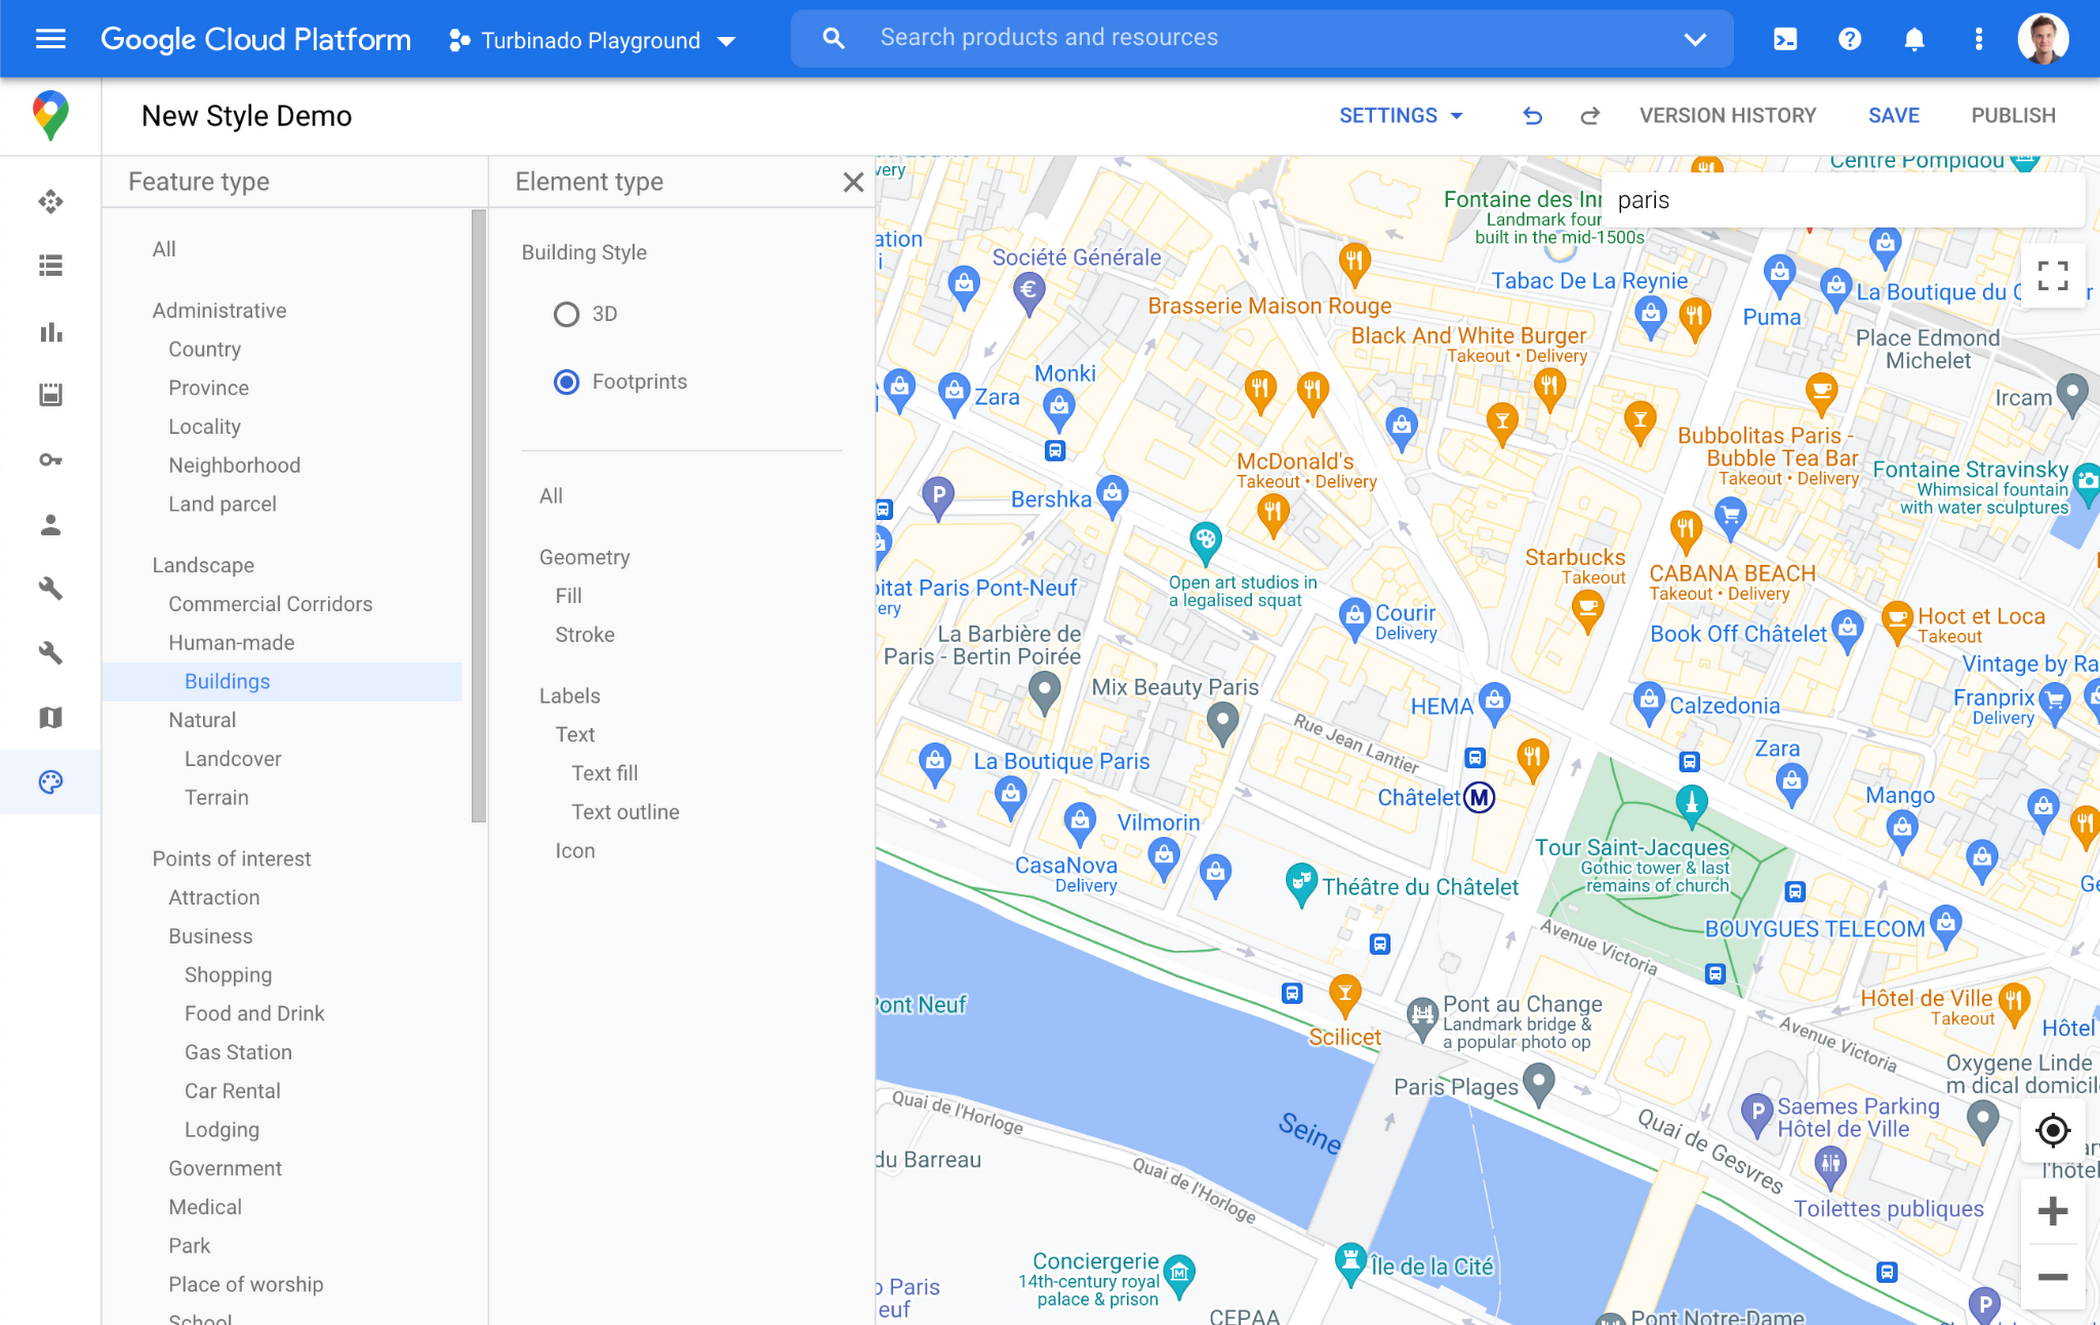
Sometimes less is more. In dense, highly vertical cities, showing 3D building heights can add cognitive load for users. Now, in addition to 3D buildings, we offer building footprints as an option in the style editor. Building footprints can provide a strikingly different basemap balance and composition to better support use cases that may not benefit from the added complexity that 3D buildings can present.

Fill and stroke geometries can also be styled independently to support various color themes. To enable Building Footprints, log into the Cloud console and in our style editor navigate to Buildings and choose ‘Footprints’ under building style.
Industry Optimized Map Styles now include Landmarks and Building Footprints, plus Detailed Street Maps
In January of this year we launched Industry Optimized Map Styles for the travel, real estate, retail, and logistics industries, providing customers with pre-styled map configurations, available via Cloud-based maps styling. Landmarks are now included in all of our Industry Optimized Map Styles and we have turned on Building Footprints in the travel style map. If you are already an Industry Optimized Map Styles user, these new features will be applied to your map with no action needed from you. If you would like to disable these changes, you can use the style editor to turn off these features.
For Industry Optimized Map Styles only, we are also excited to enable Detailed Street Maps. You may have seen these features in our consumer products at Google I/O, released back in August of 2020 for the consumer Google Maps web and mobile apps. Detailed Street Maps are available in San Francisco, New York, London, and Tokyo, and we are targeting expansion to 50 new cities by the end of 2021.
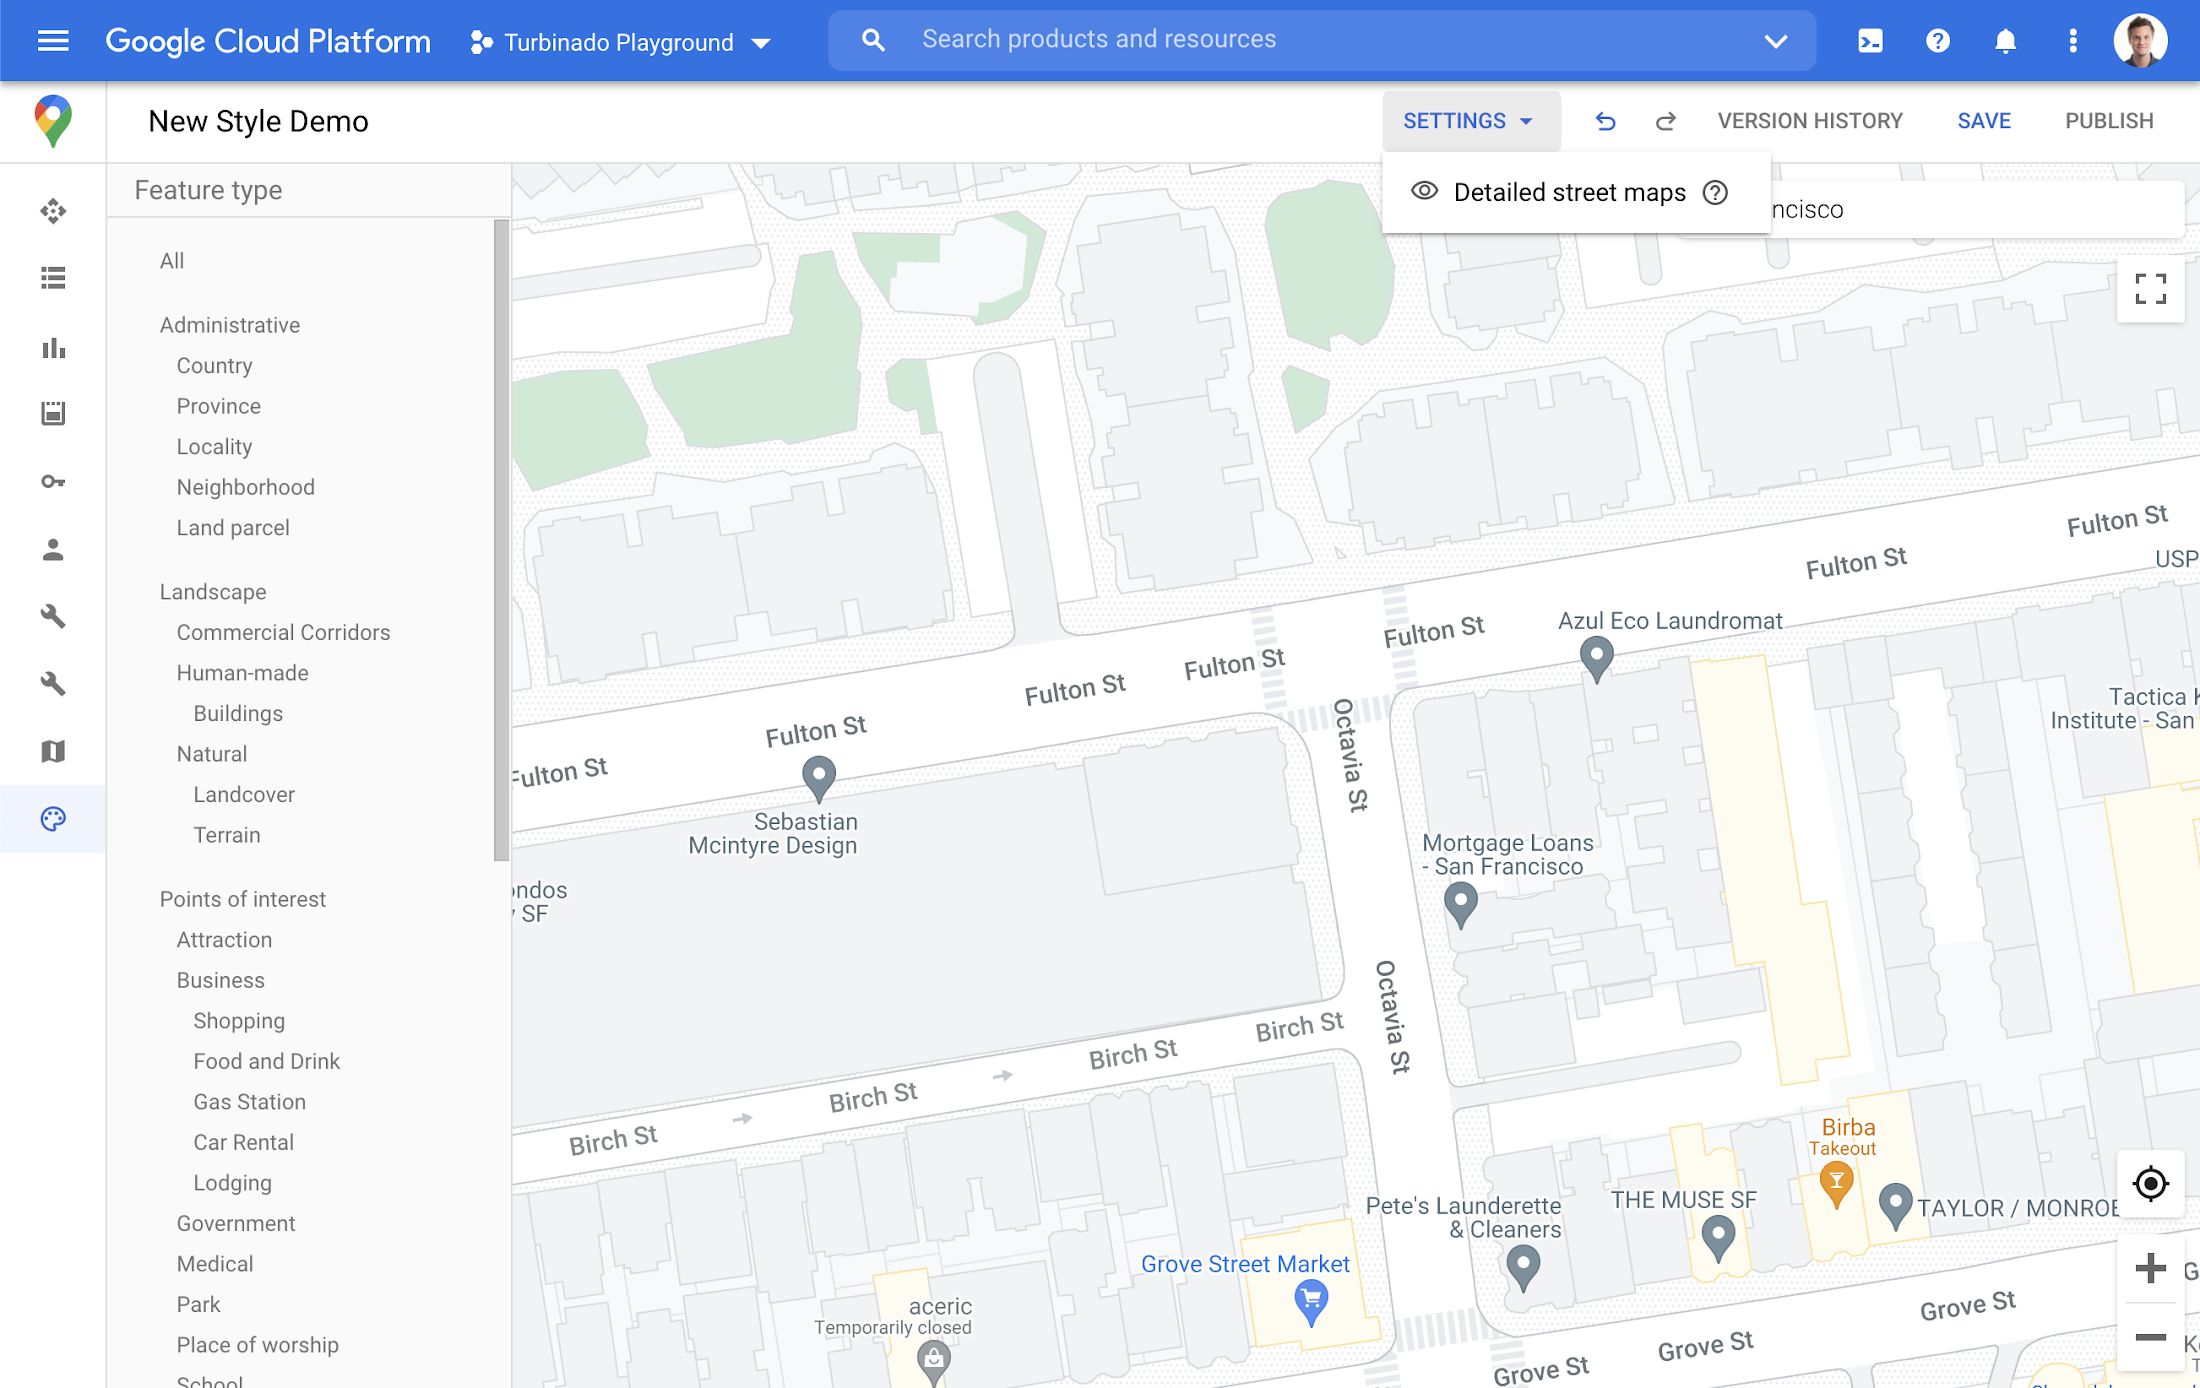
Detailed Street Maps are on by default for all Industry Optimized Map Styles and we created a new settings menu to change the visibility, as needed. We are working on bringing the full styling capability for Detailed Street Maps features to all Cloud-based maps styles in the future.
Landmarks and Building Footprints as well as the updates to Industry Optimized Map Styles are only available via Cloud-based map styling in the Google Cloud Console and are included in Google Maps Platform pricing. Learn more about how to use Landmarks and Building Footprints and Industry Optimized Map Styles. To get started with Cloud-based map styling, check out our documentation for JavaScript.
For more information on Google Maps Platform, visit our website.

4117
Of your peers have already downloaded this article
10:32 Minutes
The most insightful time you'll spend today!
While microservices are lauded as catalysts for speed and scale, the conversation is incomplete if it does not include APIs. Without APIs, microservices cannot be securely, reliably, and adaptably scaled across an organization or to outside partners. Moreover, because these APIs and their microservices are meant to be widely consumed and reused, it’s not enough for companies to merely create the APIs and move on. Rather, the APIs should be continually managed so the business can control how its microservices are accessed, generate insight into how they are used, and encourage reliability of its services.
As microservices grow beyond their original use cases and are being leveraged to share important functionality throughout the enterprises and even with external partners, the problem that arises is how this sharing creates challenges for teams trying to secure, monitor, understand usage of, and fully take advantage of microservices.
In this eBook we explore how leading enterprises are facing these challenges head-on and scaling their microservices strategies. Learn how APIs make it possible for microservices to be securely, reliably, and adaptably shared, and how an API management platform enables enterprises to ensure that they maintain control over their microservices as consumption grows.
How Ather Energy is leveraging the Cloud to build and scale smart mobility solutions for India

8372
Of your peers have already read this article.
8:30 Minutes
The most insightful time you'll spend today!
In 2013, long before the world was discussing clean energy and sustainable practices, two IIT Madras graduates — Swapnil Jain and Tarun Mehta — had an idea to develop India’s first-ever electrical scooter.
This was at a time when auto manufacturers were still focusing on fossil-fuel-driven vehicles and ‘eco-friendly’ mobility solutions were more a trendy alternative catering to a niche market.
The duo founded Ather Energy in 2013 and launched their first fully-electric scooter, the Ather S340, in Bengaluru in 2016. Since then, the company has released several new models into the market and is planning to expand to eight more cities by the end of the year.
To support the smooth running of their vehicles, lower costs, improve time to market, and create great customer experience, Ather turned to Google Cloud.
Read the Full Story on YourStory
3568
Of your peers have already watched this video.
1:30 Minutes
The most insightful time you'll spend today!
Building a Powerful Digital Payments Solution
See how the Payeezy business platform, which enables merchants to establish and grow their eCommerce business, was set up and how it works.
The platform enables the exposure of First Data services, processes, and data to partners. The Payeezy API provides all the tools partners need to set up payments in their apps, set up merchant accounts on behalf of clients, and get paid.
First Data partners with Apigee to offer a powerful and easy to use developer portal.The Apigee Edge API management platform enabled First Data to accelerate development of the Payeezy APIs.
More Relevant Stories for Your Company




Leveraging APIs to Deliver Connected Customer Experiences
What does the connected customer experience even mean? It's not just about a checklist of assets like website and mobile but how those channels seamlessly work together with the physical world to give your customer great experiences with your brand. Modern APIs enable companies to mask back-end complexities behind a

Maximizing Reliability, Minimizing Costs: Right-Sizing Kubernetes Workloads
Do you know how much money you could save by adjusting workload requests to better represent their actual usage? If you're not rightsizing your workloads, you might be overpaying for resources that your workloads aren't even using or worse, putting your workloads at risk for reliability issues due to under

PaGaLGuY Turns to Google Cloud Platform to Power Leading India Education Network
Founded in 2006, PaGaLGuY started as a forum that enabled students, typically aged between 20 and 30 to discuss and seek advice on academic issues. By 2011, PaGaLGuY had increased its traffic to about 250,000 page views per month. The business is now one of India’s largest education networks and

Khan Academy’s Shortcut to Growth: The Trick Behind the Scenes
Based in Mountain View, California, Khan Academy is a not-for-profit that produces and posts a vast collection of free educational online videos about math and science topics ranging from algebra and trigonometry to biology and economics. Millions of students, educators, and self-learners around the world watch the videos, both on the Khan
