





AL/ML and Data Products Delivered through Google Cloud Makes them Leader of Gartner 2022 Magic Quadrant

4880
Of your peers have already read this article.
2:00 Minutes
The most insightful time you'll spend today!
Gartner® named Google as a Leader in the 2022 Magic Quadrant™ for Cloud AI Developer Services report. This evaluation covered Google’s language, vision and structured data products including AutoML, all of which we deliver through Google Cloud. We believe this recognition is a reflection of the confidence and satisfaction that customers have in our language, vision, and AutoML products for developers. Google remains a Leader for the third year in a row, based upon the completeness of our vision and our ability to execute.
Developers benefit in many ways by using Cloud AI services and solutions. Customers recognize the advantages of Google’s AI and ML services for developers, such as Vertex AI, BigQuery ML, AutoML and AI APIs. In addition, customers benefit from the pace of progress in the field of Responsible AI and actionable ethics processes applied to all customer and partner solutions leveraging Google Cloud technology, as well as our core architecture including the Vertex AI platform, vision, conversational AI, language and structured data, and optimization services and key vertical industry solutions.
We believe that our ‘Leader’ placement validates this vision for AI developer tools. Let’s take a closer look at some of the report findings.
ML tools purpose-built for developers
Google’s machine learning tools have been built by developers, for developers, based on the groundbreaking research generated from Google Research and DeepMind. This developer empathy drives product development, which supports the developer community to achieve deep value from Google’s AI and ML services. An example of this is the unification of all of the tools needed for building, deploying and managing ML models into one ML platform, Vertex AI, resulting in accelerated time to production. They also cite BigQuery ML, AutoML for language, vision video and tabular data) and prebuilt ML APIs (such as speech and translation) as having high utility for developers at all levels of ML expertise to build custom AI and quickly infuse AI into their applications.
Leading organizations like OTOY, Allen Institute for AI and DeepMind (an Alphabet subsidiary) choose Google for ML, and enterprises like Twitter, Wayfair and The Home Depot shared more about their partnership with Google in their recent sessions at Google Next 2021.
Responsible AI principles and practices
Responsible AI is a critical component of successful AI. A 2020 study commissioned by Google Cloud and the Economic Intelligence Unit highlighted that ethical AI does not only prevent organizations from making egregious mistakes, but that the value of responsible AI practices for competitive edge, as well as talent acquisition and retention are notable. At Google, we not only apply our ethics review process to first party platforms and solutions, to ensure that our services design-in responsible AI from the outset, we also consult with customers and partners based on AI principles to deliver accountability and avoid unfair biases. In addition, our best-in-class tools provide developers with the functionality they need to evaluate fairness and biases in datasets and models. Our Explainable AI tools such as model cards provide model transparency in a structured, accessible way, and the What-If Tool is essential for developers and data scientists to evaluate, debug and improve their ML models.
Clear and understandable product architecture
Google Cloud’s investment in our ML product portfolio has led to a comprehensive, integrated and open offering that spans breadth (across vision, conversational AI, language and structured data, and optimization services) and depth (core AI services, with features such as Vertex AI Pipelines and Vertex Explainable AI built on top). Industry-specific solutions tailored by Google for retail, financial services, manufacturing, media and healthcare customers, such as Recommendations AI, Visual Inspection AI, Media Translation, Healthcare Data Engine, add another layer leveraging this foundational platform to help organizations and users adopt machine learning solutions more easily.
At Google Cloud, we refuse to make developers jump through hoops to derive value out of our technology; instead, we bring the value directly to them by ensuring that all of our AI and ML products and solutions work seamlessly together. To download the full report, click here. Get started on Vertex AI and talk with our sales team.
Disclaimer:
Gartner, Magic Quadrant for Cloud AI Developer Services, Van Baker, Arun Batchu, Erick Brethenoux, Svetlana Sicular, Mike Fang, May 23, 2022.
Gartner and Magic Quadrant are registered trademarks of Gartner, Inc. and/or its affiliates in the U.S. and internationally and is used herein with permission. All rights reserved.
Gartner does not endorse any vendor, product or service depicted in its research publications, and does not advise technology users to select only those vendors with the highest ratings or other designation. Gartner research publications consist of the opinions of Gartner’s research organization and should not be construed as statements of fact. Gartner disclaims all warranties, expressed or implied, with respect to this research, including any warranties of merchantability or fitness for a particular purpose.
Volkswagen + Google Cloud: Using Machine Learning to Drive Smarter with Energy Efficient Cars
2669
Of your peers have already read this article.
2:30 Minutes
The most insightful time you'll spend today!
Volkswagen strives to design beautiful, performant, and energy efficient vehicles. This entails an iterative process where designers go through many design drafts, evaluating each, integrating the feedback, and refining.
For example, a vehicle’s drag coefficient—its resistance to air—is one of the most important factors of energy efficiency. Thus, getting estimates of the drag coefficient for several designs helps the designers experiment and converge toward more energy-efficient solutions. The cheaper and faster this feedback loop is, the more it enables the designers.
Unfortunately, estimating drag coefficient is an expensive and time-consuming operation that involves either a physical wind tunnel or a computationally intensive simulation. This can be a bottleneck in the feedback cycle.
For this reason, Volkswagen and Google Cloud decided to collaborate on a joint research project to investigate using machine learning (ML) to get fast and inexpensive estimates of the drag coefficient. In this post, we’ll explore the challenges and approaches undertaken in this project.
The core principles of the project were simple. First, we needed to collect a dataset of existing car designs and their respective drag coefficients. Then, we needed to create a representation of the various cars that would be suitable for ML. The next step was to train a deep learning model to predict the drag coefficient, and then, finally, we would use that model to efficiently estimate drag for any new design.
Representing three-dimensional car designs
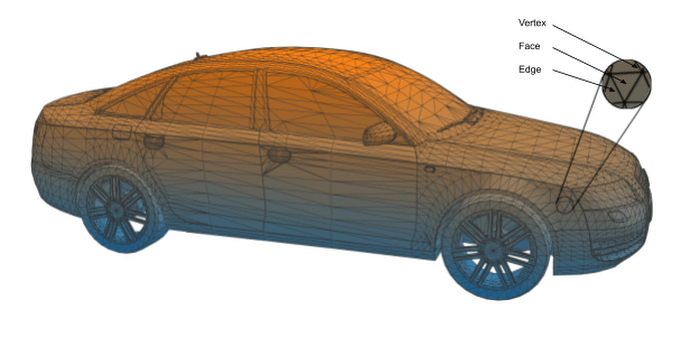
Design software recreates a physical object as a three-dimensional triangle mesh made up of three types of objects—faces, edges, and vertices. Figure 1, below, shows such a mesh for an Audi S6. Faces are flat surfaces, such as the window in a car door. An edge is where two faces meet (e.g., the side of the door), and a vertex is where two or more edges meet, such as the corner of the door.
Car bodies, however, come in all shapes and sizes. A Volkswagen Golf economy model is very different from a Tiguan SUV, and a single vehicle can have both large smooth surfaces as well as areas with delicately designed features. Consequently, there can be a huge variety from one polygonal mesh to the next.
ML models need consistent representation in order to form robust generalized rules. With such a dramatic variance between each polygonal mesh, the models would be compromised and the results could have huge margins of error.
We needed to find a way to create simple meshes that capture the shape of the car but are still suited for ML models.
Representing a car with digital shrink wrapping
Rather than building a representation of each car from the ground up, we applied a “shrink wrapping” method for the 3D meshes. The principle is very similar to vacuum-sealing a cucumber. The cucumber is placed in a plastic bag and the air is then gradually removed until the bag fits tightly around it, capturing its shape.
Our approach works similarly: we start with a base mesh, a simple shape that corresponds to the plastic bag, and we deform it until it captures the shape of the target mesh. For our purposes, the base mesh is a simplified representation of a car and the target mesh is the particular car we are designing for at that moment. Such meshes can be defined, managed, and presented to ML models for training using the Tensorflow Graphics and trimesh libraries.
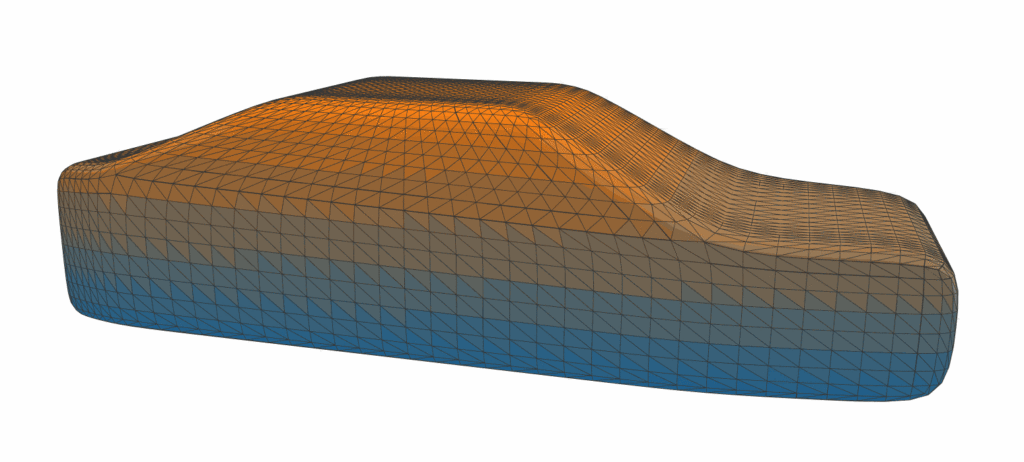
Our “shrink wrapping” method mainly works by iteratively minimizing a measure of distance (e.g., chamfer distance) between the two meshes. Additionally we can regularize our mesh to preserve certain qualities, like smoothness, in the resulting mesh. This iterative optimization is analogous to the vacuum pump, gradually shrinking and fitting the vertices of the mesh as closely as possible to the complex shape of the car. With shrink-wrapping, we are able to produce cleaner meshes that are more suitable to our estimation task. An example of such a procedure is shown in Figure 2.
How to train a model
Shrink-wrapping the 3D car designs was an important first step, but the work was far from over. Our next challenge was to build and test the machine learning algorithms.
We wanted our algorithms to estimate the drag coefficient as accurately and quickly as possible each time it looked at a new design. To do so, we had to train the ML models on existing data.
From publicly available datasets, we calculated the drag coefficients for 800 different car meshes, which we trained the models on. Then, we evaluated the trained models on a further 100 meshes, seeing how accurate their estimates were on new data.
As we worked through this training, we refined our approach. Initially, we tested models based on convolutional neural networks – similar to PointNet – that observed only the vertices, i.e., the fixed points in each mesh. But when we tested mesh-convolutional models – similar to FeastNet – we found a slightly different focus improved the accuracy of the estimates. Rather than focusing on vertices alone, these models looked at a mesh of vertices and how they relate to each other. These models placed each vertex in a richer context, leading to more accurate estimates when air-flow hit particularly subtle design features.
Working in parallel and at scale
To collaborate across time zones and two organizations, we’ve used the Google Cloud Vertex AI platform.
Vertex AI Workbench serves as a central hub to interact with other services and infrastructure on the Vertex AI platform. It enables quick experiments and preparation of training packages for resource-intensive ML model training jobs, all in a Python notebook environment for immediate execution of code. The notebook environments allow code-based interaction with other services on Google Cloud and ML tools such as Vertex AI Training and Vertex AI Pipelines.
The process of training a new model is a seamless one. First, a dataset is prepared and stored in Google Cloud Storage, usually with the help of Tensorflow Datasets. Then, for every ML model we want to test, we package and store the training code as a container image with Google Cloud Build and Container Registry. This ensures that every job is fully documented, including the provided parameters, training code package, logs from the training task, and resulting artifacts such as metrics and model files.
From there, we submit the model to the Vertex AI Training service, which provides easy access to large scale infrastructure and hardware accelerators, such as GPUs and TPUs, by simply defining resource needs when submitting a job. By using Vertex AI Training’s hyperparameter tuning feature, we can run experiments in parallel with multiple neural networks to find the right one for our purposes.
With Vertex AI Tensorboard, we can capture metrics and visualize the results of our experiments. These are readily available to anyone in the team, wherever they are in the world, for a wider discussion.
The first milestone
This joint research effort between Volkswagen and Google has produced promising results with the help of the Vertex AI platform. In this first milestone, the team was able to successfully bring recent AI research results a step closer to practical application for car design. This first iteration of the algorithm can produce a drag coefficient estimate with an average error of just 4%, within a second.
An average error of 4%, while not quite as accurate as a physical wind tunnel test, can be used to narrow a large selection of design candidates to a small shortlist. And given how quickly the estimates appear, we have made a substantial improvement on the existing methods that take days or weeks. With the algorithm that we have developed, designers can run more efficiency tests, submit more candidates, and iterate towards richer, more effective designs in just a small fraction of the time previously required.
Going forward, faster and more accurate estimates could even enable more automated searching for efficient designs, which would help both engineers and designers to hone in on the areas of the vehicle body where they could have the most impact. An important next step will be integrating the results into 3D design software to let designers benefit from the output and provide feedback.
As we continue, our focus is on improving the accuracy of the models. Firstly, we will build a larger, better quality dataset. Secondly, we will improve our shrink-wrapping algorithm to capture more details. Finally, we will enhance our existing models by experimenting with Vertex AI Neural Architecture Search to explore and experiment with different neural architecture options.
Moreover, we believe that our results for drag coefficient estimation is only a starting point for further exploration. There could potentially be numerous use cases in the space of physical simulations and assessments where cost and time savings could be achieved through ML-based estimators.
Acknowledgements
This work wouldn’t have been possible without the contributions from Volkswagen Data:Lab, Google Research, and Google Cloud. Thanks to Ahmed Ayyad, Dr. Andrii Kleshchonok, Dr. Daniel Weimer, Gülce Cesur, Henrik Bohlke, Andreas Müller from Volkswagen, Ameesh Makadia, Ph.D., and Carlos Esteves, Ph.D., from Google Research, and Daniel Holgate, Holger Speh, and Dr. Michael Menzel from Google Cloud.
Accuracy and Real-time Updates with Google Maps’ On-Demand Rides and Delivery Solution Impacts CX

5647
Of your peers have already read this article.
3:00 Minutes
The most insightful time you'll spend today!
Last year we launched our on-demand rides and delivery solution to help businesses improve operations as well as transform the driver and customer journey from booking to arrival or delivery. When it comes to on-demand rides and deliveries, every minute matters. When users book a ride or order food, they want a seamless experience and real-time accurate updates. Today, we’re taking a closer look into data quality improvements for location, time and distance accuracy, and motorbike routes.
Machine learning helps drive location accuracy
Location accuracy stands at the base of our customers’ operation. The location signals that are coming from mobile devices can sometimes be off for various reasons and a driver’s location can get stuck, or jump around.
Recently we developed mechanisms in our fleet management product that can take in multiple location signals and determine the most reliable location to use for a given vehicle. With that, we noticed drastic improvements:
- Eliminated long periods of location ‘stuckness’ almost completely; a vehicle is considered ‘stuck’ when we think it’s moving but the measured location is not
- Reduced the jumpiness of the location signal by 52%-86%: ‘jumpiness’ is when a vehicle shows a sudden and usually drastic change in location. A jump is determined to exist when the speed the vehicle had to go at in order to cover the distance it did is unrealistic
- Reduced the average jump distance by 44%-86% : ‘jump distance’ is the distance between two consecutive location pings when we determined a ‘location jump’ has occurred.
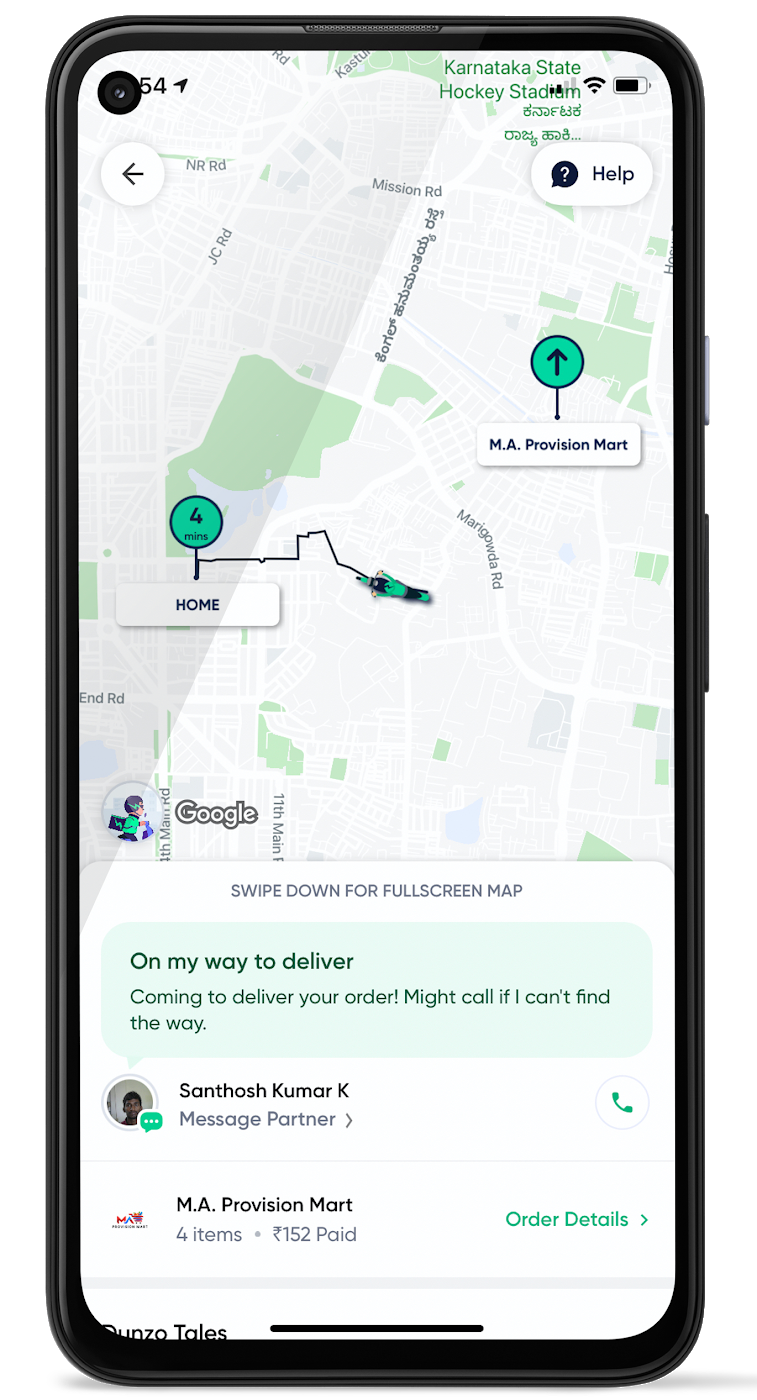
Dunzo, a local e-commerce platform in India, explains how integrating the order tracking capability within Google Maps Platform’s On Demand Rides and Delivery solution has helped reduce support calls by 90%. The out-of-the-box solution helped Dunzo’s motorbike delivery partners with updating location sync to reduce stuckness and jumpiness as well as deliver premium user experiences.
When the vehicle location is more reliable, the dispatch decision is of higher quality, meaning there is a higher chance you will be able to make the optimal decision. This can lead to less wait time for consumers, increased driver happiness and fewer cancellations.
Improvements in ETA accuracy in motorbike routes
In many geographic areas, road space is limited and car ownership is prohibitively expensive so motorbike is a prominent transportation mode. Motorbike mapping requires unique routing, ETA models, and navigation capabilities. Improvements in motorbike routing and ETA estimation have enabled customers like Gojek to offer better overall services, even in geographies with poor wifi or missing roads.
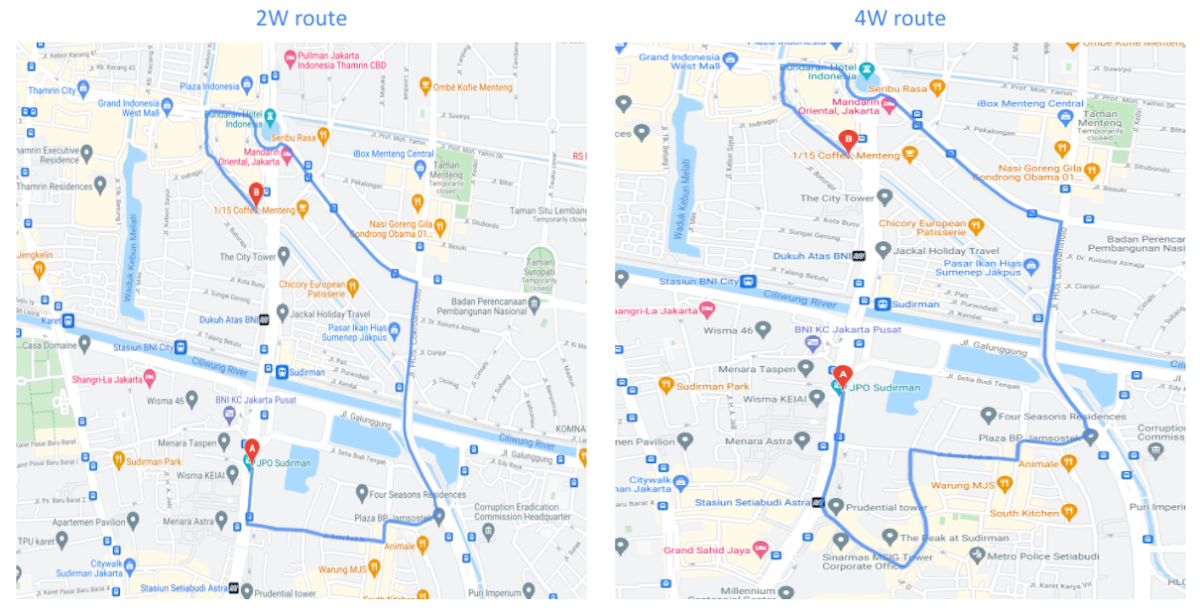
Recently, we further improved ETA outcomes by developing new machine learning models trained specifically for motorbikes. These models help our systems account for differences in congestion and traffic flow that arise in different regions and scenarios.
Globally, we measured an ~8% improvement in ETA accuracy for riders in the general public, and a ~6% improvement in on-demand rides and deliveries ETA accuracy. In this on-demand economy, where consumers are accustomed to real-time trip and order progress, these improvements will significantly improve their experience.
We will continue to innovate on both our car and motorbike on-demand rides and deliveries capabilities based on customer demand and requirements. We are committed to the success of our customers by building a seamless experience for all parties—consumers, drivers, and fleet operators—in the rides and deliveries journey.
For more information on Google Maps Platform, visit our website.
4544
Of your peers have already watched this video.
31:00 Minutes
The most insightful time you'll spend today!
How Google Secures its Data Centers: Watch Video
Security is in the DNA of Google Cloud’s dozens of data centers, complex network and workloads scattered the globe. Take a tour to the nucleus of data center’s six layers of physical security designed to keep unauthorized access at bay, and also learn about Google Cloud’s security fundamentals to leverage the same philosophy on Google Cloud. Watch now!
Improving Patient Outcomes with SAVI and Google Cloud’s Innovative Surgical Instrument Tracking

2482
Of your peers have already read this article.
2:30 Minutes
The most insightful time you'll spend today!
Powered by Vertex AI (Google Cloud’s platform for accelerating development and deployment of machine learning models into production), SAVI (Semi Automated Vision Inspection)1 is transforming surgical instrument identification and cataloging, leading to fewer canceled surgeries and easing pressure on surgery waitlists.
Max Kelsen, an analytics and software agency that specializes in machine learning, has worked closely with Google Cloud and Johnson & Johnson MedTech to create a system that can manage tens of thousands of individual devices, their characteristics, and how they apply to each set or tray used by a surgeon. SAVI does this while delivering a one in 10,000 real-world error rate, much faster and more accurately than manual processes currently in use across the industry. Implementing SAVI can also unlock end-to-end visibility and traceability across the surgical set supply chain and provide advanced analytics and insights.
Eliminating time-consuming manual processes
Surgeons need a large number of specialist instruments and devices to complete complex, delicate procedures. Because each tray of these instruments can typically cost more than $350,000, and having every type of set on shelf at every surgical facility is not feasible, manufacturers generally loan them to hospitals for procedures, such as inserting one of the manufacturers’ implants into a patient’s knee. Once a procedure is complete, the hospital returns the instrument tray to the manufacturer for storage and re-distribution to other hospitals as needed.
Each time a hospital returns a tray, the manufacturer needs to check that each instrument is there, correctly placed, cleaned, and fit for the purpose of the next procedure. As each set may hold more than 400 instruments, completing this process manually is complex and time-consuming. While each tray is checked before and after surgery at the hospital, and again when it arrives and leaves the manufacturer’s facility, Max Kelsen finds that 5% of surgeries can still be affected by missing, broken or bent instruments. This has a severe downstream impact on private hospitals in particular, directly affecting patient safety and outcomes; in Australia, for example, around 60% of surgeries are performed in private hospitals.
Johnson & Johnson MedTech has 60,000 surgical trays across the Asia-Pacific, and loans these trays out about 100,000 times per month. The manufacturer approached Max Kelsen to help design and develop a solution to make the supply chain more efficient, and to give more visibility into asset movement. As a Google Cloud Partner specializing in applying machine learning at scale in healthcare contexts, Max Kelsen had the expertise and track record to meet Johnson & Johnson MedTech’s need for a globally scalable solution that was engineered for quality and performance.
The first step was to establish a baseline for the project by determining how long the manufacturer’s team took to process each tray, and to set an efficiency number. We then spent six months determining and evaluating how to deliver a robust, accurate solution that outperformed current manual and labor-intensive methods in processing instruments and trays, globally. Our work included extensive technical feasibility research involving a representative sample for the variety and complexity of sets, trays, and devices needed for different types of surgery, including orthopedics, spinal trauma, and maxillofacial groups.
Working with Google Cloud to accelerate and de-risk the project
This is a familiar problem that is industry-wide. The issue has been widely explored and tried with a number of technologies over several years without producing the scalability and performance results required to make this an appropriate and feasible solution. Google Cloud partnered with Max Kelsen to accelerate and de-risk this large and strategic project for a mutual customer.
Technical feasibility took four months, prior to a year-long production pilot of SAVl in a distribution center in Queensland that services over 100 hospitals. After obtaining enough real-world data and experience to validate that the solution was as scalable and as accurate as needed, an Asia-Pacific rollout of the system commenced. SAVI is now live across Johnson & Johnson MedTech’s operations in Australia, New Zealand, and Japan, garnering recognition with a JAISA excellence award.
Google Cloud machine learning is integral to SAVI. Google Cloud’s technologies were a big differentiator for Max Kelsen’s engineering team in delivering the breakthroughs needed at scale, and in production, to meet Johnson & Johnson MedTech’s needs.
Reducing checking and documentation time
Running SAVI in Google Cloud has reduced the time Johnson & Johnson MedTech needs to check and document inspections of these surgical instrument sets by over 40%. The application also delivers consistent measurable quality that is often hard to measure at scale when using manual processes. During the pandemic, the application enabled Johnson & Johnson MedTech to operate with a lower headcount for the same volume output, enabling the organization to quickly service a backlog of waiting list surgeries.
In addition, the automation delivered with SAVI has reduced the time required to bring technicians up to speed on quality control processes, from eight to 12 months down to just three months, enhancing productivity and performance while delivering a more robust workforce.
So how does SAVI work in a real-world context? SAVI is deployed via a tablet and a web-based application incorporates an API to photograph the medical device trays, as shown below. Max Kelsen captures the photograph and sends it to a range of different services, via an API endpoint hosted on Google Cloud:
- Image information is stored in Cloud Storage
- Data relating to the trays is stored in Cloud SQL for PostgreSQL
- APIs and web UI components run in CloudRun
- Analytics data is stored within BigQuery
Once this tray and device onboarding stage is completed, the next step is to perform inferences from the images and data. By hosting online models with Kubeflow model serving on GKE, we enable a model to identify all the instruments in a tray at low latency.
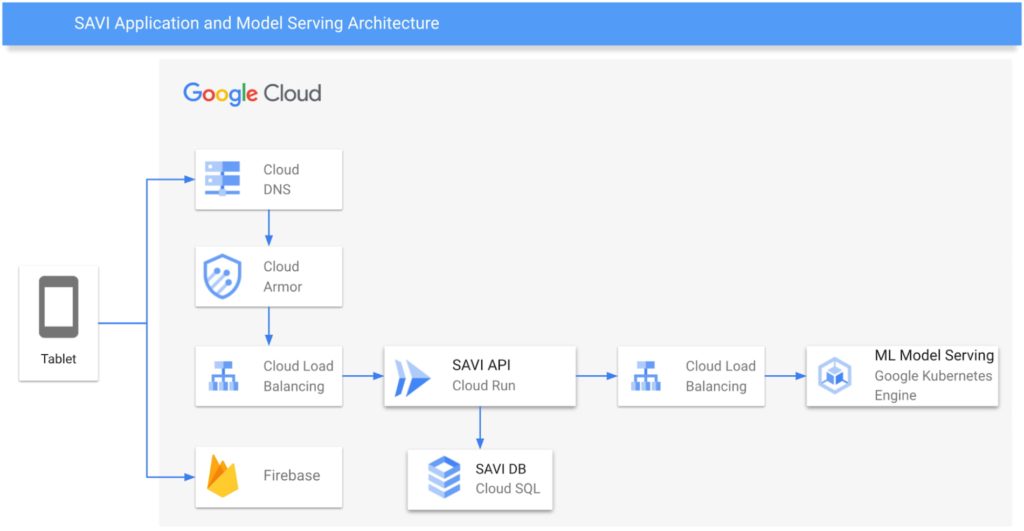
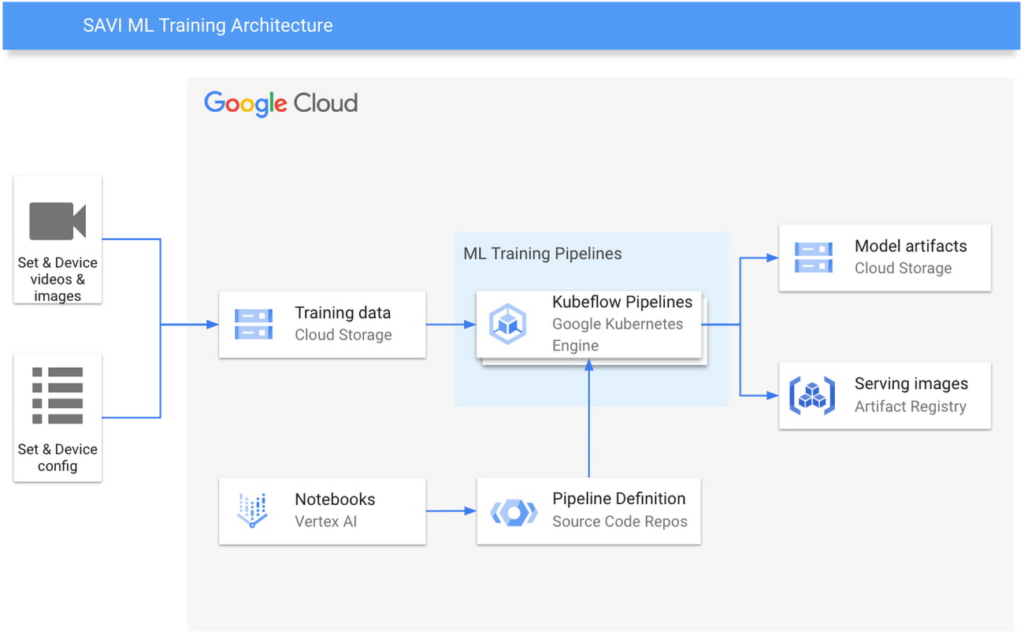
Vertex AI Workbench notebooks are used for data exploration and modeling. Kubeflow training pipelines hosted on GKE are executed to produce machine learning models for specific surgical instrument sets. Several hundred machine learning models are then hosted with Kubeflow model serving on GKE, with state and analytics managed using Firebase. Using machine learning to infer from images whether any devices are incorrectly placed, dirty, or otherwise not fit for purpose, the data is then returned to the tablet for the user to respond accordingly.
Based on our success to date with SAVI, it is now available on Google Cloud Marketplace to help healthcare organizations achieve machine learning-powered efficiencies across a range of use cases, and ultimately improve patient safety and outcomes.
Not to be confused with the usage of Visual Inspection Model (Assembly) available in Vertex AI Vision
Time-series Model on Google Cloud Allows Better Transparency on Fishing and Marine Activities

4401
Of your peers have already read this article.
3:30 Minutes
The most insightful time you'll spend today!
Who would have known that today technology would enable us with the ability to use machine learning to track vessel activity, and make pattern inferences to help address IUU (illegal, unreported, and unregulated) fishing activities. What’s even more noteworthy is that we now have the computing power to share this information publicly in order to enable fair and sustainable use of our ocean.
An amazing group of humans at the nonprofit Global Fishing Watch took on this massive big data challenge and succeeded. You can immediately access their dynamic map on their website globalfishingwatch.org/map that is bringing greater transparency to fishing activity and supporting the creation and management of marine protected areas throughout the world.
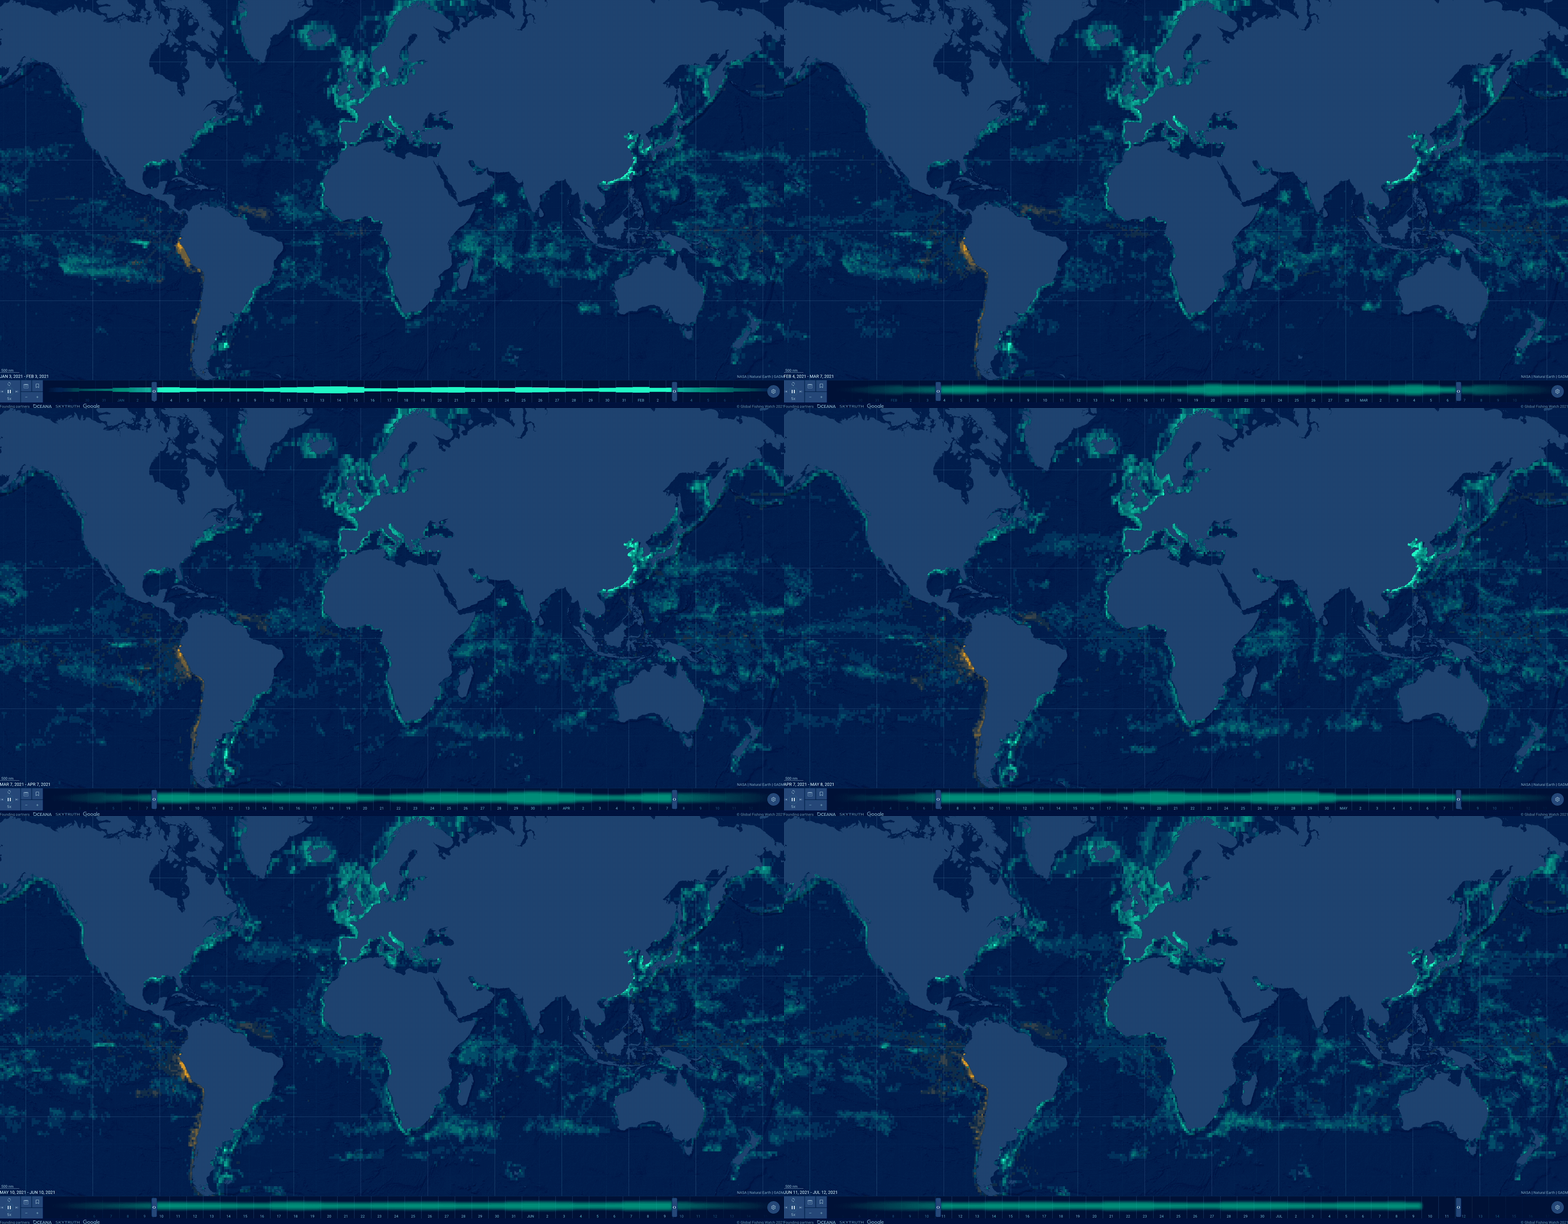
In our second episode of our People and Planet AI series we were inspired by their ML solution to this challenge, and we built a short video and sample with all the relevant code you need to get started with building a basic time-series classification model in Google Cloud, and visualize it in an interactive map.
Architecture
These are the components used to build a model for this sample:
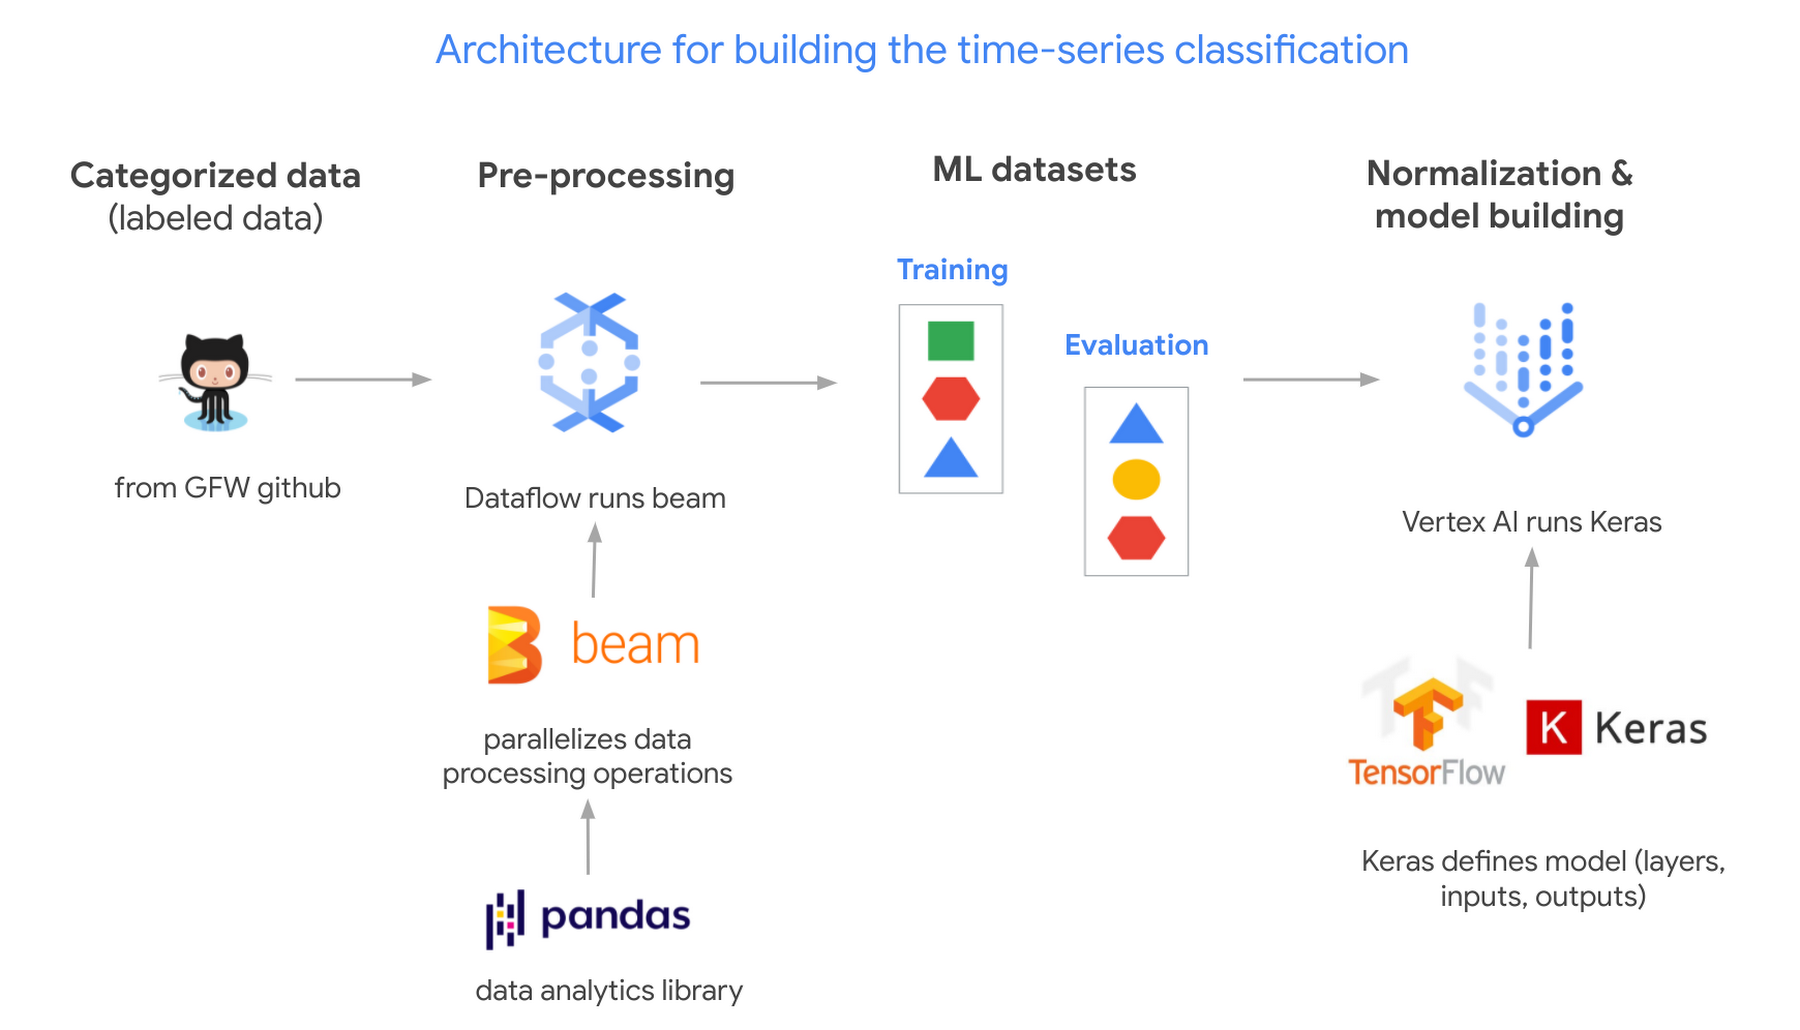
- Global Fishing Watch GitHub: where we got the data
- Apache Beam: (open source library) runs on Dataflow.
- Dataflow: (Google’s data processing service) creates 2 datasets; 1 for training a model and the other to evaluate its results.
- TensorflowKeras: (high level API library) used to define a machine learning model, which we then train in Vertex AI.
- Vertex AI: (a platform to build, deploy, and scale ML models) we train and output the model.
Pricing and steps
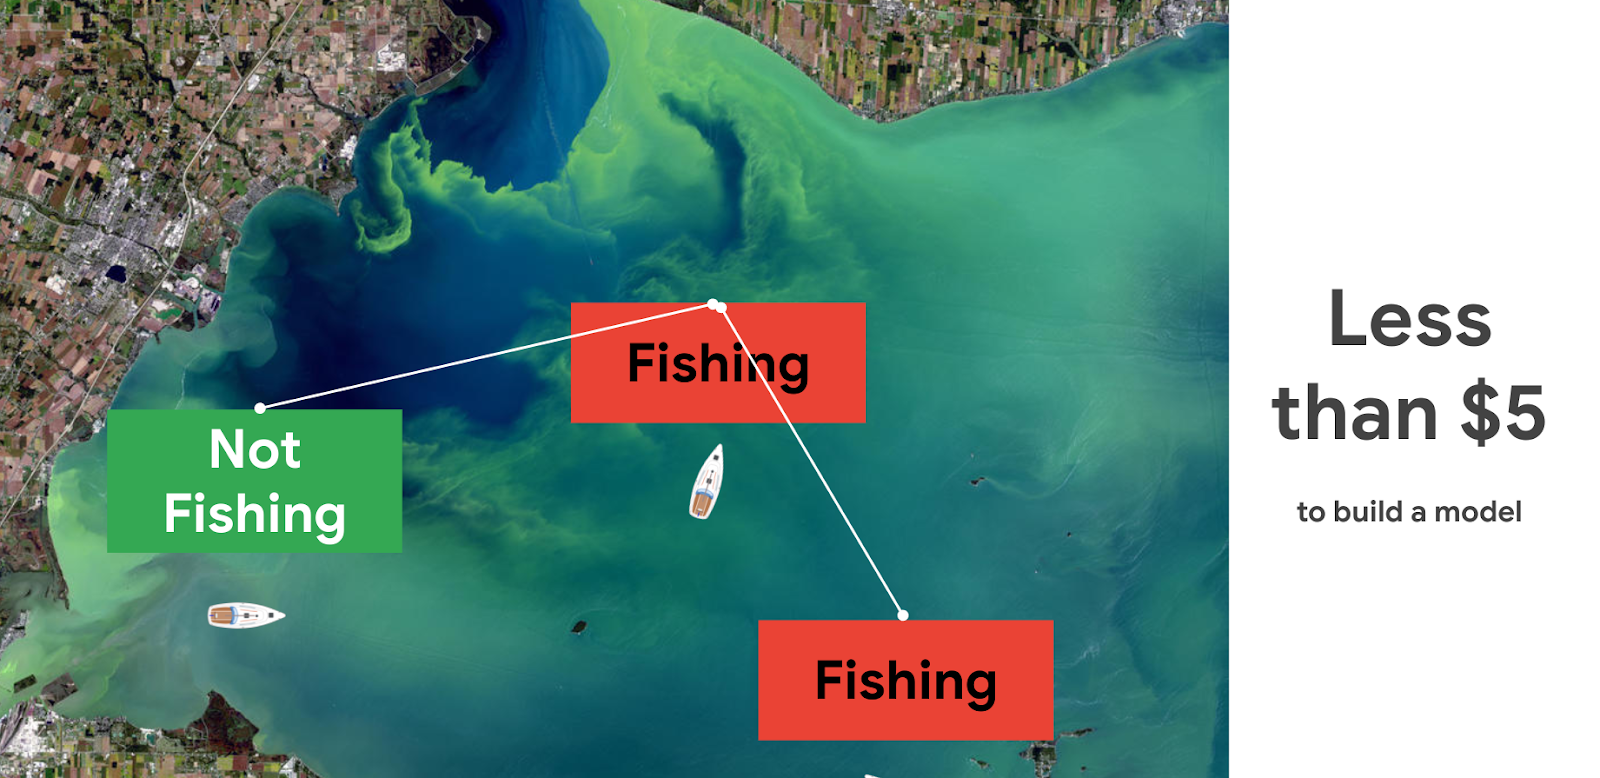
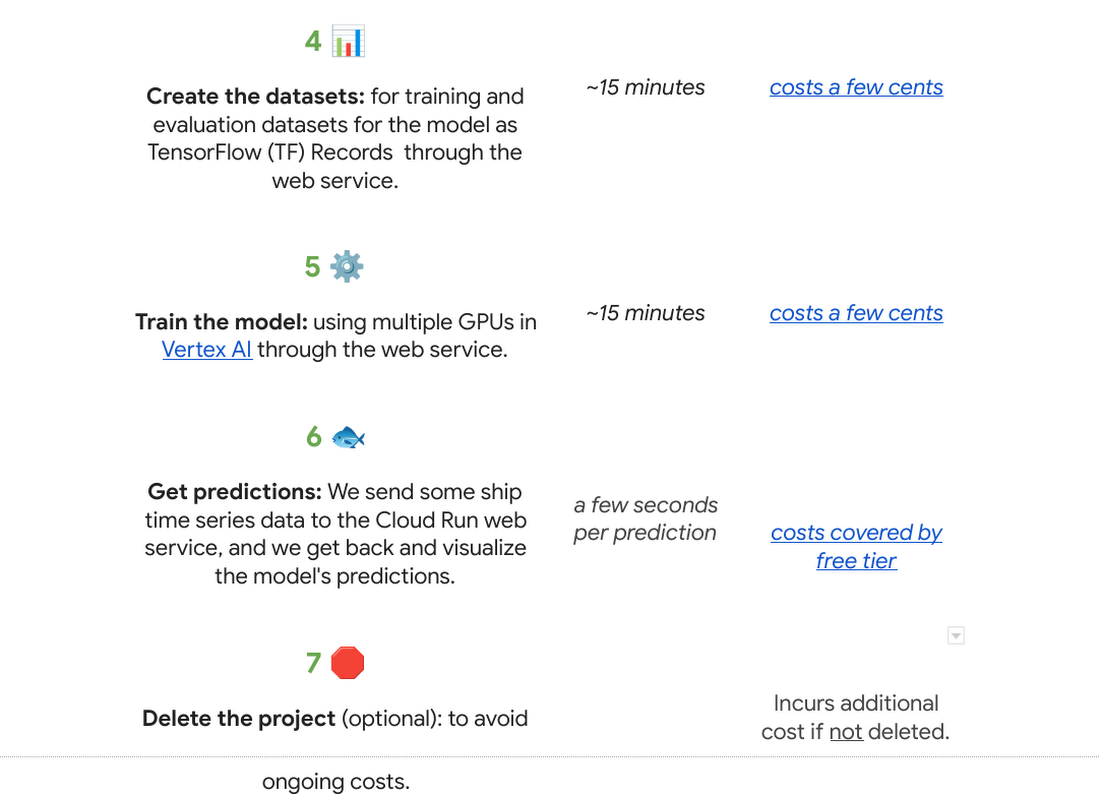
The total cost to run this solution was less than $5.
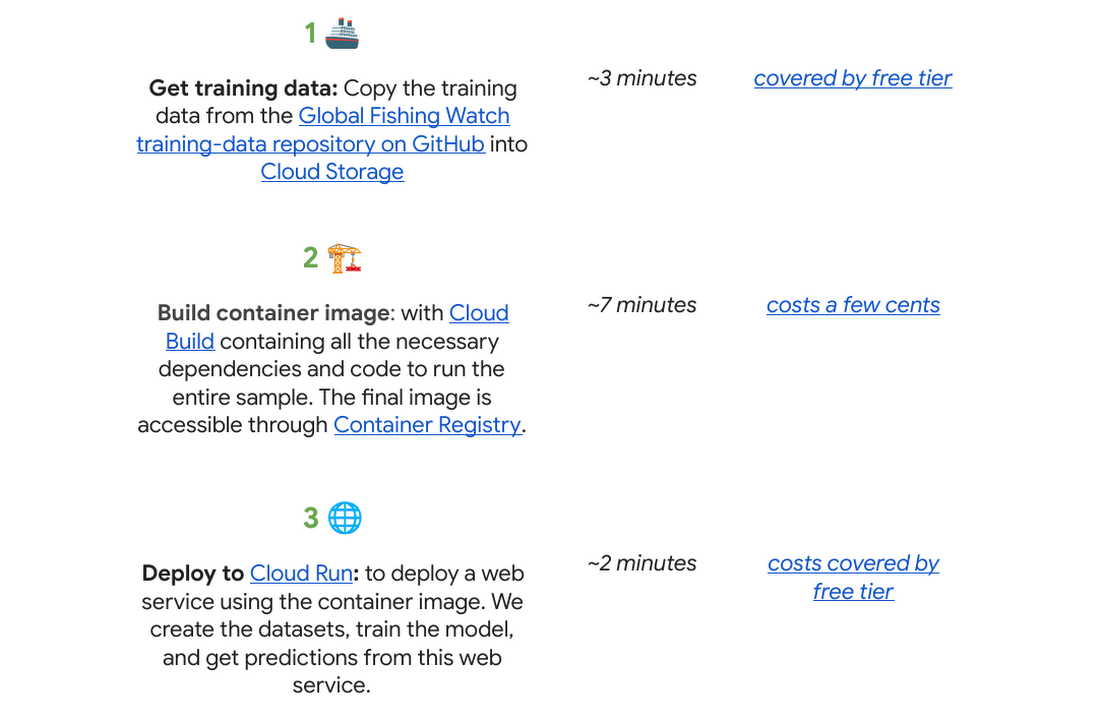
There are seven steps we went through with their approximate time and cost:
Why do we use a time series classification model?
Vessels in the ocean are constantly moving, which creates distinctive patterns from a satellite view.
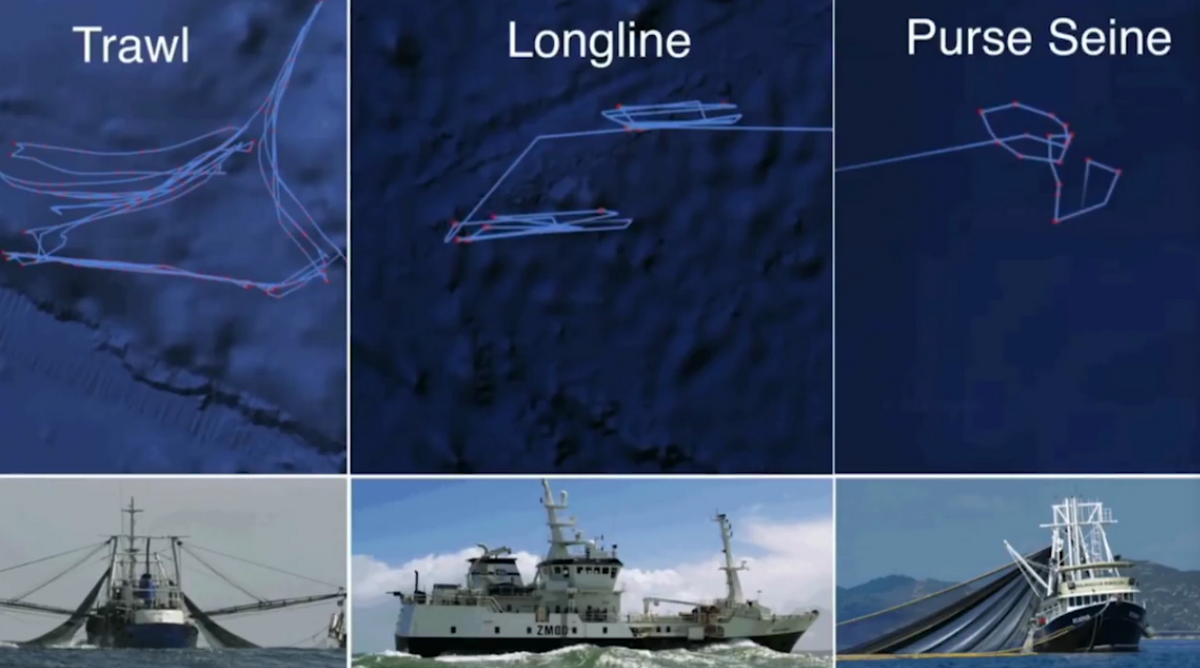
We can train a model to recognize the shapes of a vessel’s trajectory. Large vessels are required to use the automatic identification system, or AIS. The GPS-like transponders regularly broadcast a vessel’s maritime mobile service identity, or MMSI, and other critical information to nearby ships, as well as to terrestrial and satellite receivers. While AIS is designed to prevent collisions and boost overall safety at sea, it has turned out to be an invaluable system for monitoring vessels and detecting suspicious fishing behavior globally.

One tricky part is that the MMSI data location signal (which includes a timestamp, latitude, longitude, distance from port, and more) is not emitted at regular intervals. AIS broadcast frequency changes with vessel speed (faster at higher speeds), and not all AIS messages that are broadcast are received – terrestrial receivers require line-of-sight, satellites must be overhead, and high vessel density can cause signal interference. For example, AIS messages might be received frequently as a vessel leaves the docks and operates near shore, then less frequently as they move further offshore until satellite reception improves. This is challenging for a machine learning model to interpret. There are too many gaps in the data, which makes it hard to predict.
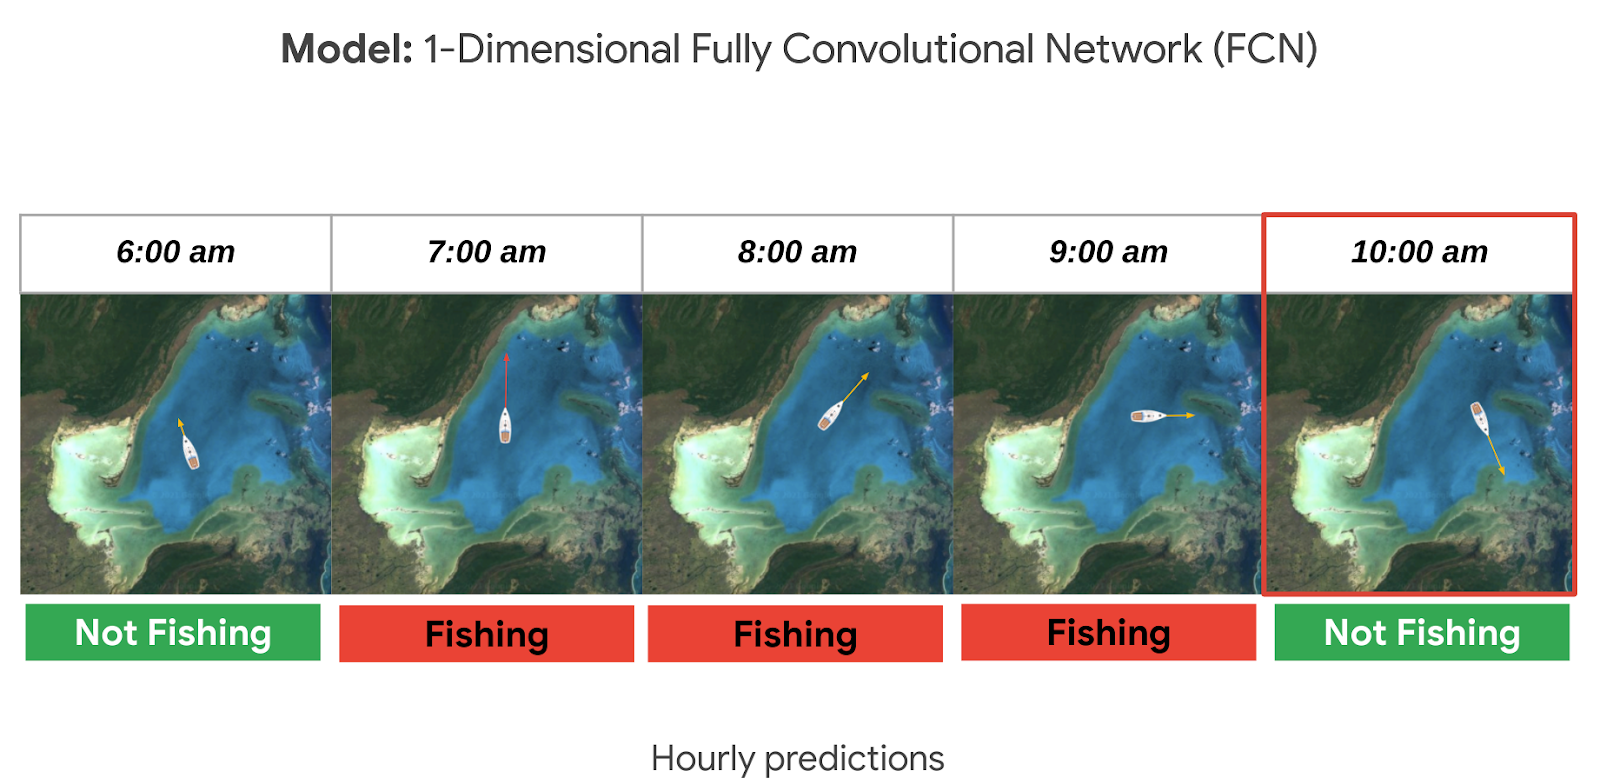
A way to solve this is to normalize the data and generate fixed-sized hourly windows. Then the model can predict if the vessel is fishing or not fishing for each hour.

It could be hard to know if a ship is fishing or not by just looking at its current position, speed, and direction. So we look at the data from the past as well, looking at the future could also be an option if we don’t need to do real time predictions. For this sample, it seemed reasonable to look 24 hours into the past to make a prediction. This means we need at least 25 hours of data to make a prediction for a single hour (24 hours in the past + 1 current hour). But we could predict longer time sequences as well. In general, to get hourly predictions, we need (n+24) hours of data.
Options to deploy and access the model
For this sample specifically we used Cloud Run to host the model as a web app so that other apps can call it to make predictions on an ongoing basis; this is our favorite in terms of pricing if you need to access your model from the internet over an extended period of time (charged per prediction request). You can also host it directly from Vertex AI where you trained and built the model, just note there is an hourly cost for using those VMs even if they are idle. If you do not need to access the model over the internet, you can make predictions locally or download the model onto a microcontroller if you have an IoT sensor strategy.

Want to go deeper?
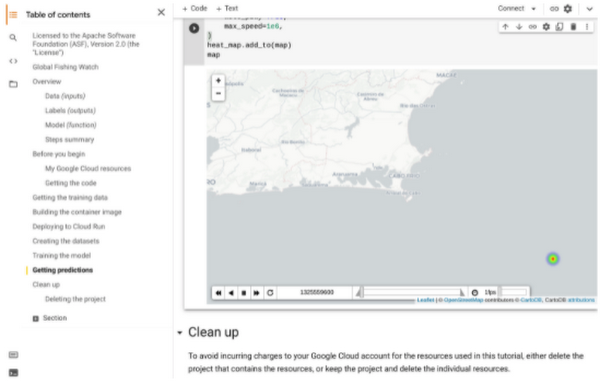
If you found this project interesting and would like to dive deeper either into the specifics of the thought process behind each step of this solution or even run through the code in your own project (or test project); we invite you to check out our interactive sample hosted on Colab, which is a free Jupyter notebook. It serves as a guide with all the steps to run the sample, including visualizing the predictions on a dynamically moving map using an open source Python library called Folium.
There’s no prior experience required! Just click “open in Colab” which is linked at the bottom of GitHub.
You will need a Google Cloud Platform project. If you do not have a Google Cloud project you can create one with the free $300 Google Cloud credit, you just need to ensure you set up billing, and later delete the project after testing the desired sample.
🌏🌎🌍 We hope to inspire you to build other beautiful climate-related solutions.
More Relevant Stories for Your Company

How Google Cloud Solutions Help Retail Firms to ABP(Always Be Pivoting)
For years, retailers have been told that they must embrace a litany of new technologies, trends, and imperatives like online shopping, mobile apps, omnichannel, and digital transformation. In search of growth and stability, retailers adopted many of these, only to realize that for every box they ticked, there was another

Start Delivering Business Results with the Three AI Agents
When it comes to the adoption of artificial intelligence (AI), we have reached a tipping point. Technologies that were once accessible to only a few are now broadly available. This has led to an explosion in AI investment. However, according to research firm McKinsey, for AI to make a sizable

Use No-Cost Solutions To Bring ML Into Your Medical Research
There’s a lot we can learn from combining technology with science to help support the development of amazing discoveries. By using an AI system to predict protein shapes, we have the potential to accelerate research in every field of biology. Inside every cell in your body, billions of tiny molecular

Unifying Data and AI: Bringing Unstructured Data Analytics to BigQuery
Over one third of organizations believe that data analytics and machine learning have the most potential to significantly alter the way they run business over the next 3 to 5 years. However, only 26% of organizations are data driven. One of the biggest reasons for this gap is that a
