





STAC-M3 Tick History Analytics in Google Cloud Benchmark Results Reveals it is 18X Faster than Previous Version

4765
Of your peers have already read this article.
5:00 Minutes
The most insightful time you'll spend today!
The Securities Technology Analysis Center (STAC®), an organization that improves technology discovery and assessment in the finance industry through dialog and research, recently audited the STAC-M3™ benchmark suite on Google Cloud (SUT ID KDB211210). These enterprise tick-analytics benchmarks assess the ability of a solution stack such as database software, servers, and storage, to perform a variety of I/O-intensive and compute-intensive operations on historical market data.
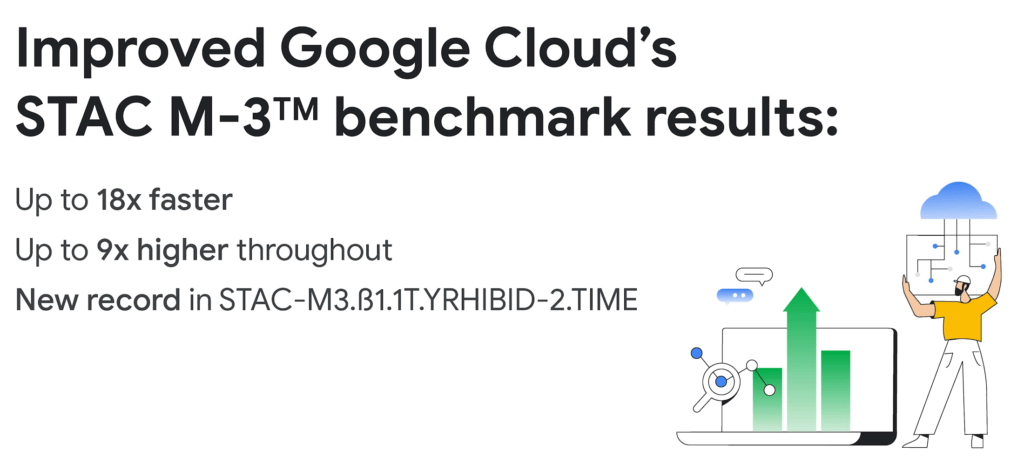
Following up on our previous STAC-M3 benchmark audit (SUT ID KDB181001), a redesigned Google Cloud architecture leveraged the most recent version of kdb+ 4.0, the time-series database from KX, and achieved significant improvements: 35 out of 41 benchmarks ran faster in the new cluster – by up to 18x faster than Google Cloud’s prior results. Key highlights include the following:
Compared to the previous STAC-M3 Antuco suite results on Google Cloud:
- Was faster in 13 of 17 mean response-time benchmarks
- Was 18x faster – a 94% reduction in run time – in the version of Year-High Bid that allows caching (STAC-M3.ß1.1T.YRHIBID-2.TIME), which also set an overall record for all published results
- Had 9x higher throughput in Year-High Bid (STAC-M3.ß1.1T.YRHIBID.MBPS)
Compared to the previous STAC-M3 Kanaga suite results on Google Cloud:
- Was faster in 22 of 24 mean response-time benchmarks
- Was over 10x faster in all four Market Snapshot workloads (STAC-M3.ß1.10T.YR[2,3,4,5]-MKTSNAP.TIME)
- Had 5x the throughput in Year-High Bid involving 2 years of data (STAC-M3.ß1.1T.2YRHIBID.MBPS)
“The STAC-M3 standard was designed by financial firms to reveal the performance of tick analytics stacks. Generational improvements like those exhibited by Google Cloud’s most recent STAC-M3 audit, are important data points for firms evaluating new architectures for performance and scale,” said Peter Nabicht, President of STAC.
These performance results may translate to real-world advantages that may be difficult for investment firms to achieve in static and costly on-premises environments: immediate answers in high data velocity markets, more thoroughly explored research theories by adding data or new quantitative approaches, and reduced costs by releasing cloud resources more quickly.
STAC-M3: High-speed tick analytics
Designing for record-breaking results
In our STAC-M3 audit, the stack under test (SUT) was designed to take advantage of horizontal scalability in the cloud by sharding data across independent compute nodes. The cluster of 12 Google Compute Engine N2 instances was powered by Intel Cascade Lake, with each node using 32 vCPUs, 160GiB of memory, and 9TiB of local NVMe SSDs. The full STAC-M3 Antuco and Kanaga data set was split across the cluster and kdb+ scripts distributed queries between nodes.
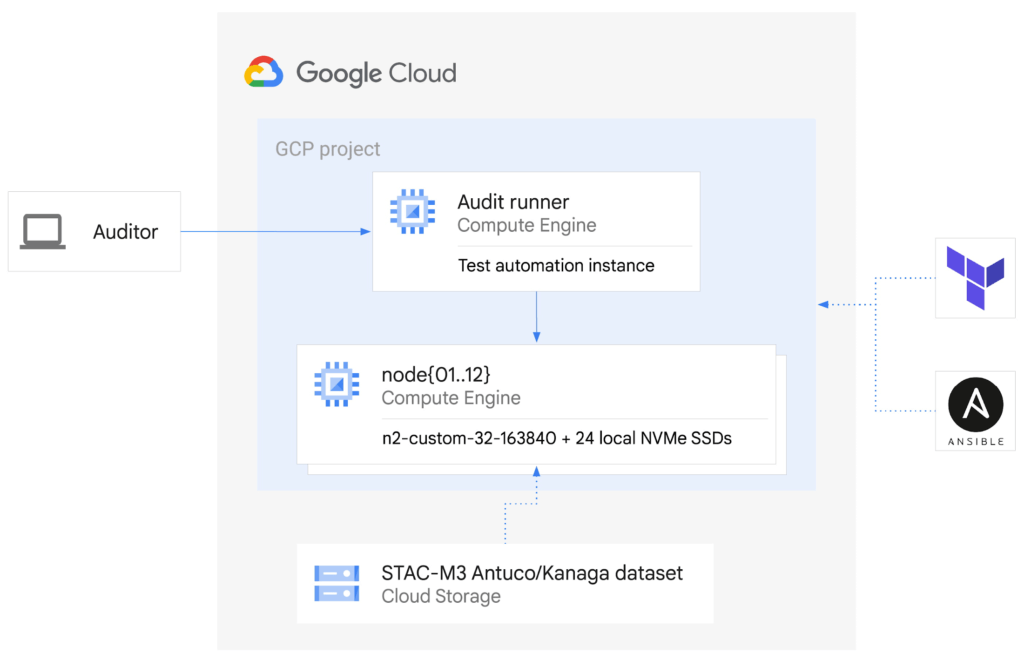
This configuration was the sweet spot for this particular workload, but this architecture does not need to be limited to 12 nodes for other workloads – the data sharding algorithm could scale to any number of nodes as required by workload demands. Since scaling out the cluster in this manner increases the total pool of available storage, this architecture can continue scaling out to petabytes of storage across hundreds of nodes.
The ability to spawn large clusters with hundreds of thousands of processors on demand at low cost, and to delete the resources when jobs complete, not only changes the economics of running computations on large financial data sets, it also opens up opportunities to explore solutions to new types of problems that were previously overlooked due to the constraints of fixed hardware on-premises. You can check the pricing of this VM configuration using the Google Cloud Pricing Calculator. The costs can be reduced even further by using preemptible VMs.
While the new cluster used a similar number of nodes, cores, and total memory as the previously-audited cluster, the redesigned architecture allowed us to harness the low latency and high throughput of Local NVMe SSDs.
Resources on demand
The cluster was created on demand using Terraform and Ansible during testing and auditing. The use of infrastructure as code (IaC) techniques ensured that the cluster, fully loaded with the STAC-M3 data set, could be created when needed and then removed when benchmarking was complete. It also meant that the cluster configuration was enforced by code on each deployment, eliminating configuration variance and drift. The full IaC definition to create the cluster can be retrieved from the report in the STAC Vault.
Each time the cluster was created, data was streamed to Local SSDs from Google Cloud Storage, our reliable and secure object storage, at up to the line rate of 32Gbps per node. The entire 57TiB STAC-M3 Antuco and Kanaga data was replicated from Cloud Storage to local storage in approximately 20 minutes.
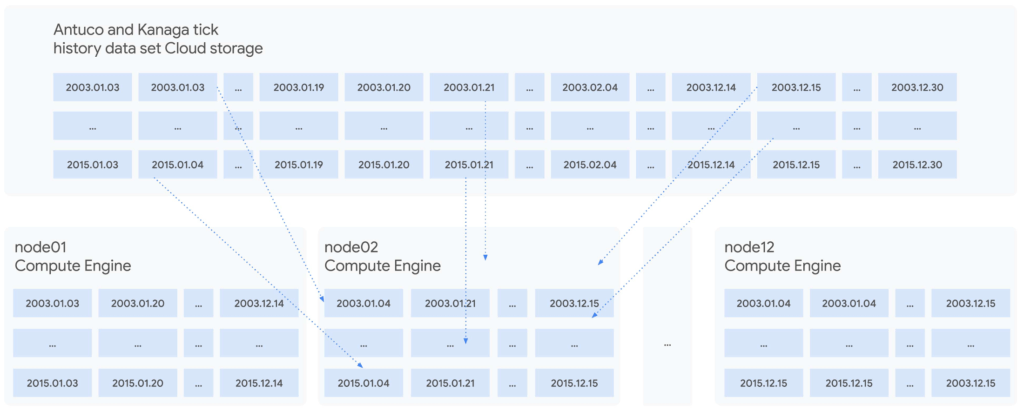
Since each node was independent and responsible for its own shard of data, doubling the cluster size would cut the synchronization time in half, or copy twice as much data in the same amount of time. Using higher bandwidth options of up to 100Gbps would triple the possible throughput for a relatively small incremental cost, trading an approximately 11%-23% price increase at current list prices for a 200% data synchronization performance increase. Taking advantage of fast networking to cache sharded data in parallel to a large cluster makes storing bulk data in Cloud Storage viable for even the largest workloads.
For quants working on vast data sets in sprawling compute clusters, the ability to fully describe infrastructure as declarative code, create elastic resources on demand, cache data quickly from cheap bulk storage, and turn resources off when computations complete is a dramatic change compared to waiting months to grow on-premises clusters – and a compelling reason to use cloud infrastructure.
To see how we designed and optimized the cluster for API-driven cloud resources, read our new whitepaper.
STAC-A2™: Calculating derivatives risk
In 2018, we showed that cloud instances can outperform bare metal when analyzing large tick history data sets in the demanding suite of STAC-M3 benchmarks. Last year, Google Cloud’s partner Appsbroker showed that the same was true for calculating derivatives risk in STAC-A2 on Google Cloud. You can read about how Appsbroker built its record-breaking STAC-A2 compute cluster on Google Cloud in its blog post, or access the STAC Report directly. Here are the highlights:
Compared to all other publicly reported solutions, this solution, based on a cluster of 10 virtual machines, had:
- The highest throughput (STAC-A2.β2.HPORTFOLIO.SPEED)
- The fastest cold time in the large problem size (STAC-A2.β2.GREEKS.10-100k-1260.TIME.COLD)
Compared to a solution involving an 8-node, on-premises cluster (SUT ID INTC181012), this 10-node, cloud-based solution:
- Had 5 times the maximum paths (STAC-A2.β2.GREEKS.MAX_PATHS)
- Had 10% greater throughput (STAC-A2.β2.HPORTFOLIO.SPEED)
- Was 18% faster in cold runs of the large problem size (STAC-A2.β2.GREEKS.10-100k-1260.TIME)
- Was 9% faster in cold runs of the baseline problem size (STAC-A2.β2.GREEKS.TIME.COLD)
Finding market advantages with Google Cloud
Across the investment management industry, every firm is seeking many of the same competitive advantages. However, finding unique opportunities and managing larger and larger data sets is becoming a major strain. Cloud is fundamentally changing how quants tackle the problem while empowering them to manage risk and generate higher returns.
Building on-premises computing clusters with tens or hundreds of thousands of cores and petabytes of storage requires huge up-front investments and lead time measured in months or years. Google Cloud makes the same scale available to its customers, provisioned on demand and paid per use. More importantly, the elasticity of cloud resources enables agility that is simply not available in a fixed data center cluster – the agility to explore, experiment, iterate, and respond to markets faster than before.
Scaling out to tens of thousands of cores in minutes and then removing the resources immediately not only changes the speed at which questions can be answered; it encourages different and more frequent questions, asked simultaneously on many independent clusters, free from the constraints of fixed on-premises hardware.
It is this flexibility and power that enables financial services firms to leverage larger data sets and get results, backtest, research, and analyze large amounts of data, faster and whenever they need it.
Download our whitepaper to learn more about our latest STAC-M3 tick history analytics benchmark results and how to optimize cloud infrastructure for high-speed market data analysis.
New Histogram Features in Cloud Logging Make it Easier to Track Log Volumes, Errors and Anomalies!
3406
Of your peers have already read this article.
2:30 Minutes
The most insightful time you'll spend today!
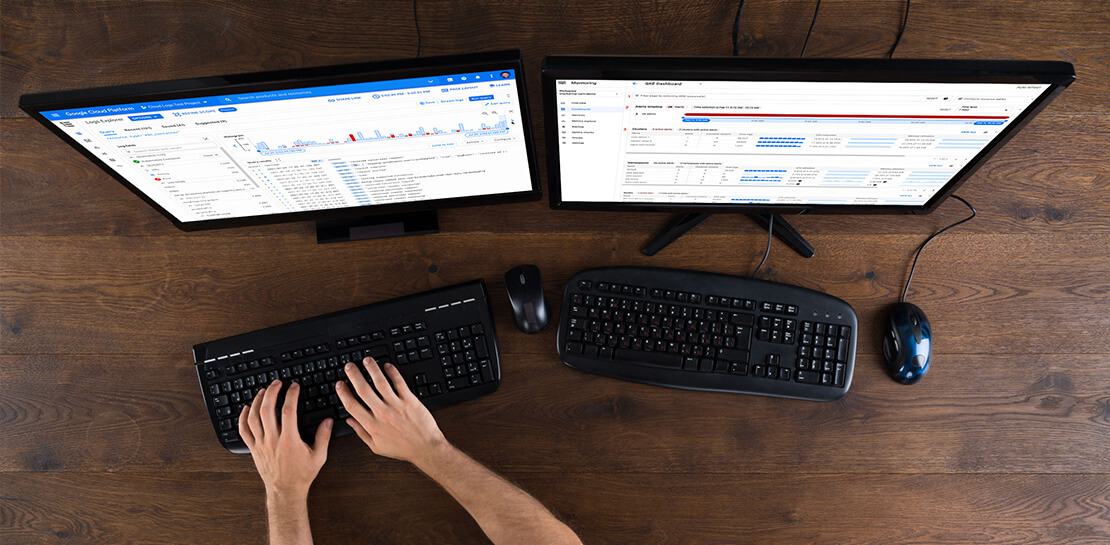
Visualizing trends in your logs is critical when troubleshooting an issue with your application. Using the histogram in Logs Explorer, you can quickly visualize log volumes over time to help spot anomalies, detect when errors started and see a breakdown of log volumes. But static visualizations are not as helpful as having more options for customization during your investigations.
That’s why we’re excited to announce that we recently added three new query controls along with separate colors for log severity to the histogram. These new features make it even easier to refine and analyze your logs by time range. The new histogram controls help find logs before or after the current period, jump to a specific time range represented in a histogram bar and zoom in/out of the current time window in the histogram.
Histogram colors
The histogram now makes it easier to view the breakdown of logs by severity with the introduction of color coding. For example, the severity colors make it easy to spot an increasing number of errors even when the volume of requests is relatively constant. Looking at the histogram below, the red vs blue shading makes it clear that there has been an increase in overall log volume and provides a visual breakdown of errors within that log volume.

Pan left/right to scroll through time
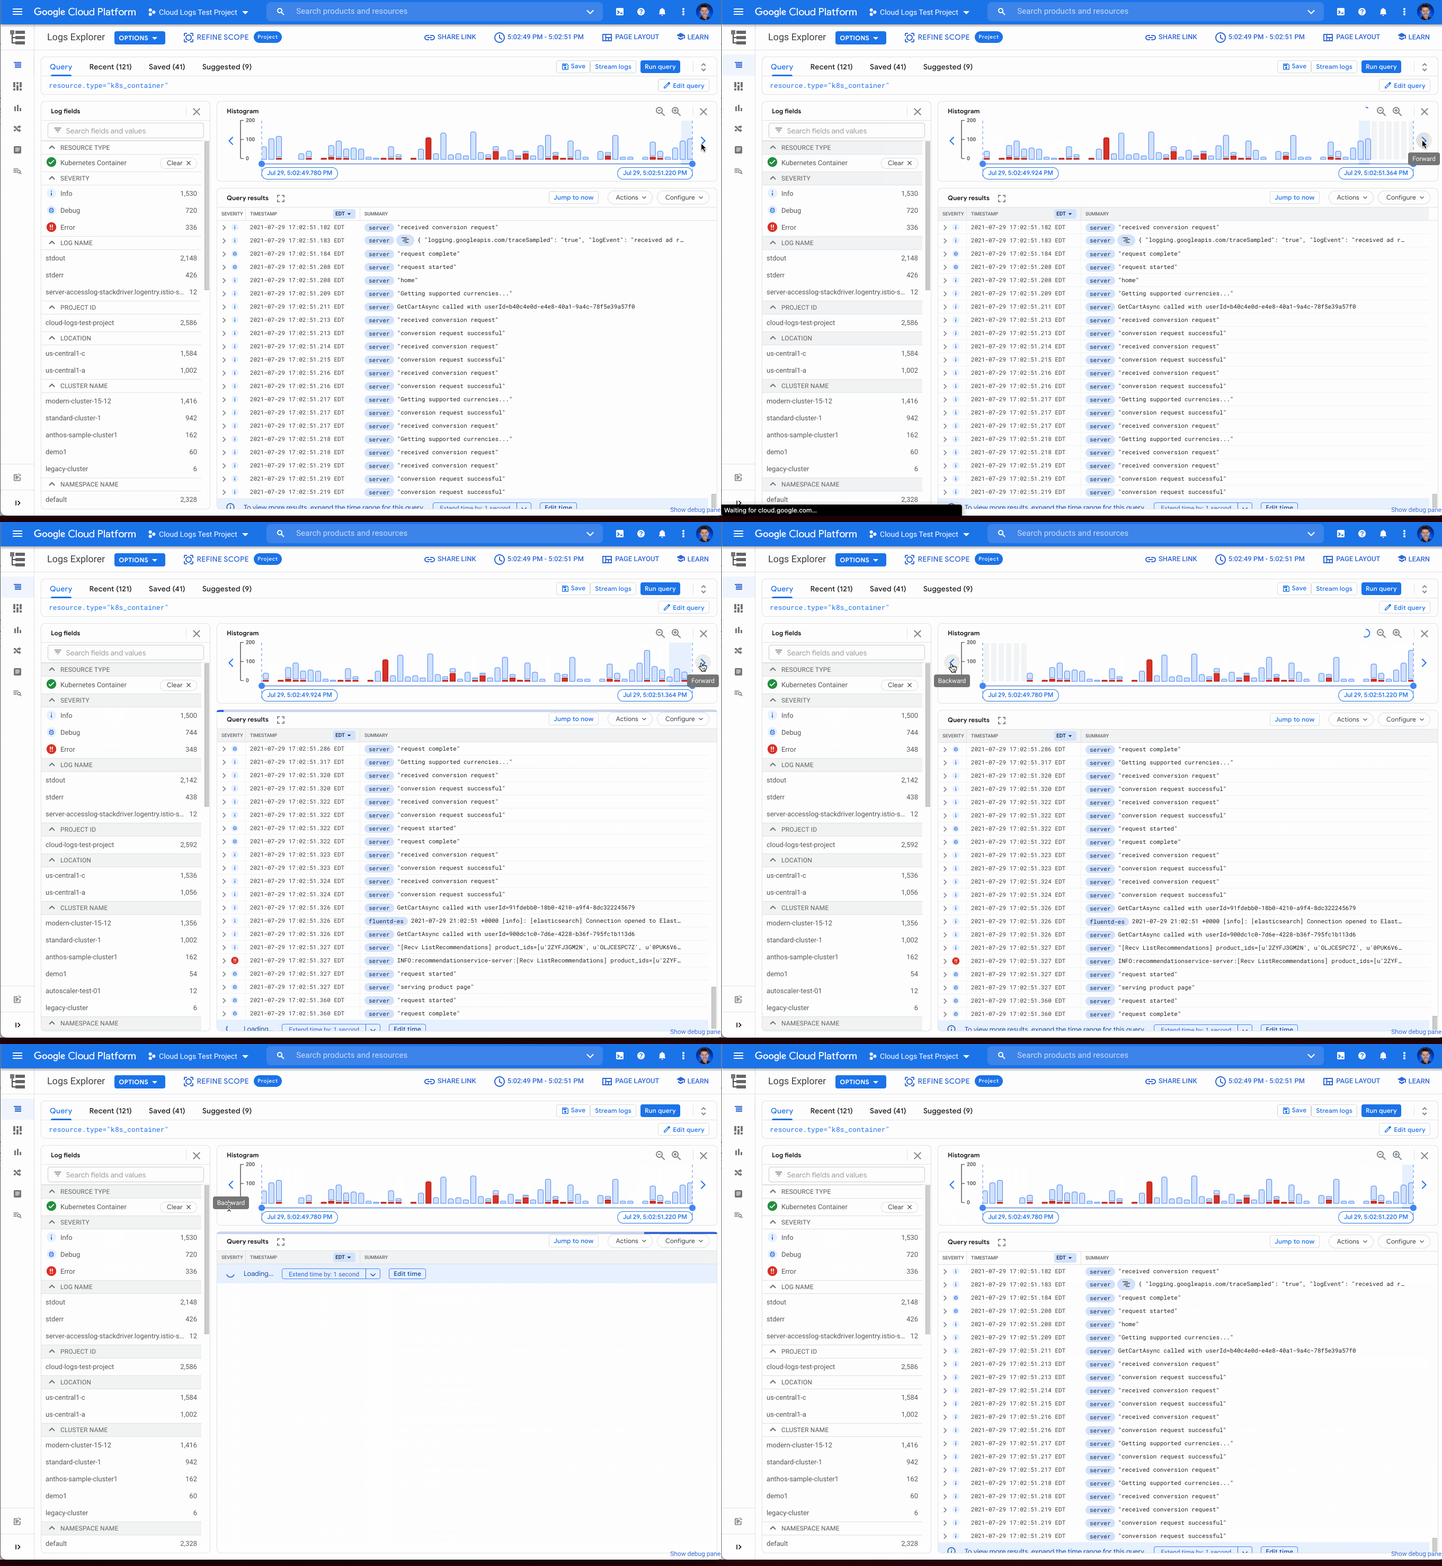
Sometimes in your troubleshooting journey, you may want to look at the logs directly before or after the current set of logs. Perhaps there was an unexpected spike in errors at the beginning of the time range and you need to see the logs in the time period directly preceding the current time range. Pressing the left arrow on the left side of the histogram shifts the time range earlier while the arrow on the right side of the histogram shifts the time range ahead. Either arrow will refine the time range in the query and rerun the query to return the logs in the new time range.
Zooming in or out
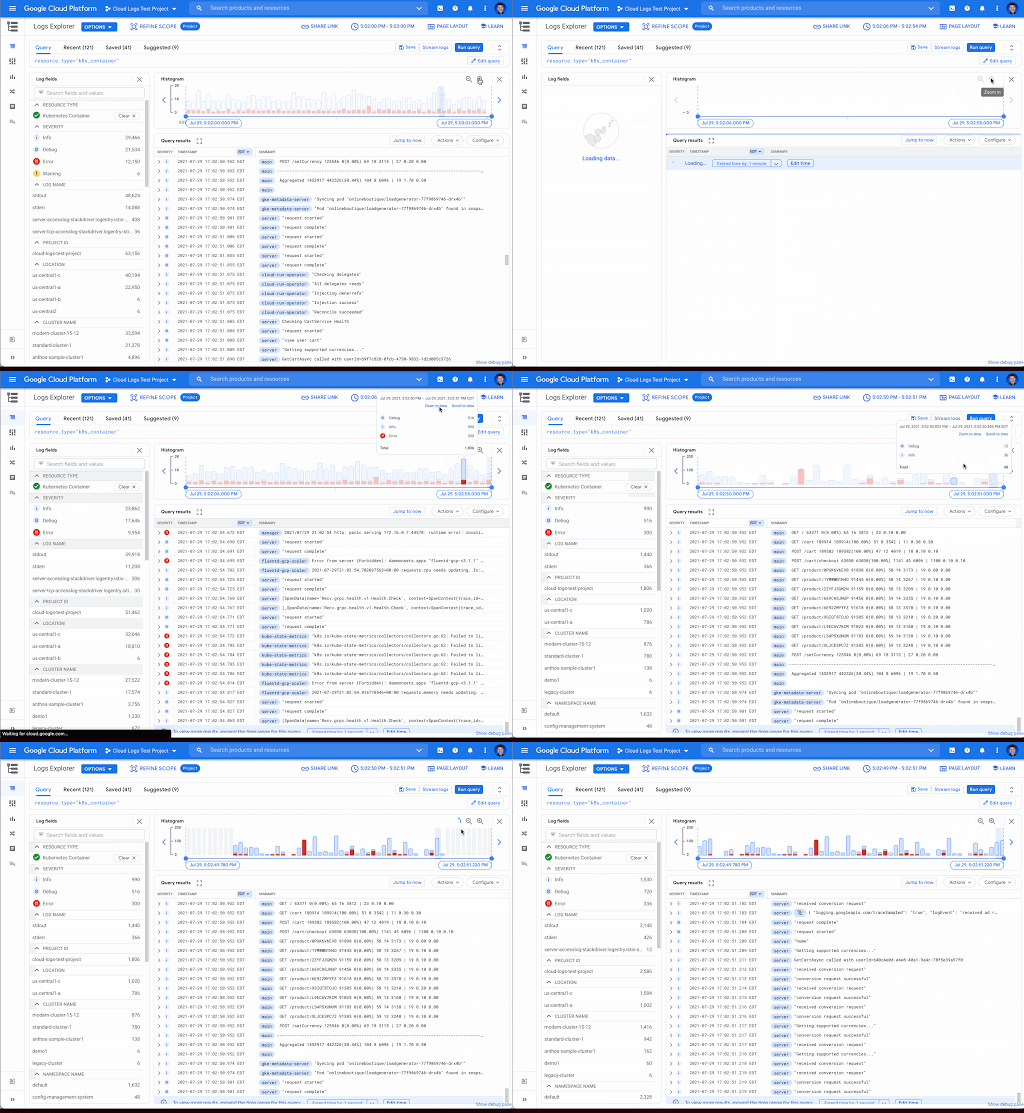
Zooming in or out from a given time range may be useful to visualize fine-grained details or a broader trend Clicking the zoom in or out icons in the upper right corner of the histogram refines the time range in the query and then reruns the query, returning the logs in the newly defined time range.
Scrolling to time
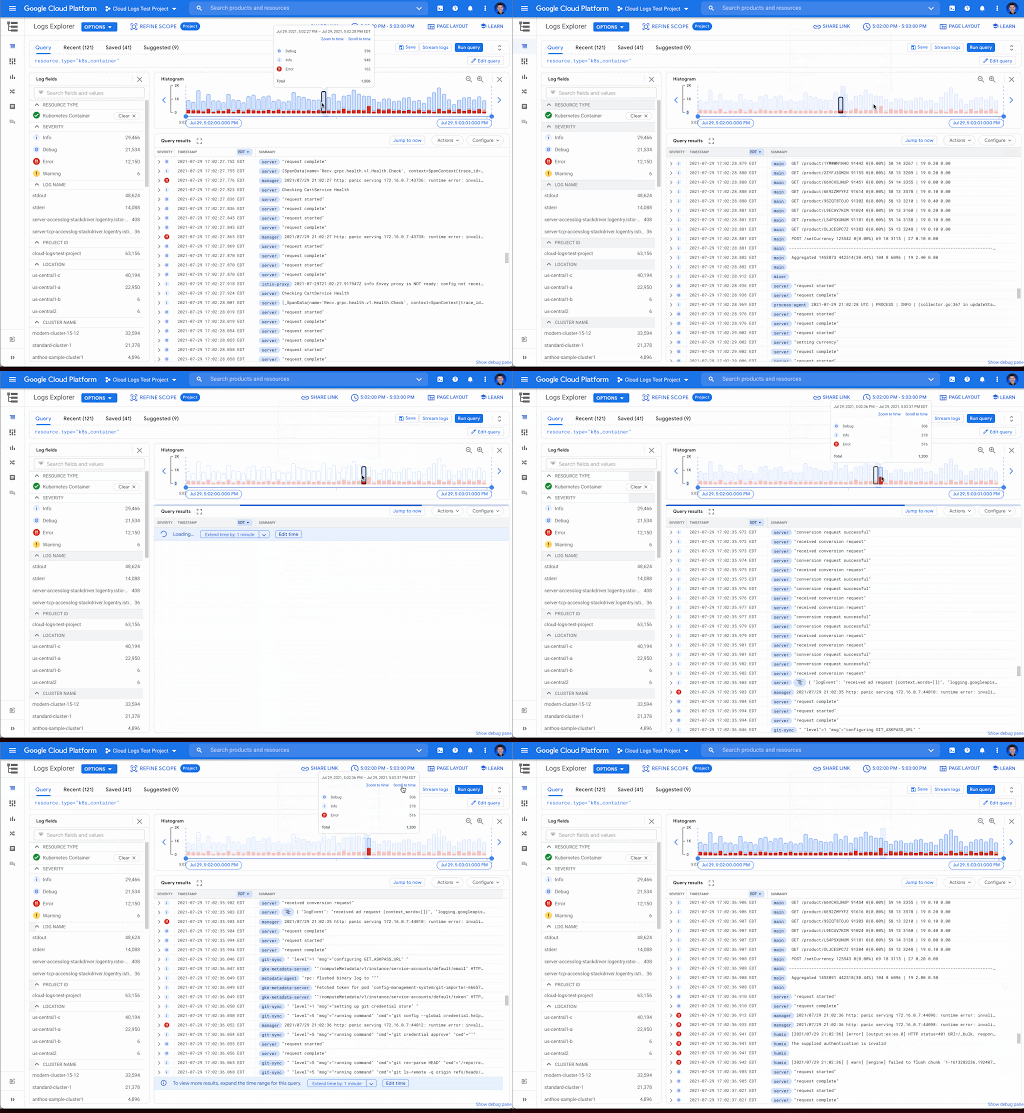
If you see a large spike in logs volume in the histogram, it’s useful to quickly review the logs generated during that spike. Clicking on the histogram bar that contains the spike now scrolls you to the logs generated during that time period.
Where to find the histogram
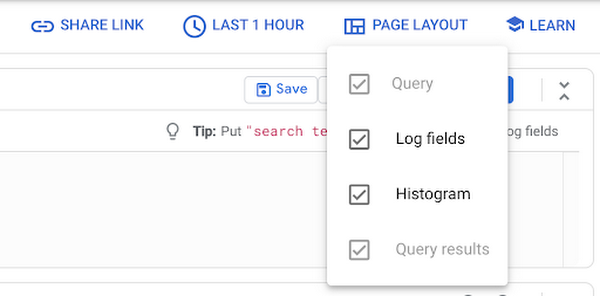
The histogram is a panel in Logs Explorer that can be displayed or hidden using the controls in the Page Layout menu. When you no longer want to display the histogram, click the “X” button in the upper right corner to quickly close it. To open it again, use the same Page Layout menu to enable the histogram display.
Get started with the histogram
These improvements move the histogram from a utility for visualization to an integral part of the troubleshooting journey. We are continuously working to launch new features that make Cloud Logging the best place to troubleshoot your Google Cloud logs. If you are not already a Cloud Logging user, review this getting started documentation or watch a quick video on troubleshooting services on Google Kubernetes Engine (GKE) to learn more. If you have specific questions or feedback, please join the discussion on our Google Cloud Community, Cloud Operations page.
Google Cloud VMware Engine Achieves HIPAA Compliance
6975
Of your peers have already read this article.
1:30 Minutes
The most insightful time you'll spend today!
We are excited to announce that as of April 1, 2021, Google Cloud VMware Engine is covered under the Google Cloud Business Associate Agreement (BAA), meaning it has achieved HIPAA compliance. Healthcare organizations can now migrate and run their HIPAA-compliant VMware workloads in a fully compatible VMware Cloud Verified stack running natively in Google Cloud with Google Cloud VMware Engine, without changes or re-architecture to tools, processes, or applications.
Healthcare organizations increasingly use cloud platforms to personalize patient care, analyze large datasets more effectively, enhance research and development collaboration, and share medical knowledge. Leveraging cloud platforms can also help healthcare organizations increase the privacy and security of information systems, including protected health information (PHI), and, as a result, better comply with applicable laws and regulations while reducing the burden of compliance. For PHI, the Health Insurance Portability and Accountability Act of 1996 (HIPAA) set standards in the United States to protect individually identifiable health information. HIPAA applies to health plans, most healthcare providers, and healthcare clearinghouses that manage PHI electronically, and to persons or entities that perform certain functions on their behalf.
With Google Cloud, organizations can leverage solutions that enable secure, continuous patient care and data-driven clinical and operational decisions with ease, while being empowered with collaboration and productivity tools. Further, Google Cloud Platform supports HIPAA compliance. We offer HIPAA-regulated customers the same products at the same pricing that is available to all customers, unlike many other cloud providers.
For healthcare organizations that leverage VMware on-premises, having a consistent, cloud-integrated platform that provides seamless access to native cloud services unlocks the opportunity to extend, migrate, and modernize healthcare IT infrastructure and applications in a fast, low-risk manner at their own pace. This is especially important for mission-critical healthcare provider workloads, where having a low-risk way to adopt the cloud is important. Google Cloud VMware Engine offers that solution. By achieving coverage under Google Cloud’s BAA, Google Cloud VMware Engine enables healthcare organizations to realize the benefits of cloud computing and stay on track with their HIPAA compliance efforts without additional complexity. This is very relevant in hybrid scenarios, where customers would like to leverage other native cloud services such as analytics and big data processing, without having to enter into multiple BAAs.
Google Cloud VMware Engine offers dedicated, isolated software-defined datacenter environments with fully redundant and dedicated 100 Gbps networking that are suitable for healthcare organizations to run applications storing and processing PHI data. Customers have the ability to encrypt their virtual storage area network (vSAN) using an external key management server. Healthcare customers can run their workloads in a native VMware environment—vSphere, vCenter, vSAN, NSX-T, and HCX—while benefiting from Google Cloud’s highly performant infrastructure to meet the needs of their workloads. Customers can connect their VMware applications to native Google Cloud services such as BigQuery and artificial intelligence (AI) to derive new insights from existing data and quickly make informed decisions.
Protecting against and mitigating the impact of ransomware attacks is top-of-mind for Healthcare organizations. This requires building a cyber resilience program and back-up strategy to prepare for how users can restore core systems or assets affected by a security (in this case, ransomware) incident. This is a critical function for supporting recovery timelines and lessening the impact of a cyber event so organizations can get back to operating their business. Google Cloud VMware Engine in combination with Google Cloud first party solutions such as Actifio Go, or partner solutions such as NetApp CVO can provide an efficient way to recover incremental point-in-time backups along with on-demand provisioning of new compute to recover both data and infrastructure from Ransomware attacks quickly and efficiently.
Healthcare customers can also use Google Cloud VMware Engine as a disaster recovery (DR) target for their on-premises VMware workloads. Healthcare organizations also need a business continuity plan for their mission critical applications. When a disaster occurs, hospitals need their data protected so they can quickly get back to treating patients. It is a HIPAA requirement that healthcare organizations must be able to recover from a natural disaster. Google Cloud VMware Engine offers a like-for-like cost-effective DR target for these customers. The DR environment can be operated without new training using the same tools as their on-premises deployment. Google Cloud VMware Engine is currently available in 12 regions across the globe including three regions in the US, which means our regional and multi-national customers can take advantage of this service for geographic diversification as well.
If you are interested in understanding more and taking advantage of Google Cloud VMware Engine, contact your Google sales team now.
For details, see HIPAA compliance on Google Cloud Platform.
Mrs. T’s Pierogies Moves SAP Systems to Google Cloud for Faster Analytics Capabilities for its SAP Data

6853
Of your peers have already read this article.
1:30 Minutes
The most insightful time you'll spend today!
Pierogies might just be the ultimate comfort food. But when Mrs. T’s Pierogies — the leading manufacturer of frozen pierogies in the US — learned it needed to transition its existing on-premises SAP ECC to S/4HANA, the company sought a little comfort for itself.
Founded in 1952, Mrs. T’s Pierogies now produces more than 650 million pierogies a year. Moving that many pierogies requires a powerful ERP system — and an equally powerful IT infrastructure on which to run it. Mrs. T’s realized that the SAP-mandated transition of its ERP solution to SAP S/4HANA was an opportunity to move its SAP systems to Google Cloud and gain real-time analytics capabilities for faster sales forecasting, more effective trade promotions, and more sophisticated planning.
From necessity to opportunity
Mrs. T’s successfully ran its SAP ECC solution on its own on-premises servers for years. But after SAP decided to sunset the product, Mrs. T’s realized that it faced multiple challenges, including:
- Migrating its SAP ECC 6.0 system from an on-premises leagcy OS to a cloud-based Linux environment
- Moving data from its SAP DB2 database to HANA
- Transitioning from ECC to SAP S/4HANA
That complex transition needed to take place with little or no downtime, since nearly all of the company’s invoices, warehouse movements, and transfer orders used the Electronic Data Interchange (EDI) protocol. Missing even a few hours of EDI transactions would put significant revenue at stake. Adding to the challenge: Some Mrs. T’s customers would not accept an invoice past five days, which left little room for error. Mrs. T’s chose Rackspace Technology, a longtime Google Cloud partner, to oversee the move.
Mrs. T’s could have chosen to run S/4HANA on its legacy hardware but saw migration to Google Cloud as an opportunity to improve key aspects of its business, in particular data analytics. Historically, sales planning and forecasting involved time-consuming manual processes. But the speed, availability, and scalability of Google Cloud meant that Mrs. T’s could take advantage of S/4HANA’s embedded analytics capabilities. Migrating could also open the door to leveraging Google Cloud’s native integration of SAP data to power Google tools such as BigQuery, Google Cloud AI Building Blocks, and more.
The move to Google Cloud also gave Mrs. T’s an opportunity to update its disaster recovery process. Previously, the company backed up to tape. So, if its SAP systems went down, a member of the IT department would have to drive the most recent tape backups an hour to its cold site, where the disaster recovery partner would load the SAP backup tape, boot the system up, switch network connections to that site, and cross their fingers. Not only would downtime be significant, but restored data would be limited to the periodic tape backup.
“Everything just worked”
Once Mrs. T’s decided to migrate to Google Cloud, the company worked with Rackspace Technology to implement the system. The first phase focused on moving the SAP production environment from on-premises infrastructure to Google Cloud and updating its database to HANA, which took place over 12 weeks. The switchover occurred over a weekend and was all but invisible to users. “We came in on Monday and everything just worked,” recalls Timothy Coyle, Director of Information Systems & Technology. In a second four-month phase, the company transitioned from ECC to S/4.
The move to Google Cloud paid dividends immediately. Batch transactions occurred twice as fast and on-screen end-user transactions rendered instantly. The upgrade also gave the finance team access to embedded analytics and monitoring for the first time. With everything now in the cloud, disaster recovery could be dynamic and nearly instantaneous, with a worst-case scenario of just 5 to 10 minutes of downtime.
“Mrs. T’s needed a skilled and experienced partner that could move its SAP environment to Google Cloud with no negative impacts to its business. We knew this migration was a key initiative in Mrs. T’s digital transformation journey,” says Chuck Britton, Google Partner Development Manager at Rackspace. “We also knew that running SAP on Google Cloud would give the business the fast and flexible analytical capabilities it needed for its SAP data.”
From ideation to production, Mrs. T’s migrated from its legacy on-premises infrastructure to a modern SAP S/4HANA solution on Google Cloud in only seven months, with minimal downtime and zero disruptions. Now that the migration is complete, Mrs. T’s has a flexible, highly scalable environment to run the SAP applications and data that fuel the business. Says Coyle, “Our strategic intent for IT is to make processes simpler, people more productive, and infrastructure more secure. This project fits right square in the middle of that strategic philosophy.”
Learn more about ways in which Google Cloud can transform your SAP experience and about Rackspace Google Cloud solutions for SAP customers.
Recommendations for Modelling SAP Data inside BigQuery

8437
Of your peers have already read this article.
4:00 Minutes
The most insightful time you'll spend today!
Over the past few years, many organizations have experienced the benefits of migrating their SAP solutions to Google Cloud. But this migration can do more than reduce IT maintenance costs and make data more secure. By leveraging BigQuery, SAP customers can complement their SAP investments and gain fresh insights by consolidating enterprise data and easily extending it with powerful datasets and machine learning from Google.
BigQuery is a leading cloud data warehouse, fully managed and serverless, and allows for massive scale, supporting petabyte-scale queries at super-fast speeds. It can easily combine SAP data with additional data sources, such as Google Analytics or Salesforce, and its built-in machine learning lets users operationalize machine learning models using standard SQL — all at a comparatively low cost.
If your SAP-powered organization is looking to supercharge its analytics with the strength of BigQuery, read on for considerations and recommendations for modeling with SAP data. These guidelines are based on our real-world implementation experience with customers and can serve as a roadmap to the analytics capabilities your business needs.
Considerations for data replication
Like most technology journeys, this one should start with a business objective. Keeping your intended business value and goals in mind is critical to making the right decisions in the early steps of the design process.
When it comes to replicating the data from an SAP system into BigQuery, there are multiple ways to do it successfully. Decide which method will work best for your organization by answering these questions:
- Does your business need real-time data? Will you need to time travel into past data?
- Which external datasets will you need to join with the replicated data?
- Are the source structures or business logic likely to change? Will you be migrating the SAP source systems any time soon? For instance, will you be moving from SAP ECC to SAP S/4HANA?
You’ll also need to determine whether replication should be done on a table-by-table basis or whether your team can source from pre-built logic. This decision, along with other considerations such as licensing, will influence which replication tool you should use.
Replicating on a table-by-table basis
Replicating tables, especially standard tables in their raw form, allows sources to be reused and ensures more stability of the source structure and functional output. For example, the SAP table for sales order headers (VBAK) is very unlikely to change its structure across different versions of SAP, and the logic that writes to it is also unlikely to change in a way that affects a replicated table.
Something else to consider: Reconciliation between the source system and the landing table in BigQuery is linear when comparing raw tables, which helps avoid issues in consolidation exercises during critical business processes, such as period-end closing. Since replicated tables aren’t aggregated or subject to process-specific data transformation, the same replicated columns can be reused in different BigQuery views. You can, for instance, replicate the MARA table (the material master) once and use it in as many models as needed.
Replicating pre-built logic
If you replicate pre-built models, such as those from SAP extractors or CDS views, you don’t need to build the logic in BigQuery, since you’re using existing logic. Some of these extraction objects have embedded delta mechanisms, which may complement a replication tool that can’t handle deltas. This will save initial development time, but it can also lead to challenges if you create new columns, or if customizations or upgrades change the logic behind the extraction.
It’s also important to note that different extraction processes may transform and load the same source columns multiple times, which creates redundancy in BigQuery and can lead to higher maintenance needs and costs. However, replicating pre-built models may still be a good choice, since doing so can be especially useful for logic that tends to be immutable, such as flattening a hierarchy, or logic that is highly complex.
How you approach replication will also depend on your long-term plans and other key factors — for example, the availability (and curiosity) of your developers, and the time or effort they can put into applying their SQL knowledge to a new data warehouse.
With either replication approach, bear in mind when designing your replication process that BigQuery is meant to be an append-always database — so post-processing of data and changes will be required in both cases.
Processing data changes
The replication tool you choose will also determine how data changes are captured (known as CDC – change data capture). If the replication tool allows for it (for example as SAP SLT does) the same patterns described in the CDC with BigQuery documentation also apply to SAP data.
Because some data, like transactions, are known to be less static than others (e.g., master data), you need to decide what should be scanned in real time, what will require immediate consistency, and what can be processed in batches to manage costs. This decision will be based on the reporting needs from the business.
Consider the SAP table BUT000, containing our example master data for business partners, where we have replicated changes from an SAP ERP system:
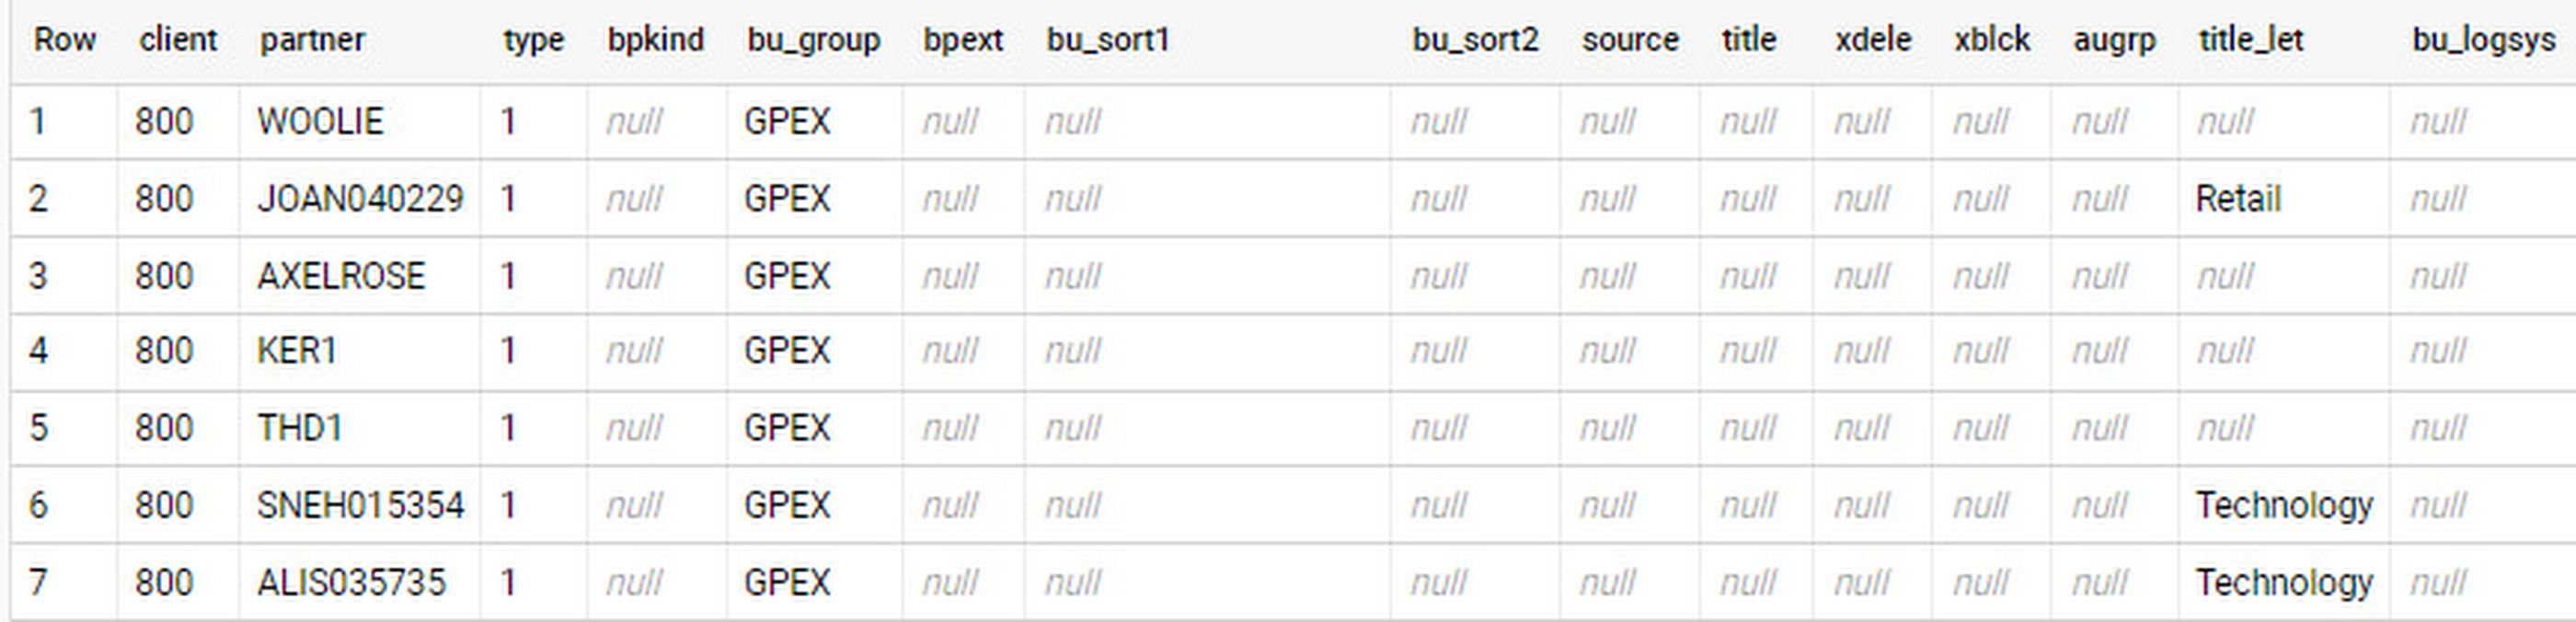
In an append-always replication in BigQuery, all updates are received as new records. For example, deleting a record in the source will be represented as a new record in BigQuery with a deletion flag. This applies to whether the records are coming from raw tables like BUT000 itself or pre-aggregated data, as from a BW extractor or a CDS view.
Let’s take a closer look at data coming particularly from the partners “LUCIA” and “RIZ”. The operation flag tells us whether the new record in BigQuery is an insert (I), update (U) or deletion (D), while the timestamps help us identify the latest version of our business partner.
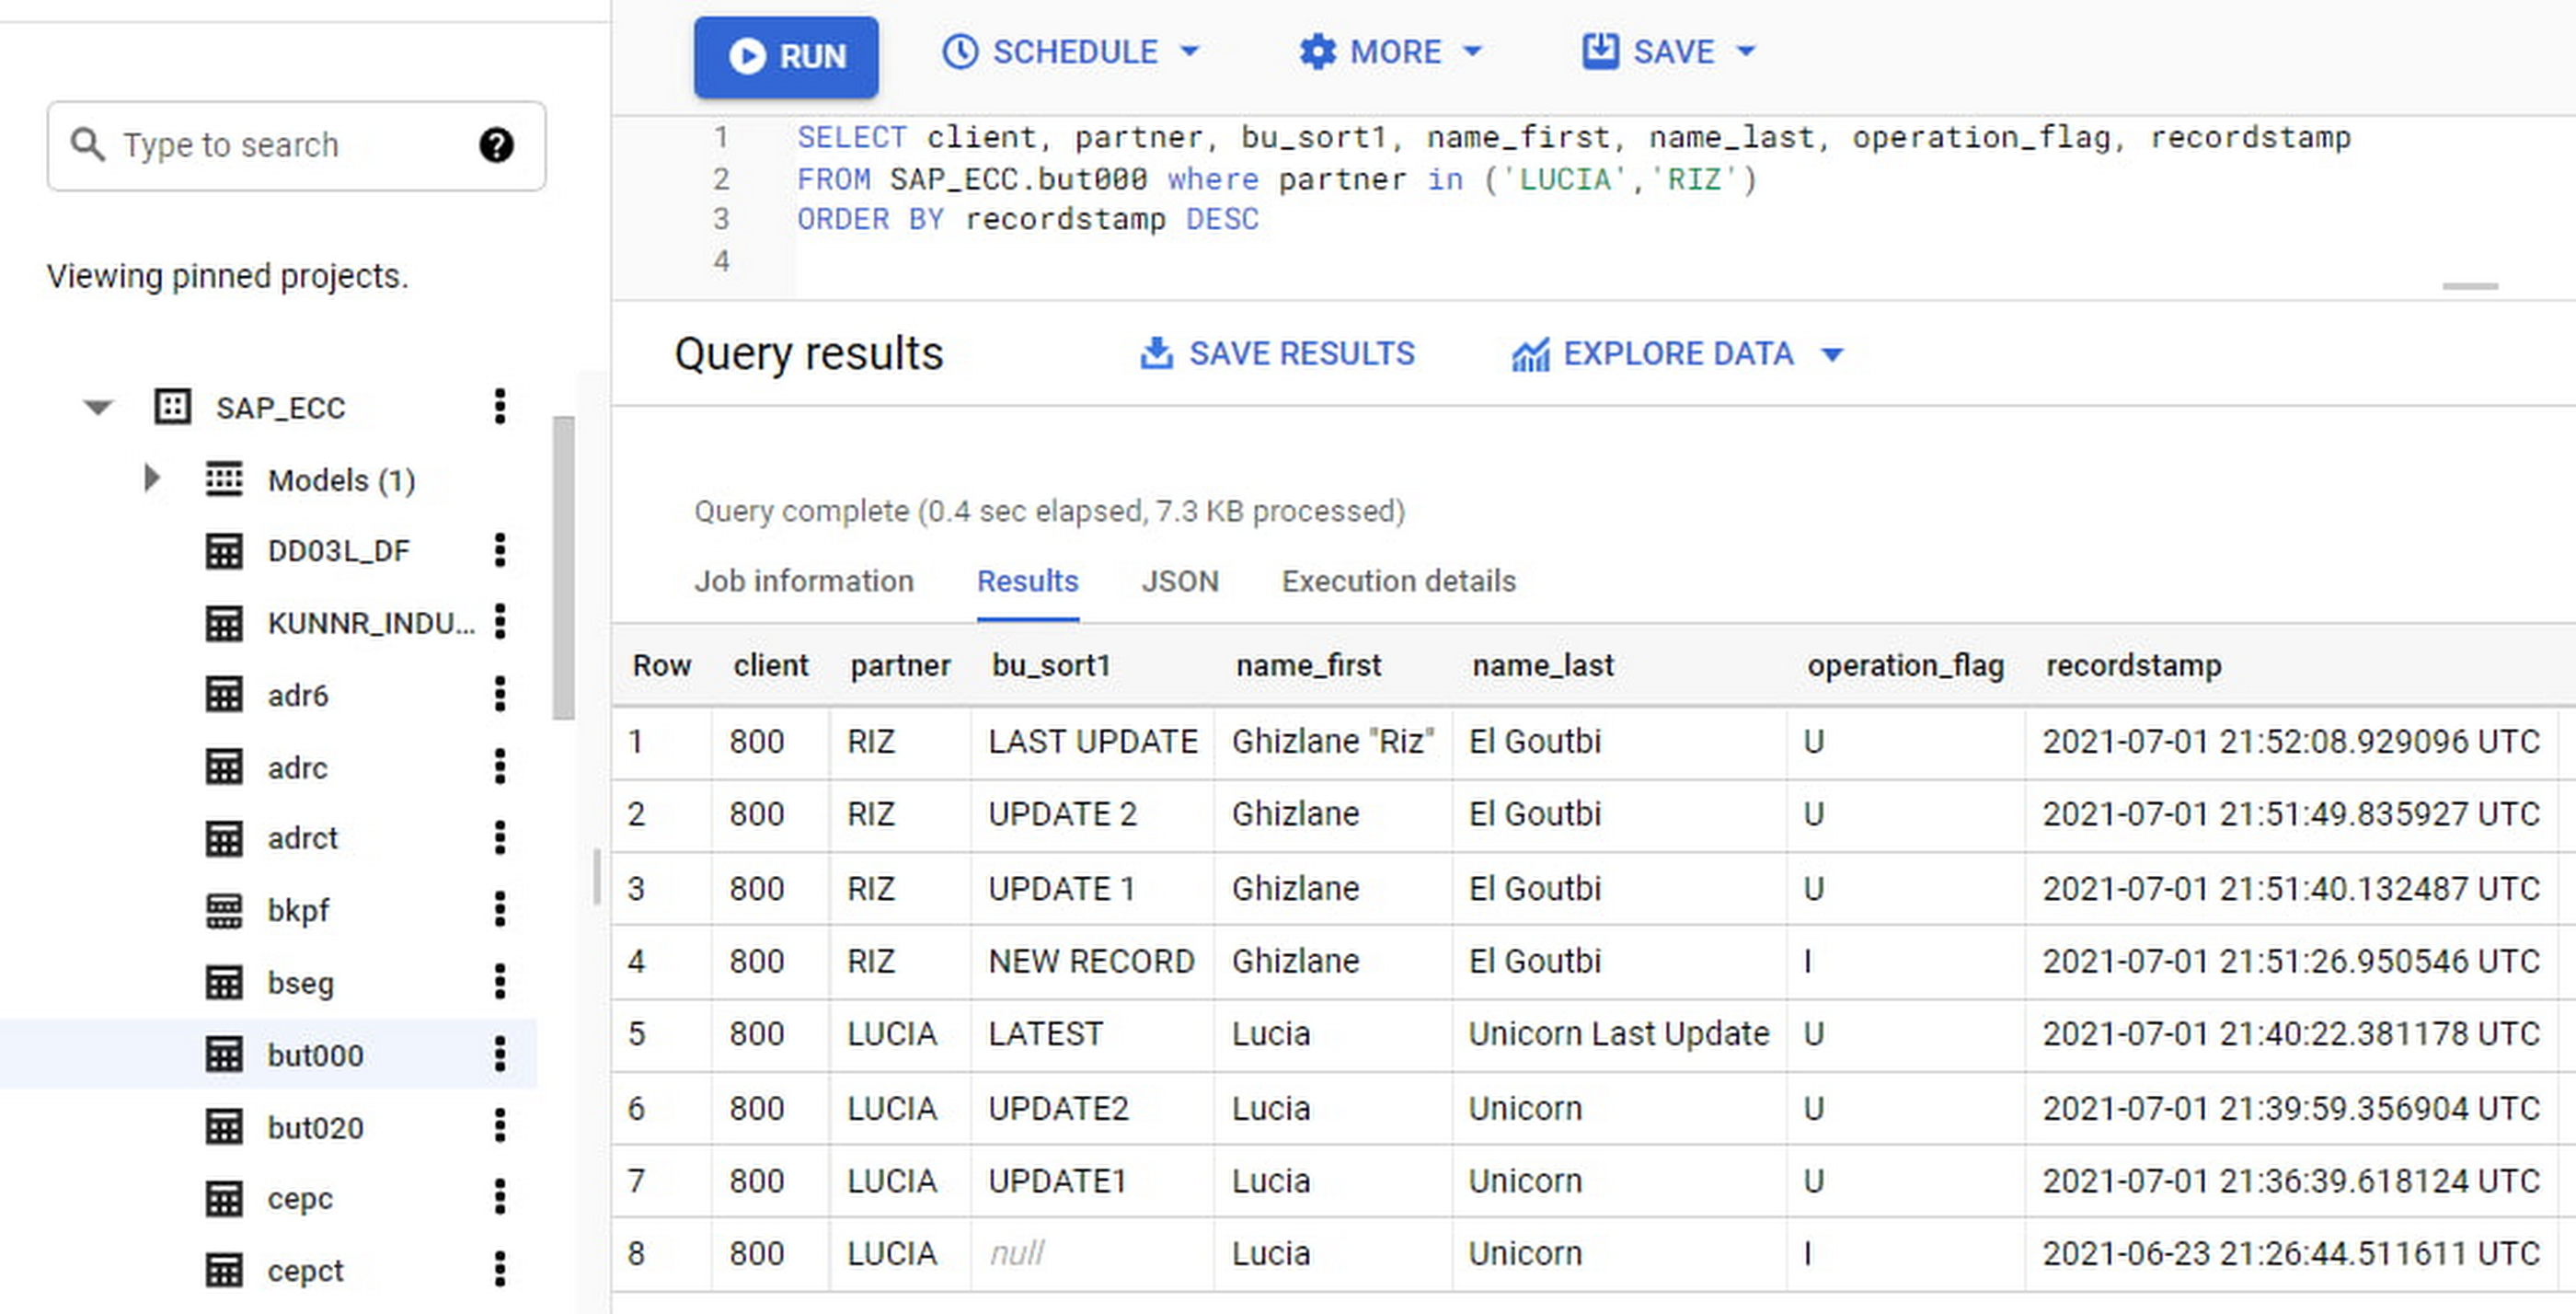
If we want to find the latest updated record for the partners LUCIA and RIZ, this is what the query would look like:
SELECT partner,ARRAY_AGG(i1 ORDER BY i1.recordstamp DESC LIMIT 1) AS rowFROM SAP_ECC.but000 i1WHERE partner in ('LUCIA','RIZ')GROUP BY partner
With the following result:
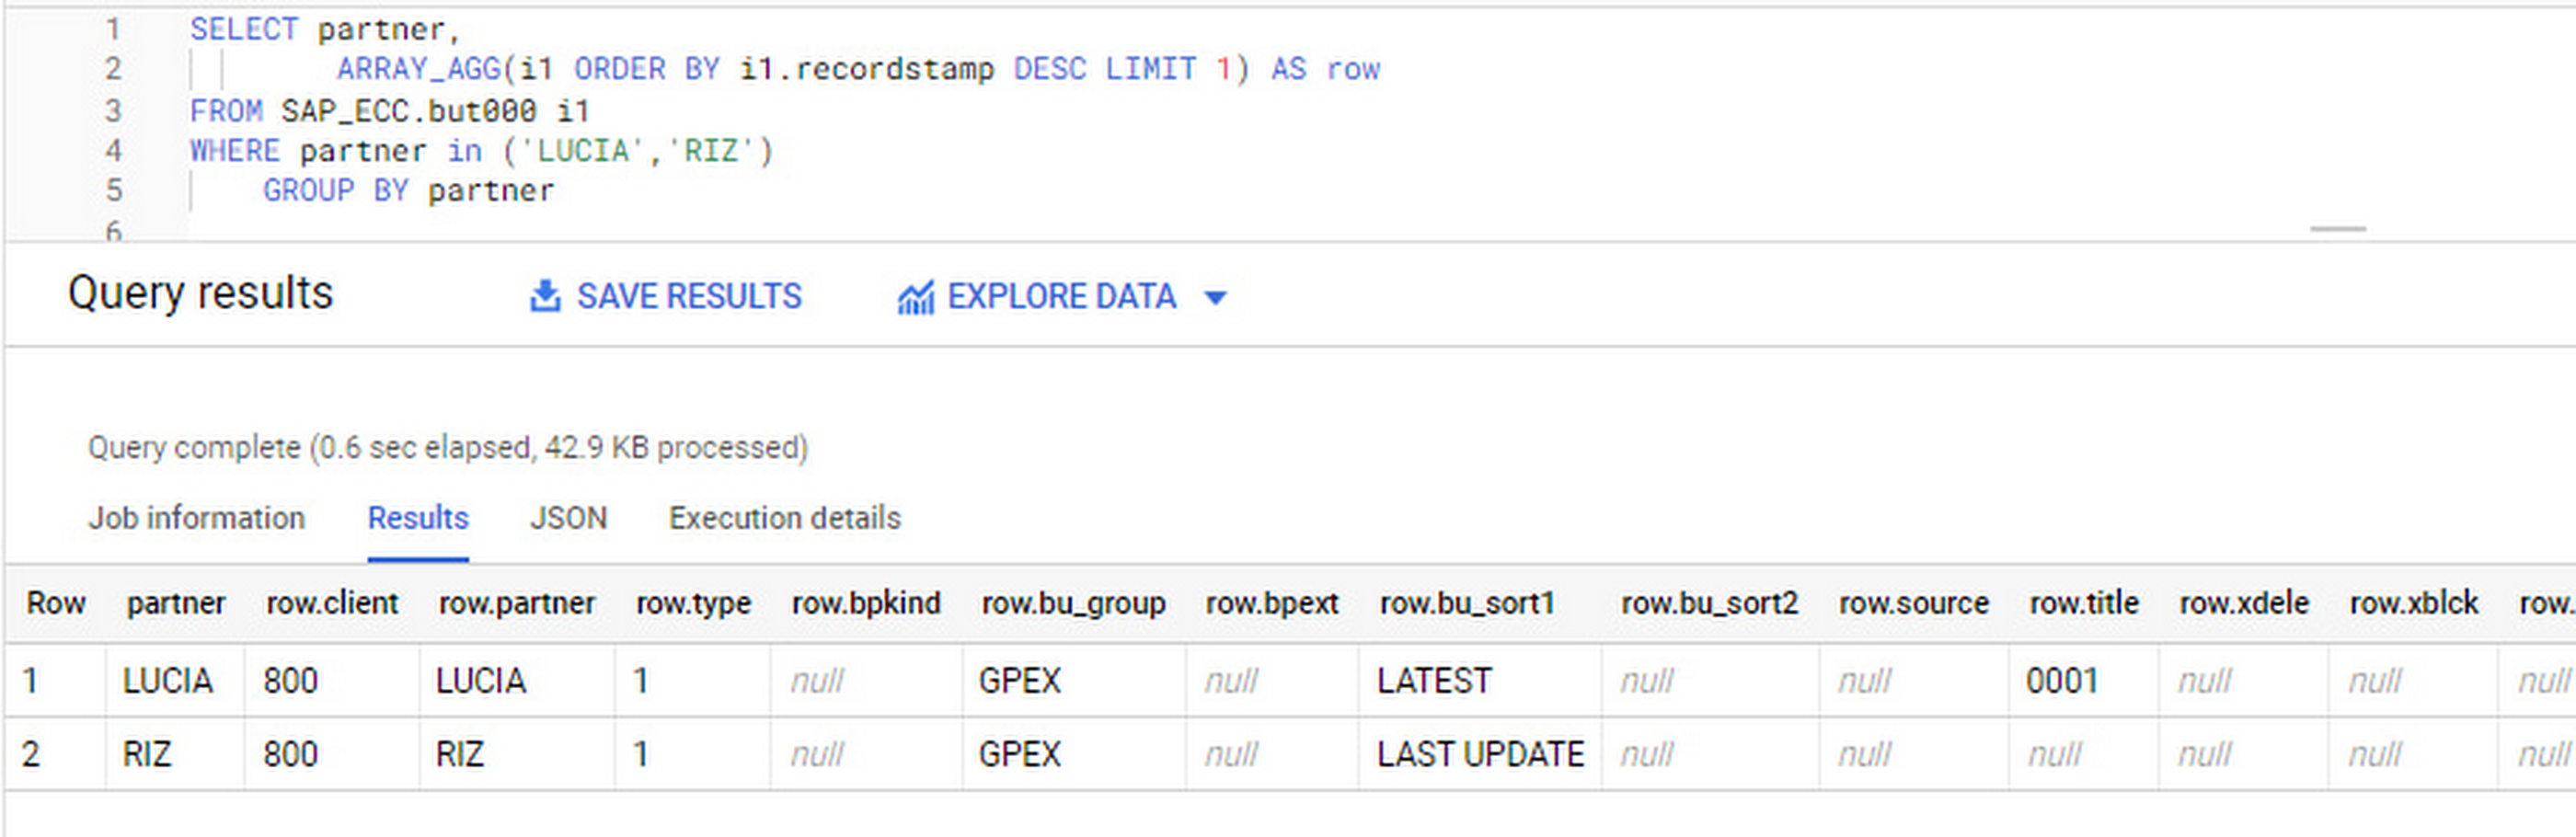
After identifying stale records for “LUCIA” and “RIZ” business partners, we can proceed to deleting all stale records for “LUCIA” if we do not want to retain the history. In this example, we are using a different table to which the same replication has been done, for the purpose of comparison and to check that all stale records have been deleted for the selection made and that we only kept last updated records. For example:
DELETE SAP_HANA.but000 i1WHEREi1.recordstamp < TIMESTAMP_SUB(CURRENT_TIMESTAMP(), INTERVAL 3 HOUR) ANDi1.recordstamp < (SELECT MAX(recordstamp) FROM SAP_HANA.but000 i2WHEREi1.partner = i2.partnerand partner="LUCIA")
You can also use the following query to retrieve stale records for “LUCIA” partner before moving forward with deletion
SELECT partner, operation_flag, recordstamp FROM SAP_HANA.but000 i1WHEREi1.recordstamp < TIMESTAMP_SUB(CURRENT_TIMESTAMP(), INTERVAL 3 HOUR)ANDi1.recordstamp < (SELECT MAX(recordstamp) FROM SAP_HANA.but000 i2WHEREi1.partner = i2.partnerand partner="LUCIA")
Which produces all of the records, except the latest update:

Partitioning and clustering
To limit the number of records scanned in a query, save on cost and achieve the best performance possible, you’ll need to take two important steps: determine partitions and create clusters.
Partitioning
A partitioned table is one that’s divided into segments, called partitions, which make it easier to manage and query your data. Dividing a large table into smaller partitions improves query performance and controls costs because it reduces the number of bytes read by a query.
You can partition BigQuery tables by:
- Time-unit column: Tables are partitioned based on a “timestamp,” “date,” or “datetime” column in the table.
- Ingestion time: Tables are partitioned based on the timestamp recorded when BigQuery ingested the data.
- Integer range: Tables are partitioned based on an integer column.
Partitions are enabled when the table is created, as in the example below. A great tip is to always include the partition filter as shown on the left-hand side of the query.

Clustering
Clustering can be created on top of partitioned tables by applying the fields that are likely to be used for filtering. When you create a clustered table in BigQuery, the table data is automatically organized based on the contents of one or more of the columns in the table’s schema. The columns you specify are then used to colocate related data.
Clustering can improve the performance of certain query types — for example, queries that use filter clauses or that aggregate data. It makes a lot of sense to use them for large tables such as ACDOCA, the table for accounting documents in SAP S/4HANA. In this case, the timestamp could be used for partitioning, and common filtering fields such as the ledger, company code, and fiscal year could be used to define the clusters.
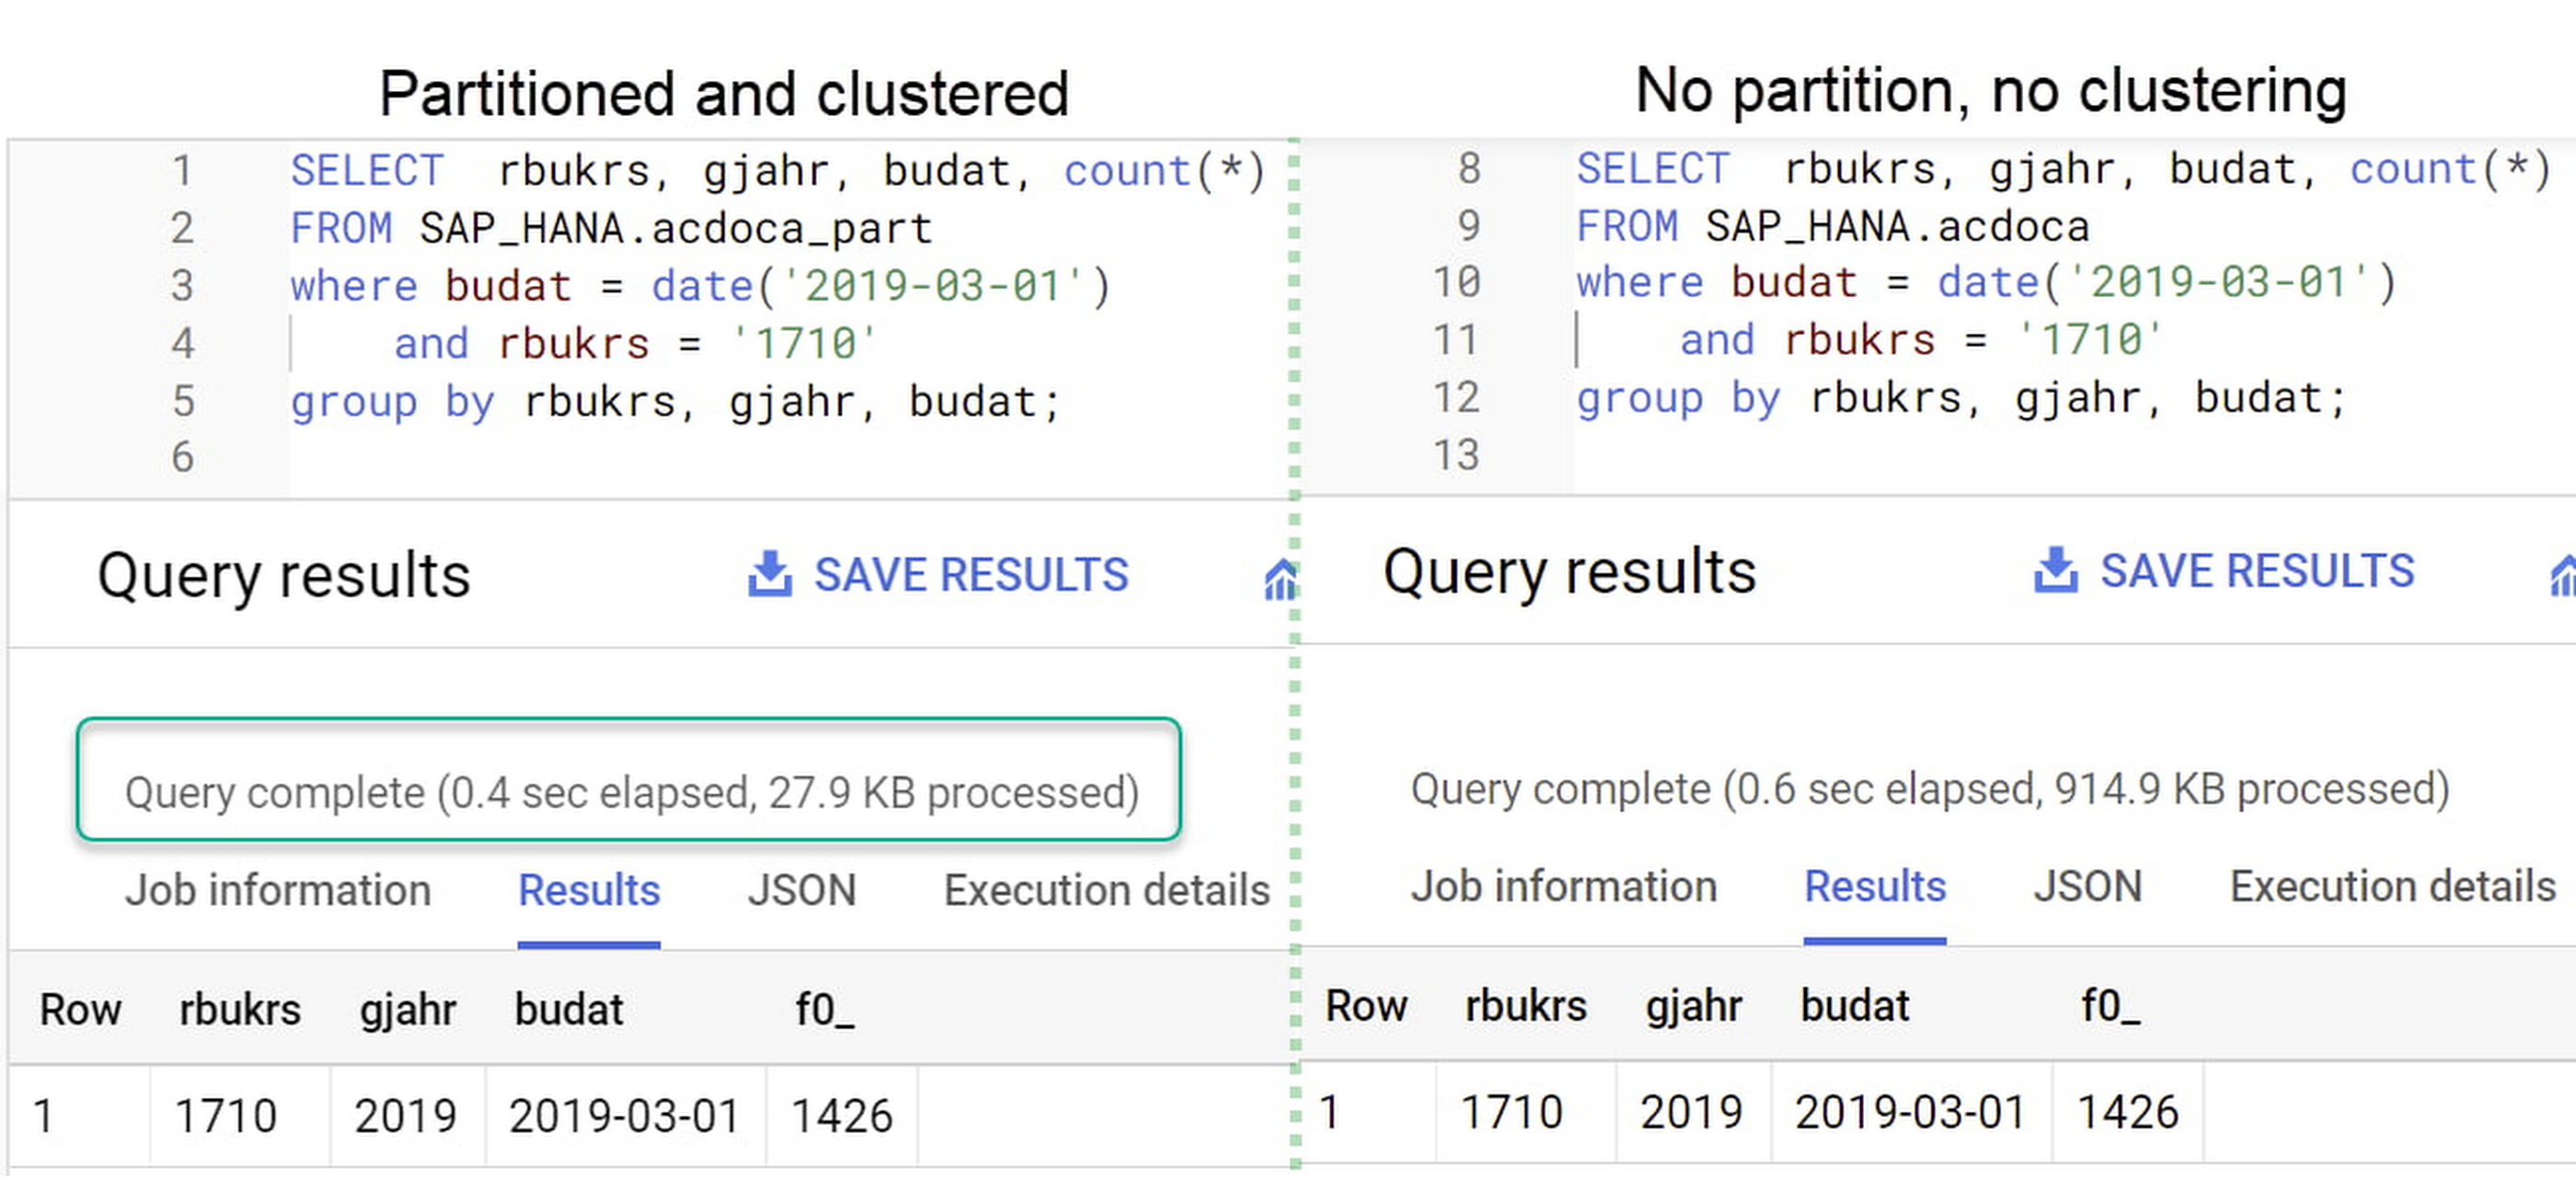
A great feature is that BigQuery will also periodically recluster the data automatically.
Materialized views
In BigQuery, materialized views are precomputed views that periodically cache the results of a query for better performance and efficiency. BigQuery uses precomputed results from materialized views and, whenever possible, reads only the delta changes from the base table to compute up-to-date results quickly. Materialized views can be queried directly or can be used by the BigQuery optimizer to process queries to the base table.
Queries that use materialized views are generally completed faster and consume fewer resources than queries that retrieve the same data only from the base table. If workload performance is an issue, materialized views can significantly improve the performance of workloads that have common and repeated queries. While materialized views currently only support single tables, they are very useful common and frequent aggregations like stock levels or order fulfillment.
Further tips on performance optimization while creating select statements can be found in the documentation for optimizing query computation.
Deployment pipeline and security
For most of the work you’ll do in BigQuery, you’ll normally have at least two delivery pipelines running — one for the actual objects in BigQuery and the other to keep the data staging, transforming, and updated as intended within the change-data-capture flows. Note that you can use most existing tools for your Continuous Integration / Continuous Deployment (CI/CD) pipeline — one of the benefits of using an open system like BigQuery. But, if your organization is new to CI/CD pipelines, this is a great opportunity to gradually gain experience. A good place to start is to read our guide for setting up a CI/CD pipeline for your data-processing workflow.
When it comes to access and security, most end-users will only have access to the final version of the BigQuery views. While row and column-level security can be applied, as in the SAP source system, separation of concerns can be taken to the next level by splitting your data across different Google Cloud projects and BigQuery datasets. While it’s easy to replicate data and structures across your datasets, it’s a good idea to define the requirements and naming conventions early in the design process so you set it up properly from the start.
Start driving faster and more insightful analytics
The best piece of advice we can give you is this: Try it yourself. Anyone with SQL knowledge can get started using the free BigQuery tier. New customers get $300 in free credits to spend on Google Cloud during the first 90 days. All customers get 10 GB storage and up to 1 TB queries/month, completely free of charge. In addition to discovering the massive processing capabilities, embedded machine learning, multiple integration tools, and cost benefits, you’ll soon discover how BigQuery can simplify your analytics tasks.
If you need additional assistance, our Google Cloud Professional Services Organization (PSO) and Customer Engineers will be happy to help show you the best path forward for your organization. For anything else, contact us at cloud.google.com/contact.
8426
Of your peers have already watched this video.
21:00 Minutes
The most insightful time you'll spend today!
Journey to Transformation and Modernization with Google’s Distributed Cloud
Google Cloud has been leading the way of helping businesses make most from their cloud investments to drive digital transformation through modern application platforms that cater to today’s customer needs. Watch the video from the Next ’21 to explore three areas where companies are supported by Google Cloud throughout their cloud evolution journey–cloud migration and modernization, extension of services and engineering practices to hybrid and multicloud environments, and delivery of high performance with planet scale distributed infrastructure. Also, learn how Google Cloud is equipped for more complex and unique use cases, from datacenter to the edge. Hear the strategies and customer stories that can help your business modernize people, processes, and applications to fully leverage Google’s distributed cloud!
More Relevant Stories for Your Company

Taking Partnership forward: Google Cloud VMware Engine Now in VMware Cloud Universal
As the pace of digital transformation accelerates, our partnership with VMware continues to focus on helping customers successfully navigate their cloud journey and achieve their business objectives through seamless and rapid migration of business critical VMware workloads. We announced the general availability of Google Cloud VMware Engine in May 2020.

Explore Google Cloud’s Bi-monthly Technical Learning Series for Innovators in Public Sector
Cloud engineers face a constant barrage of new cloud services, products, and innovations. By late 2021, Google Cloud alone had released thousands of new features across hundreds of services. Couple this with other technologies and service releases, and it quickly becomes a herculean task for engineers to navigate, consume, and

Rethinking retail with Google Cloud Retail Search
Cloud Retail Search, part of Discovery Solutions For Retail portfolio, helps retailers significantly improve the shopping experience on their digital platform with ‘Google-quality’ search. Cloud Retail Search offers advanced search capabilities such as better understanding user intent and self-learning ranking models that help retailers unlock the full potential of their

Download the Forrester Study to Explore the Benefits of AI for IT Operations in Cloud Environment
Organizations are currently modernizing their businesses in order to meet the increasing complexity of today’s business landscape. In effect, business leaders must evaluate the best way to mitigate the challenges which plague their cloud operations, all while meeting customers’ growing expectations around digital experience (DX) through agility, automation, and proactive
