





Leave the Tax Filing to ML: Lending Doc AI’s Automation Classifying and Parsing IT Documents

2982
Of your peers have already read this article.
3:00 Minutes
The most insightful time you'll spend today!
In the United States, Tax Season descends upon the country every April, requiring millions of Americans to spend hours deciphering cryptic documents and performing complex math just to figure out what they owe. Wouldn’t it be grand if there was a way for a computer to take all the relevant documents and extract out exactly what the IRS is looking for? Lending Document AI from Google Cloud supports common document types used for Income Tax Filing, such as W-2s and 1099s. These advancements in machine learning technology now makes it possible to alleviate some anxiety leading up to April 15th.
Lending Document AI is a Document Understanding solution that allows for classification and parsing of documents commonly used in the mortgage lending industry. The data in these unstructured files is then converted into a structured format, which can be stored in a database or used for analysis and calculations. You can read more about the product in the announcement blog post. For this tax filing use case, we will focus on automatically classifying and parsing the 2020 editions of the following forms:
W-2
1099-DIV
1099-INT
1099-MISC
1099-NEC
This sample application creates an automated pipeline where the user can bulk upload a collection of PDFs, the Lending Document Splitter & Classifier will classify each document and send each PDF to the appropriate specialized parser to extract the data, which can then be used to calculate an individual tax return and fill out a 1040 Form.
Overview
Let’s explore how this application works. You can check out the sample code in this GitHub Repository.
Here is an outline of the architecture of this application. As you can see, it utilizes Cloud Run and Firestore in Native Mode for the web application in addition to Document AI.
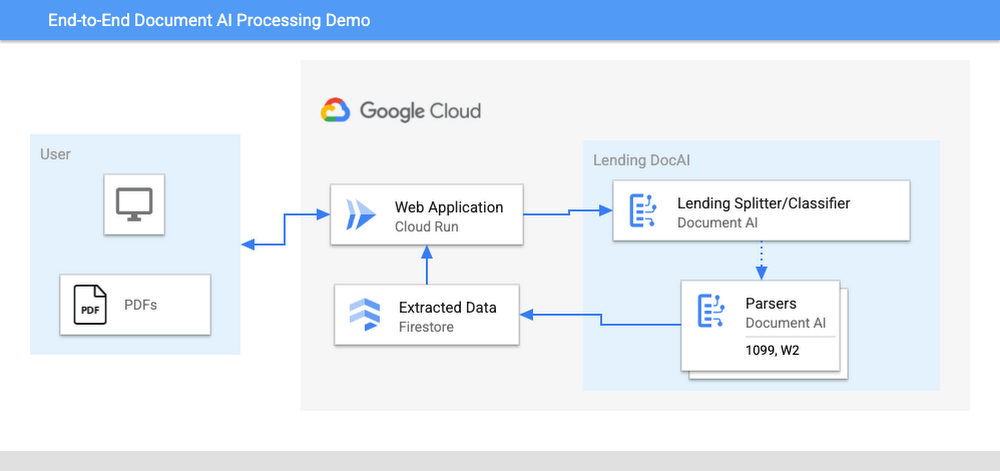
The User uploads multiple PDF files to the web application, hosted on Cloud Run.
An API call is made to the Lending Document Splitter & Classifier for each PDF file.
The output of the classifier (e.g. W-2, 1099-MISC, etc.) is then mapped to an appropriate specialized parser in the Google Cloud Project.
Each document file is sent to the appropriate specialized parser that matches the document type.
The entities are extracted by the parser processor and the data is written to Firestore.
The raw data is now retrieved from Firestore and displayed to the User showing the file classification and extracted values from each form.
The data values from all the forms are used together to calculate an individual income tax return.
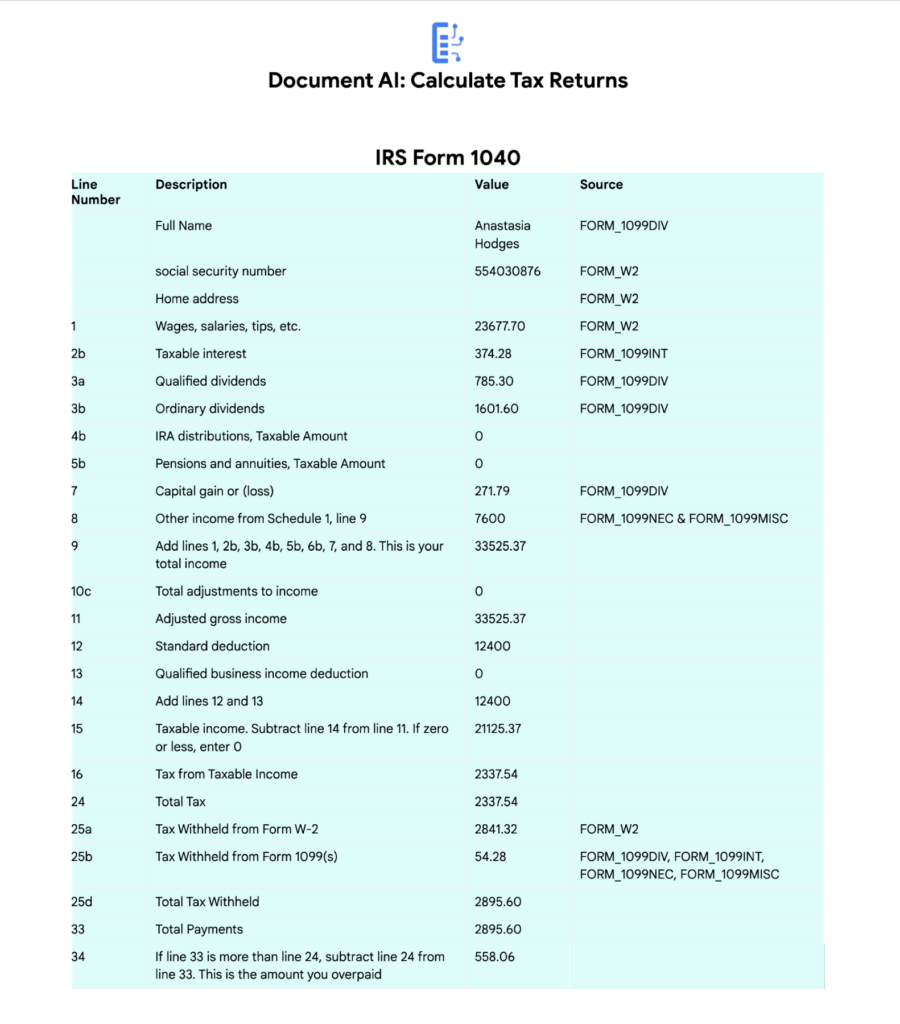
The Calculated Tax Rates/Incomes/Deductions are displayed to the User in a Tabular Format matching the IRS Form 1040. The app also displays which form data was used for each field. (Some output fields use values from multiple forms, such as line 25b.)
Step-by-Step directions
Want to try this out for yourself? Here’s how you can deploy and run this application using a Google Cloud Project. You can run this in Cloud Shell (Quickstart) or on your local machine.
NOTE: The Lending Processors in this Demo are in Limited GA as of March 2022. If you have a business use case for these processors, you can fill out and submit the Document AI limited access customer request form.
Install dependencies
- Clone the GitHub Repository to get the sample code.
git clone https://github.com/GoogleCloudPlatform/document-ai-samples.git
- Enter the directory for the tax pipeline demo
cd document-ai-samples/tax-processing-pipeline-python
- Install Python and the Google Cloud SDK if they aren’t already installed.
- Install the python libraries:
pip install -r requirements.txt
- Create a new Google Cloud project, and enable billing if you don’t already have one.
- Enable the Document AI API:
gcloud services enable documentai.googleapis.com
- Setup application default credentials:
gcloud auth application-default login
Deploy demo application
- Edit the config.yaml file, adding your own Project Details docai_processor_location: us # Document AI Processor Location (us OR eu)
docai_project_id: YOUR_PROJECT_ID # Project ID for Document AI Processors
firestore:
collection: tax_demo_documents # Set with your preferred Firestore Collection Name
project_id: YOUR_PROJECT_ID # Project ID for Firestore Database - Run setup scripts to create the processors and Cloud Run app in your project. python3 setup.py
gcloud run deploy tax-demo –source . - Visit the Deployed Web Page (You should get a link from the deployment command)
Calculate Tax Returns Homepage
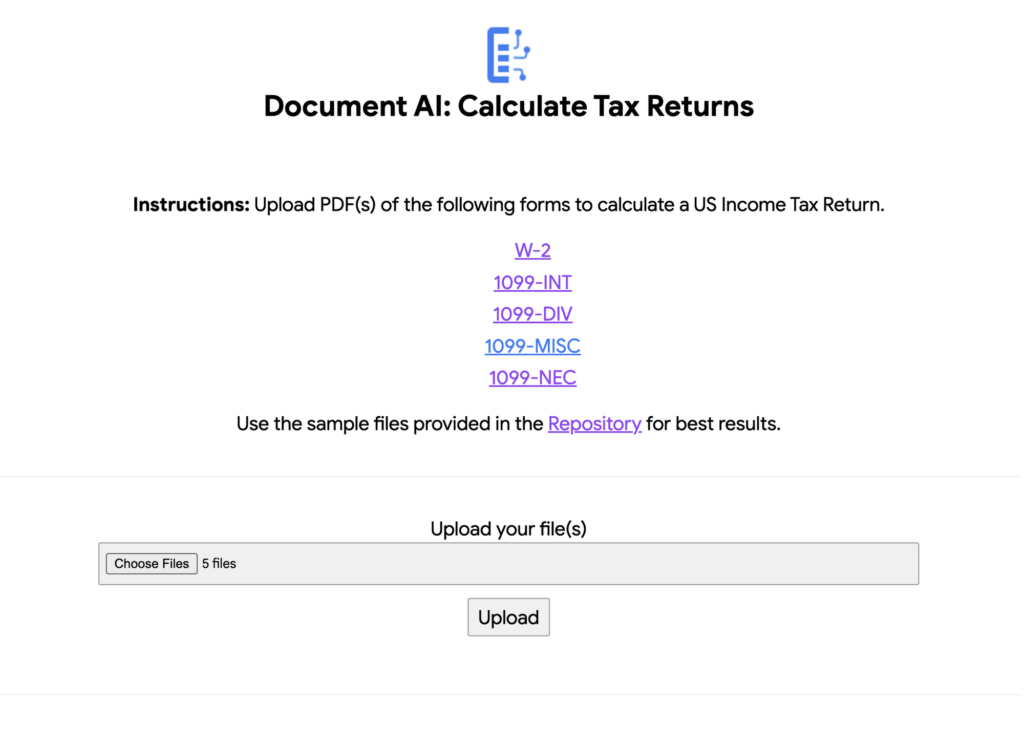
- Upload Documents. I created some sample documents you can download from the sample-docs folder of the repository.
This demo currently supports the following Document Types (2020 Editions)
W-2
1099-DIV
1099-INT
1099-MISC
1099-NEC
- Click “Upload” Button, wait for processing to complete.
The page will display the steps completed for each document file. These are also written to stdout for troubleshooting purposes.
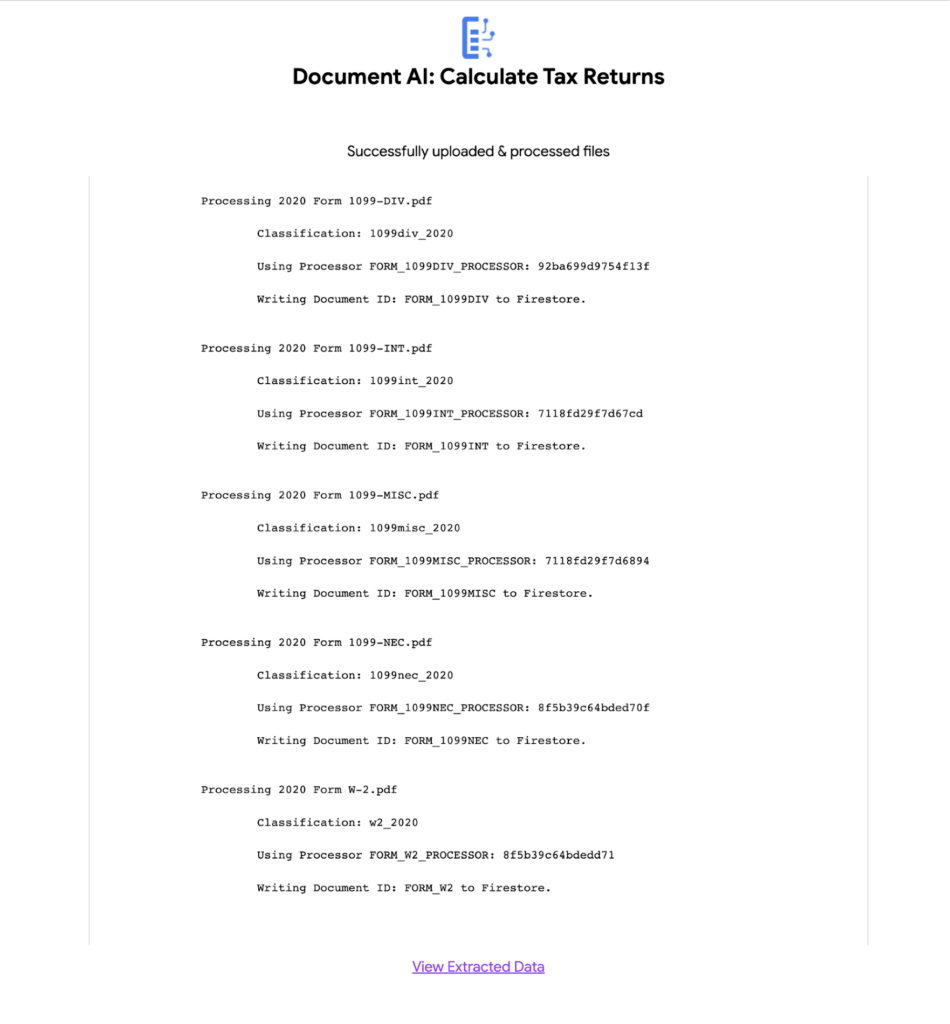
6. View the extracted values from each file.
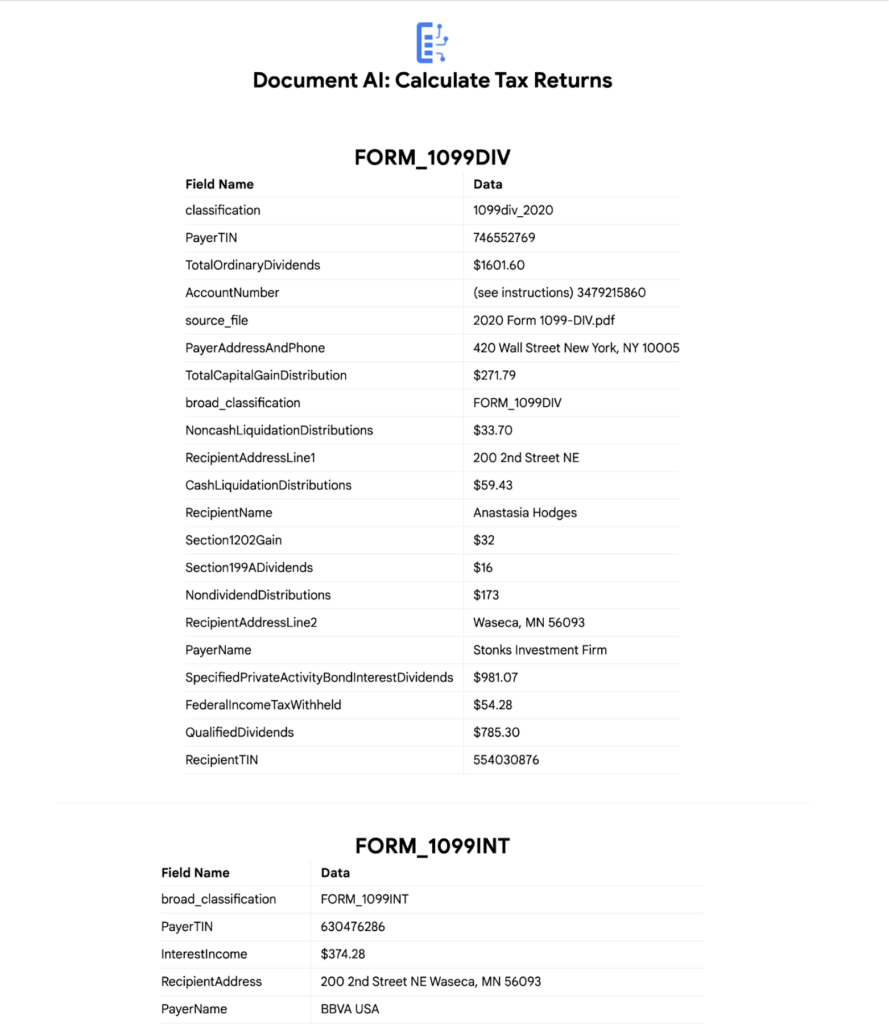
7. Click “Calculate Taxes” to see the tax calculation output
Conclusion
Warning: This is NOT financial advice, for educational purposes only.
Congratulations! You now have a fully functional tax processing application that can also be modified for use with other workflows that require data from multiple specialized documents.
The Document AI API is flexible and modular enough that most of the code in this example can be reused for any specialized processor.
Now tax returns can be filed with minimal manual effort!
If you want to learn more about Document AI, check out the Cloud Documentation and these videos:
- Getting started with the Document AI platform
- Process billions of pages and cut operational costs with DocAI
And if you want more hands-on experience, I recommend following these step-by-step codelabs to get started with the key features of Document AI:
Data to Business Outcomes with Google’s Data Analytics Design Pattern

6720
Of your peers have already read this article.
1:30 Minutes
The most insightful time you'll spend today!
Companies today are inundated with vast amounts of data from various sources. This overwhelming amount of data is meant to benefit the company, but often leaves data teams feeling overwhelmed, which can create data bottlenecks and result in a slow time to value. In fact, only twenty seven percent of companies agree that data and analytics projects produce insights and recommendations that are highly actionable (Accenture). This means that nearly 3 in 4 companies are not unlocking value in their data, which poses a huge challenge for organizations trying to move the needle and drive real business results. We at Google Cloud, however, saw opportunity in this challenge, which is why we created Data Analytics Design Patterns: cross-product technical solutions designed to accelerate a customer’s path to value realization with their data. These industry solutions bring together product capabilities alongside design methodology, open source deployable code, data models, and reference architectures to accelerate your business outcomes.

With Data Analytics Design Patterns, you get access to more than 30 ready-to-deploy data analytics solutions. Design patterns leverage the best of Google and our rich partner ecosystem, including Technology Partners & System Integrators. In this blog, we will cover 3 examples on how a design pattern can be applied to unlock the value of data:
- Improve mobile app experience with Unified App Analytics
- Maximize digital shop’s revenue with Price Optimization
- Protect internal systems from security and malware threat with Anomaly Detection
Unified App Analytics
If mobile apps are part of your go-to-market strategy, you have several data sources that can provide invaluable customer insights. In addition to tools such as CRM (e.g. Salesforce) and customer care (e.g. Zendesk), you likely use Google Analytics to log app events and Firebase Crashlytics to gather data about app errors. But can you easily combine back-end server data with app front-end data to unlock customer insights?
The Unified App Analytics design pattern makes it easy to plug all the disparate data sources into a single warehouse (BigQuery) and start analyzing it with a Business Intelligence tool (Looker). Once you have a complete and real time view of your customer experience with your app, you can take action. For example, if you notice an increase in app errors, you can quickly combine your Crashlytics data with your CRM data to narrow down the crashes with the highest revenue impact and prioritize their resolution. Further, you can automate your issue resolution workflow by creating a rule for any future crash that impacts a subset of VIP customers.

With the Unified App Analytics design pattern, you’ll gain access to valuable insights about your user experience with your app so you can inform your future app strategy. For example, NPR, an American media company, increased user engagement by showing content that better mapped to listener interests and behaviors.
Price Optimization
In a competitive and hectic global marketplace, strategic pricing matters more than ever, but often projects are consumed by the tedium of standardizing, cleaning, and preparing data—from transactions, inventory, demand, among other sources.
Price Optimization solution allows retailers to build a data driven pricing model. The solution consists of three main components:
- Dataprep by Trifacta: integrates different data sources into a single Common Data Model (CDM). Dataprep is an intelligent data service for visually exploring, cleaning, and preparing structured and unstructured data for analysis, reporting, and machine learning.
- BigQuery: allows you to create and store pricing models in a consistent and scalable way as a serverless Cloud Data Warehouse service
- Looker dashboards: surface insights and enable business teams to take action with enterprise ready BI platform
With the Price Optimization design pattern from Google Cloud and our partner Trifacta, you’ll be able to rapidly unify multiple data sources and create a real-time and ML-powered analysis, leveraging predictive models to estimate future sales. For example, PDPAOLA, an online jewelry company, doubled sales with dynamic pricing adjustments enabled by a single data view.

Anomaly Detection
Organizations need to anticipate and act on risks and opportunities to stay competitive in a digitally transforming society. Anomaly detection helps organizations identify and respond to data points and data trends in high velocity, high volume data sets that deviate from historical standards and expected behaviors, allowing them to take action on changing user needs, mitigate malicious actors and behaviors, and prevent unnecessary costs and monetary losses.
The Anomaly Detection design pattern uses Google Pub/Sub, BigQuery, Dataflow, and Looker to:
- Stream events in real time
- Process the events, extract useful data points, train the detection algorithm of choice
- Apply the detection algorithm in near-real time to the events to detect anomalies
- Update dashboards and/or send alerts
The challenge of finding the important insights and anomalies in vast amounts of data applies to organizations across all industries and lines of business, but is especially important to protecting the security of an organization. For example, TELUS, a national communications company, modernized their security analytics platform leveraging this pattern, allowing them to detect anomalies in near real time to detect and mitigate suspicious activity.
Get started
Turn your data into business outcomes with Google Cloud and our broad partner ecosystem by deploying Data Analytics Design Patterns at your organization. There are more than 30 Data Analytics Design Patterns ready for you to use. We have more than 200+ more ideas in the pipeline, so be sure to check in regularly as new patterns will be added soon.
To dive deeper and find out more about how Data Analytics Design Patterns can help your organization accelerate use cases and create faster time to value, check out this video.
You Can Quantify and Maximize Value of Your Org’s AI/ML and Analytics Teams!

4410
Of your peers have already read this article.
1:30 Minutes
The most insightful time you'll spend today!
Investing in Artificial Intelligence (AI) can bring a competitive advantage to your organization. If you’re in charge of an AI or Data Science team, you’ll want to measure and maximize the value that you’re providing. Here is some advice from our years of experience in the field.
A checklist to embark on a project:
As you embark on projects we’ve found it’s good to have the following areas covered:
- Have a customer. It’s important to have a customer for your work, and that they agree with what you’re trying to achieve. Be sure to know what value you’re delivering to them.
- Have a business case. This will rely on estimates and assumptions, and may take no more than a few minute’s work. You should revise this, but always know what justifies your team’s effort, and what you (and your customer) expect to get in return.
- Know what process you will change or create. You’ll want to put your work in production, so you have to be clear about what business operations are changing or created around your work and who needs to be involved to make it happen
- Have a measurement plan. You’ll want to show that ongoing work is impacting some relevant business indicator. Measure and show incremental value. The goal of these measurements is to establish what has changed because of your project that would otherwise not have changed. Be sure to account for other factors like seasonality or other business changes that may affect your measurements.
- Use all the above to get your organization’s support for your team and your work.
What measures to use?
As you start the work, what measures and indicators can you use to show that your team’s work is useful for your organization?
How many decisions you make. A major function of ML is to automate and optimize decisions: which product to recommend, which route to follow, etc. Use logs to track how many decisions your systems are making.
Changes to revenue or costs. Better and quicker decisions often lead to increased revenue or savings. If possible, measure it directly, otherwise estimate it (for example fuel costs saved from less distance traveled, or increased purchases from personalized offers).
As an example, the Illinois Department of Employment Security is using Contact Center AI to rapidly deploy virtual agents to help more than 1 million citizens file unemployment claims. To measure success the team tracked the two outcomes: (1) the number of web inquiries and voice calls they were able to handle, and (2) the overall cost of the call center after the implementation. Post implementation, they were able to observe more than 140,000 phone and web inquiries per day and over 40,000 after-hours calls per night. They also anticipate an estimated annual cost savings of $100M based on an initial analysis of IDES’s virtual agent data (see more in the link to case study).
Implementation costs. The other side of increased revenue or savings, is to put your achievements in the context of how much they cost. Show the technology costs that your team incurs and, ideally, how you can deliver more value, more efficiently.
How much time was saved. If the team built a routing system then it saved travel time, if it built an email classifier then it saved reading time, etc. Quantify how many hours were given back to the organization thanks to the efficiency of your system.
In the medical field, quicker diagnostics matter. Johns Hopkins University’s Brain Injury Outcomes (BIOS) Division has focused on studying brain hemorrhage aiming to improve medical outcomes. The team identified the time to insights as a key metric in measuring business success. They experimented with a range of cloud computing solutions like Dataflow, Cloud Healthcare API, Compute Engine, and AI Platform for distributed training to accelerate iterations. As a result, in their recent work they were able to accelerate insights from scans from approximately 500 patients from 2,500 hours to 90 minutes.
How many applications your team supports. Some of your organization’s operations don’t use ML (say reconciling financial ledgers) but others do. Know how many parts of your organization benefit from the optimization and automation your team builds.
User experience. You may be able to measure your customer’s experience: fewer complaints, better reviews, reduced latency, more interactions, etc. This is valid both for internal and external stakeholders. At Google we measure usage and regularly ask for feedback on any internal system or process.
One of our customers, The City of Memphis, is using VisionAI and ML to tackle a common but very challenging issue: identifying and addressing potholes. The implementation team identified the percentage increase of potholes identified as one of the key metrics along with accuracy and cost savings. The solution captures video footage from it’s public vehicles and leverages Google Cloud capabilities like Compute Engine, AI Platform, and BigQuery to automate the review of videos. The project increased pothole detection by 75% with over 90% accuracy. By measuring and demonstrating these outcomes, the team proved the viability of a cost-effective, cloud-based machine learning model and is looking into new applications of AI and ML that will further improve city services and help it build a better future for its 652,000 residents.
Acknowledgements
Filipe and Payam would like to thank our colleague and co-author Mona Mona (AI/ML Customer Engineer, Healthcare and lifesciences) who contributed equally to the writing.
Transform Your Marketing Strategy with Tinyclues and Google Cloud CDP

2615
Of your peers have already read this article.
4:00 Minutes
The most insightful time you'll spend today!
Editor’s note: The post is part of a series highlighting our awesome partners, and their solutions, that are Built with BigQuery.
What are Customer Data Platforms (CDPs) and why do we need them?
Today, customers utilize a wide array of devices when interacting with a brand. As an example, think about the last time you bought a shirt. You may start with a search on your phone as you take the subway to work. During that 20 minute ride, you narrow down the type of shirt . Later, as you take your lunch break, you spend a few more minutes refining your search on your work laptop and you are able to find two shirt models of interest. Pressed for time, you add both to your shopping cart at an online retailer to review at a later point. Finally, after you arrive back home and as you are checking your physical mail, you stumble across a sales advertisement for the type of shirt that you are looking for, available at your local brick and mortar store. The next day you visit that store during your lunch break and purchase the shirt.
Many marketers face the challenge of creating a consistent 360 customer view that captures the customer lifecycle, as illustrated in the example above – including their online/offline journey, interacting with multiple data points across multiple data sources.
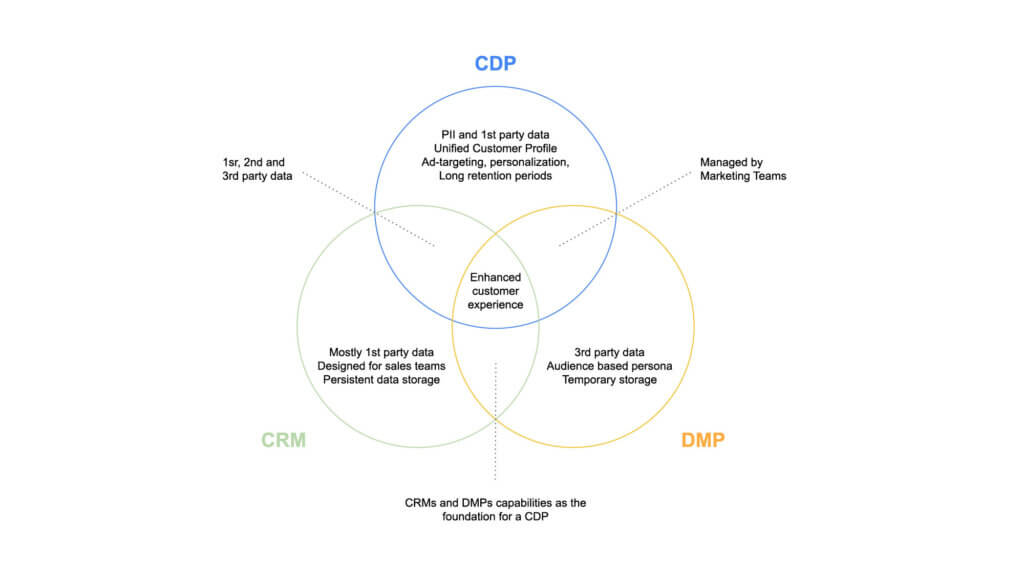
The evolution of managing customer data reached a turning point in the late 90’s with CRM software that sought to match current and potential customers with their interactions. Later as a backbone of data-driven marketing, Data Management Platforms (DMPs) expanded the reach of data management to include second and third party datasets including anonymous IDs. A Customer Data Platform combines these two types of systems, creating a unified, persistent customer view across channels (mobile, web etc) that provide data visibility and granularity at individual level.
A new approach to empowering marketing heroes
Tinyclues is a company that specializes in empowering marketers to drive sustainable engagement from their customers and generate additional revenue, without damaging customer equity. The company was founded in 2010 on a simple hunch: B2C marketing databases contain sufficient amounts of implicit information (data unrelated to explicit actions) to transform the way marketers interact with customers, and a new class of algorithms based on Deep Learning (sophisticated machine learning that mimics the way humans learn) holds the power to unlock this data’s potential. Where other players in the space have historically relied – and continue to rely – on a handful of explicit past behaviors and more than a handful of assumptions, Tinyclues’ predictive engine uses all of the customer data that marketers have available in order to formulate deeply precise models, down even to the SKU level. Tinyclues’ algorithms are designed to detect changes in consumption patterns in real-time, and adapt predictions accordingly.
This technology allows marketers to find precisely the right audiences for any offer during any timeframe, increasing engagement with those offers and, ultimately, revenue; additionally, marketers are able to increase campaign volume while decreasing customer fatigue and opt-outs, knowing that audiences are receiving only the most relevant messages. Tinyclues’ technology also reduces time spent building and planning campaigns by upwards of 80%, as valuable internal resources can be diverted away from manual audience-building.
Google Cloud’s Data Platform, spearheaded by BigQuery, provides a serverless, highly scalable, and cost-effective foundation to build this next generation of CDPs.
Tinyclues Architecture:
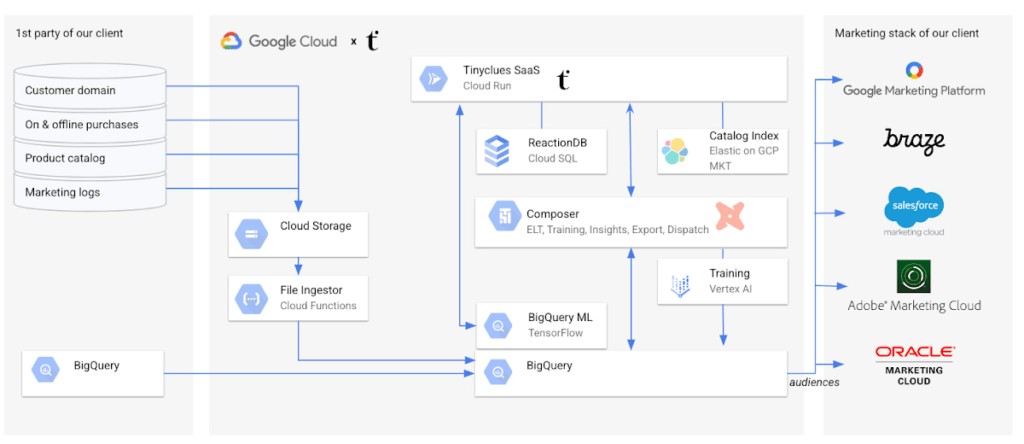
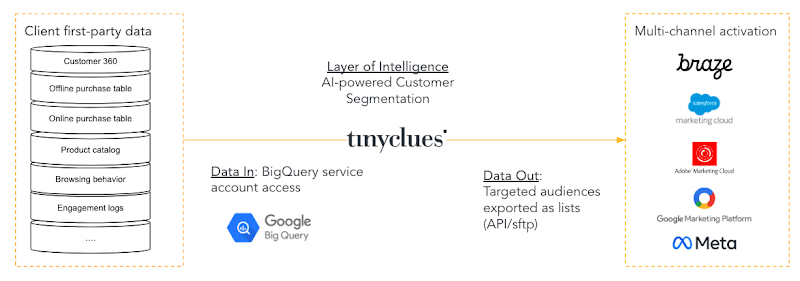
To enable this scalable solution for clients, Tinyclues receives purchase and interaction logs from clients in addition to product and user tables. In most cases, this data is already in the client’s BigQuery instance, in which case they can be easily shared with Tinyclues utilizing BigQuery authorized views.
In cases where the data is not in BigQuery, flat files are sent to Tinyclues via GCS and are ingested in the client’s data set via a lightweight Cloud Function. The orchestration of all pipelines is implemented via Cloud Composer (Google’s managed Airflow). The transformation of data is accomplished by utilizing simple select statements in the Data Built Tool (DBT), which is wrapped inside an airflow DAG that powers all data normalization and transformations. There are several other DAGs to fulfill more functionalities, including:
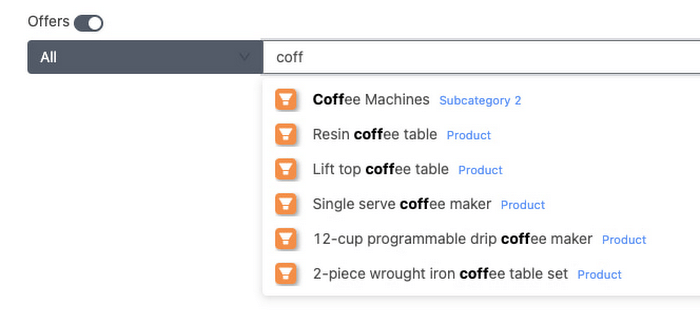
- Indexing the product catalog on Elastic Cloud (Elasticsearch managed service) on GCP to provide auto-complete search capabilities to TCs clients as shown below:
- The export of Tinyclues-powered audiences to the clients’ activation channels, whether they are using SFMC, Braze, Adobe, GMP, or Meta.
Tinyclues AI/ML Pipeline powered by Google Vertex AI
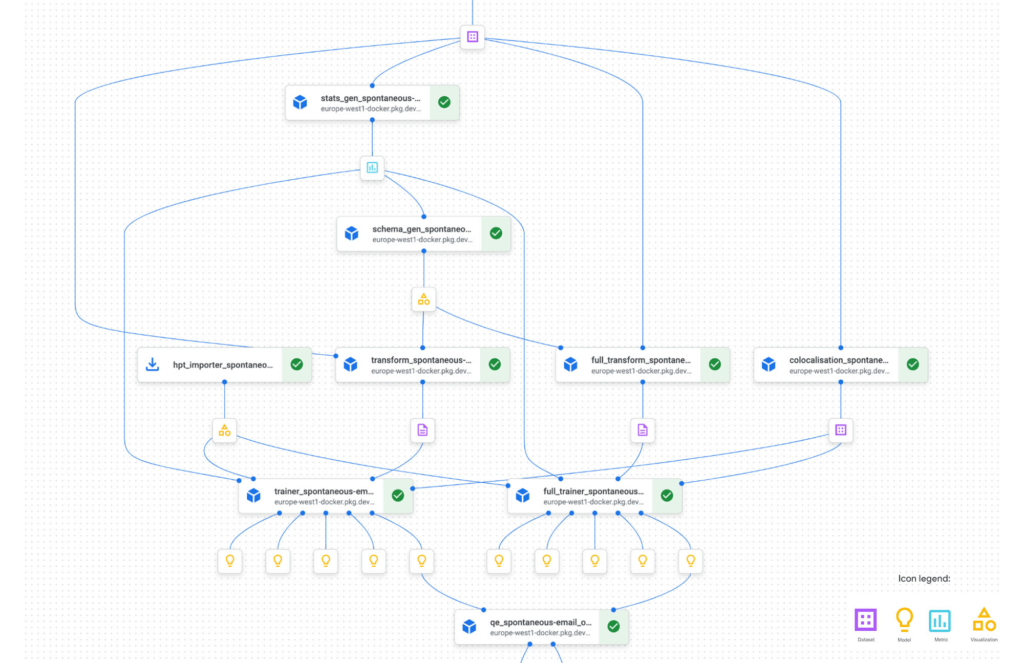
TCs ML Training pipelines are used to train models that calculate propensity scores. They are composed using Airflow DAGs, powered by Tensorflow & Vertex AI Pipelines. BigQuery is used natively, without data movement, to perform as much feature engineering as possible in-place.
TC uses the TFX library to run ML Pipelines in Vertex AI. Building on top of Tensorflow as their main deep learning framework of choice due to its maturity, open source platform, scalability and support for complex data structures (Ragged and Sparse Tensors).
Below is a partial example of TC’s Vertex AI Pipeline graph, illustrating the workflow steps in the training pipeline. This pipeline allows for the modularization & standardization of functionality into easily manageable building blocks. These blocks are composed of TFX components (TC reuses most of the standard components in addition to customizing some such as a proprietary implementation of the Evaluator to compute both ML Metrics (which is part of the standard implementation) but also more Business Metrics like Overlap of clickers etc. The individual components/steps are chained with DSL to form a pipeline that is modular and easily orchestrated or updated as needed.
With the trained Tensorflow models available in GCS, TCs exposes these in BigQuery ML (BQML) to enable their clients to score millions of users for their propensity to buy X or Y within minutes. This would not be possible without the power of BigQuery and also frees TC from previously experienced scalability issues.
As an illustration, TC has the need to score thousands of topics among millions of users. This used to take north of 20 hours on their previous stack, and now takes less than 20 minutes thanks to the optimization work that TC has implemented in their custom algorithm and the sheer power of BQ to scale to any workload accordingly.
Data Gravity: Breaking the Paradigm – Bringing the Model to your Data
BQML enables TC to call pre-trained TensorFlow models within an SQL environment, thus avoiding exporting data in and out of BQ using already provisioned BQ serverless processing power. Using BQML removes the layers between the models and the data warehouse and allows them to express the entire inference pipe as a number of SQL requests. TC no longer has to export data to load it into their models. Instead, they are bringing their models to the data.
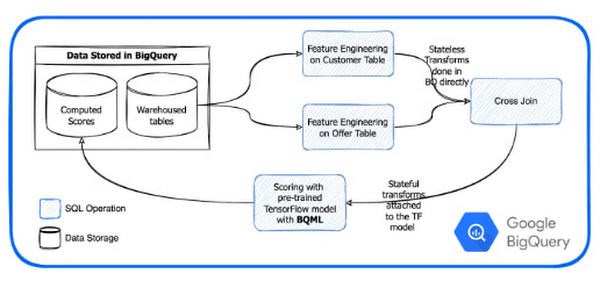
Avoiding the export of data in and out of BQ and the serverless provisioning and start of machines saves significant time. As an example, exporting an 11M lines campaign for a large client previously took 15 min or more to process. Deployed on BQML it now takes minutes with more than half of the processing time attributed to network transfers to our client system.
Inference times in BQML compared to TCs legacy stack:
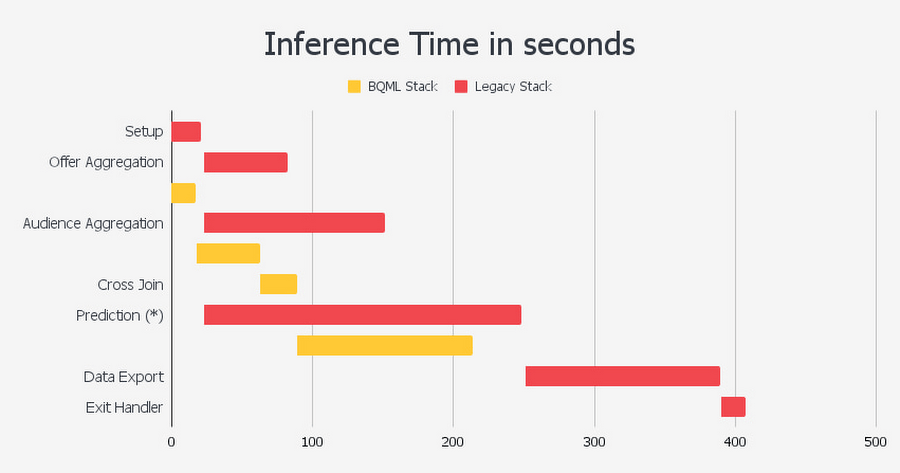
As can be seen, using this approach enabled by BQML, the reduction in the number of steps leads to a 50% decrease in overall inference time, improving upon each step of the prediction.
The Proof is in the pudding
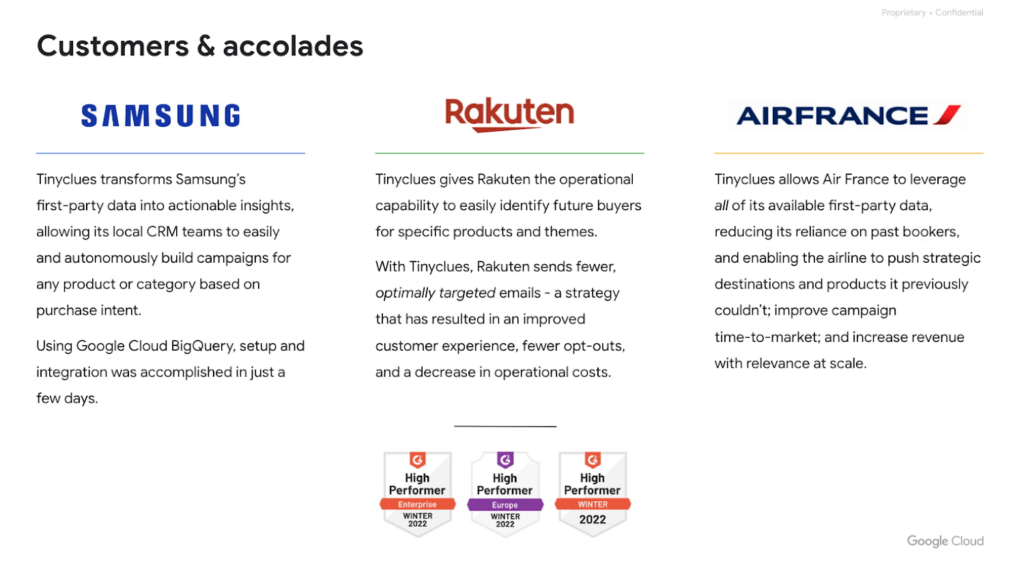
Tinyclues has consistently delivered on its promises of increased autonomy for CRM teams, rapid audience building, superior performance against in-house segmentation, identification of untapped messaging and revenue opportunities, fatigue management, and more, working with partners like Tiffany & Co, Rakuten, and Samsung, among many others.
Conclusion
Google’s data cloud provides a complete platform for building data-driven applications like the headless CDP solution developed by Tinyclues — from simplified data ingestion, processing, and storage to powerful analytics, AI, ML, and data sharing capabilities — all integrated with the open, secure, and sustainable Google Cloud platform. With a diverse partner ecosystem, open-source tools, and APIs, Google Cloud can provide technology companies the portability and differentiators they need to serve the next generation of marketing customers.
To learn more about Tinyclues on Google Cloud, visit Tinyclues. Click here to learn more about Google Cloud’s Built with BigQuery initiative.
We thank the many Google Cloud team members who contributed to this ongoing data platform collaboration and review, especially Dr. Ali Arsanjani in Partner Engineering.
Google Cloud VMware Engine Achieves HIPAA Compliance
6954
Of your peers have already read this article.
1:30 Minutes
The most insightful time you'll spend today!
We are excited to announce that as of April 1, 2021, Google Cloud VMware Engine is covered under the Google Cloud Business Associate Agreement (BAA), meaning it has achieved HIPAA compliance. Healthcare organizations can now migrate and run their HIPAA-compliant VMware workloads in a fully compatible VMware Cloud Verified stack running natively in Google Cloud with Google Cloud VMware Engine, without changes or re-architecture to tools, processes, or applications.
Healthcare organizations increasingly use cloud platforms to personalize patient care, analyze large datasets more effectively, enhance research and development collaboration, and share medical knowledge. Leveraging cloud platforms can also help healthcare organizations increase the privacy and security of information systems, including protected health information (PHI), and, as a result, better comply with applicable laws and regulations while reducing the burden of compliance. For PHI, the Health Insurance Portability and Accountability Act of 1996 (HIPAA) set standards in the United States to protect individually identifiable health information. HIPAA applies to health plans, most healthcare providers, and healthcare clearinghouses that manage PHI electronically, and to persons or entities that perform certain functions on their behalf.
With Google Cloud, organizations can leverage solutions that enable secure, continuous patient care and data-driven clinical and operational decisions with ease, while being empowered with collaboration and productivity tools. Further, Google Cloud Platform supports HIPAA compliance. We offer HIPAA-regulated customers the same products at the same pricing that is available to all customers, unlike many other cloud providers.
For healthcare organizations that leverage VMware on-premises, having a consistent, cloud-integrated platform that provides seamless access to native cloud services unlocks the opportunity to extend, migrate, and modernize healthcare IT infrastructure and applications in a fast, low-risk manner at their own pace. This is especially important for mission-critical healthcare provider workloads, where having a low-risk way to adopt the cloud is important. Google Cloud VMware Engine offers that solution. By achieving coverage under Google Cloud’s BAA, Google Cloud VMware Engine enables healthcare organizations to realize the benefits of cloud computing and stay on track with their HIPAA compliance efforts without additional complexity. This is very relevant in hybrid scenarios, where customers would like to leverage other native cloud services such as analytics and big data processing, without having to enter into multiple BAAs.
Google Cloud VMware Engine offers dedicated, isolated software-defined datacenter environments with fully redundant and dedicated 100 Gbps networking that are suitable for healthcare organizations to run applications storing and processing PHI data. Customers have the ability to encrypt their virtual storage area network (vSAN) using an external key management server. Healthcare customers can run their workloads in a native VMware environment—vSphere, vCenter, vSAN, NSX-T, and HCX—while benefiting from Google Cloud’s highly performant infrastructure to meet the needs of their workloads. Customers can connect their VMware applications to native Google Cloud services such as BigQuery and artificial intelligence (AI) to derive new insights from existing data and quickly make informed decisions.
Protecting against and mitigating the impact of ransomware attacks is top-of-mind for Healthcare organizations. This requires building a cyber resilience program and back-up strategy to prepare for how users can restore core systems or assets affected by a security (in this case, ransomware) incident. This is a critical function for supporting recovery timelines and lessening the impact of a cyber event so organizations can get back to operating their business. Google Cloud VMware Engine in combination with Google Cloud first party solutions such as Actifio Go, or partner solutions such as NetApp CVO can provide an efficient way to recover incremental point-in-time backups along with on-demand provisioning of new compute to recover both data and infrastructure from Ransomware attacks quickly and efficiently.
Healthcare customers can also use Google Cloud VMware Engine as a disaster recovery (DR) target for their on-premises VMware workloads. Healthcare organizations also need a business continuity plan for their mission critical applications. When a disaster occurs, hospitals need their data protected so they can quickly get back to treating patients. It is a HIPAA requirement that healthcare organizations must be able to recover from a natural disaster. Google Cloud VMware Engine offers a like-for-like cost-effective DR target for these customers. The DR environment can be operated without new training using the same tools as their on-premises deployment. Google Cloud VMware Engine is currently available in 12 regions across the globe including three regions in the US, which means our regional and multi-national customers can take advantage of this service for geographic diversification as well.
If you are interested in understanding more and taking advantage of Google Cloud VMware Engine, contact your Google sales team now.
For details, see HIPAA compliance on Google Cloud Platform.
1165
Of your peers have already watched this video.
5:30 Minutes
The most insightful time you'll spend today!
Prototyping Language Applications Made Easy with Generative AI
Did you know generative AI allows developers to prototype applications quickly? With Generative AI Studio on Google Cloud, developers can quickly explore and customize AI models that can be leveraged in Google Cloud applications. Watch along and see how developers, with the right tools, can experiment with new ideas in minutes instead of months.
Chapters:
0:00 – Intro
0:29 – Get started with Vertex Generative AI Studio
1:06 – Write your first prompt in Generative AI Studio
1:47 – Prototyping Q&A systems from background text
3:00 – How to save prompts
4:05 – How do LLMs produce output text?
4:41 – Wrap up
Check out more Generative AI for Developers videos → https://goo.gle/GenAIforDevs
Subscribe to Google Cloud Tech → https://goo.gle/GoogleCloudTech
VertexAI #GenerativeAI
More Relevant Stories for Your Company

How Google Cloud Solutions Help Retail Firms to ABP(Always Be Pivoting)
For years, retailers have been told that they must embrace a litany of new technologies, trends, and imperatives like online shopping, mobile apps, omnichannel, and digital transformation. In search of growth and stability, retailers adopted many of these, only to realize that for every box they ticked, there was another

Dataplex: Google Cloud’s Intelligent Data Fabric to Manage Data and Analytics at Scale
Enterprises are struggling to make high quality data easily discoverable and accessible for analytics, across multiple silos, to a growing number of people and tools within their organization. They are often forced to make tradeoffs—to move and duplicate data across silos to enable diverse analytics use cases or leave their

Incorporating Custom Holidays into Your Time-Series Models with BigQuery ML
About three years ago, JCB, one of the biggest Japanese payment companies, launched a project to develop new high-value services with agility. We set up a policy of starting small from scratch without using the existing system, which we call the concept of “Dejima”, where we focused on improving various aspects

World’s Largest Online-only Grocery Retailer Uses AI to Figure Which Customers Need Most Attention
In the United Kingdom, the popularity of online grocery shopping is expected to surge from about 6% of the market today to 9% by 2021, according to market research firm Mintel. One of the pioneers of online-only grocery retailing is Ocado, based in Hatfield, Hertfordshire in the U.K. Since starting commercial deliveries
