





Google Cloud Tools Help U.S. Forest Department Generate Years of Insights into Earth’s Natural Resources

5025
Of your peers have already read this article.
3:00 Minutes
The most insightful time you'll spend today!
For 117 years, the U.S. Department of Agriculture’s Forest Service has been a steward of America’s forests, grasslands, and waterways. It directly manages 193 million acres and supports sustainable management on a total of 500 million acres of private, state, and tribal lands. Its impact reaches far beyond even that, offering its research and learning freely to the world.
At Google, we’re big admirers of the Forest Service’s mission. So we were thrilled to learn in 2011 that its scientists were using Google Earth Engine, our planetary-scale platform for Earth Science data and analysis, to aid its research, understanding, and effectiveness. In the years since, Google has worked with the Forest Service to meet its unique requirements for visual information about the planet. Using both historical and current data, the Forest Service built new products, workflows, and tools that help more effectively and sustainably manage our natural resources. The Forest Service also uses Earth Engine and Google Cloud to study the effects of climate change, forest fires, insects and disease, helping them create new insights and strategies.
Besides gaining newfound depths of insight, the Forest Service has also sped up its research dramatically, enabling everyone to do more. Using Google Cloud and Earth Engine, the Forest Service reduced the time it took to analyze 10 years worth of land-cover changes from three months to just one hour, using just 100 lines of code. The agency built new models for coping with change, then mapped these changes over time, in its Landscape Change Monitoring System (LCMS) project.
Emergency responders can now work better on new threats that arise after wildfires, hurricanes, and other natural disasters. Forest health specialists can detect and monitor the impacts of invasive insects, diseases, and drought. More Forest Service personnel can use new tools and products within Earth Engine, thanks to numerous training and outreach sessions within the Forest Service.
Researchers elsewhere also benefited when the Forest Service created new toolkits, and posted them to GitHub for public use. For example, there’s geeViz, a repository of Google Earth Engine Python code modules useful for general data processing, analysis, and visualization.
This is only the start. Recently, the Forest Service started using Google Cloud’s processing and analysis tools for projects like California’s Wildfire and Forest Resilience Action Plan. Forest Service researchers also use Google Cloud to better understand ecological conditions across landscapes in projects like Fuelcast, which provides actionable intelligence for rangeland managers, fire specialists, and growers, and the Scenario Investment Planning Platform for modeling local and national land management scenarios.
The Forest Service is a pioneer in building technology to help us better understand and care for our planet. With more frequent imaging, rich satellite data sets, and sophisticated database and computation systems, we can view and model the Earth as a large-scale dynamic system.
We are honored and excited to respond to the unique set of requirements of the scientists, engineers, rangers, and firefighters of the USFS, and look forward to years of learning about — and better caring for — our most precious resources.
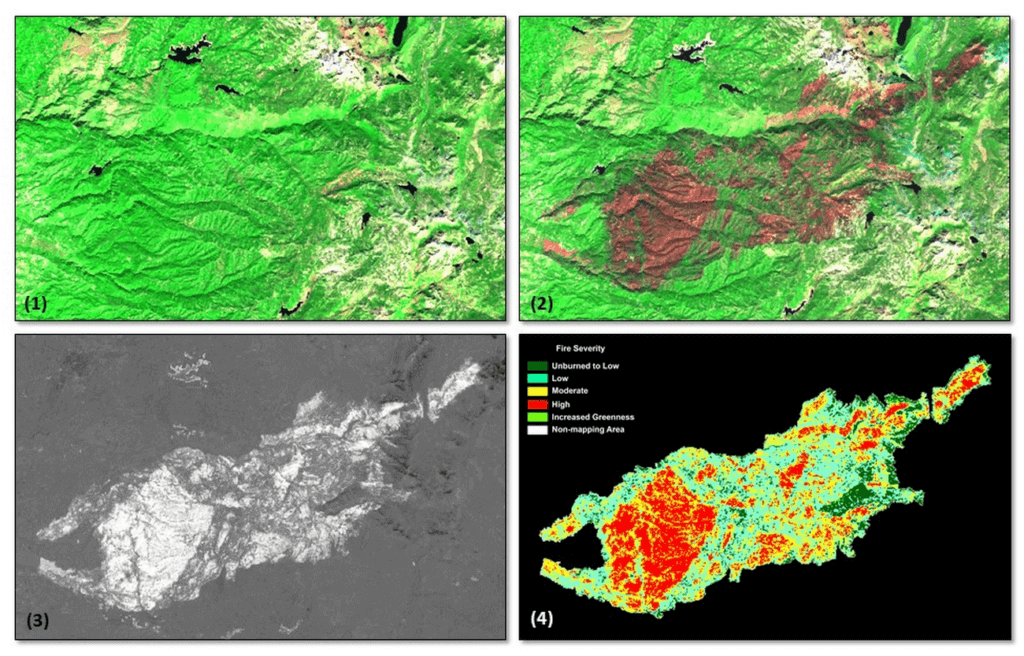
*Image 1: The USDA Forest Service (USFS) Geospatial Technology and Applications Center (GTAC) uses science-based remote sensing methods to characterize vegetation and soil condition after wildland fire events. The results are used to facilitate emergency assessments to support hazard mitigation, to inform post-fire restoration planning, and to support the monitoring of national fire policy effectiveness. GTAC currently conducts these mapping efforts using long-established geospatial workflows. However, GTAC has adapted its post-fire mapping and assessment workflows to work within Google Earth Engine (GEE) to accommodate the needs of other users in the USFS. The spatially and temporally comprehensive coverage of moderate resolution multispectral data sources (e.g., Landsat, Sentinel 2) and analytical power provided by GEE allows users to create geospatial burn severity products quickly and easily. Box 1 shows a pre-fire Sentinel-2 false color composite image. Box 2 shows a post-fire Sentinel-2 false color composite image with the fire scar apparent in reddish brown. Box 3 shows a differenced Normalized Burn Ratio (dNBR) image showing the change between the pre- and post-fire images in Boxes 1 and 2. Box 4 shows a thresholded dNBR image of the burned area with four classes of burn severity (unburned to high severity), which is the final output delivered to forest managers.
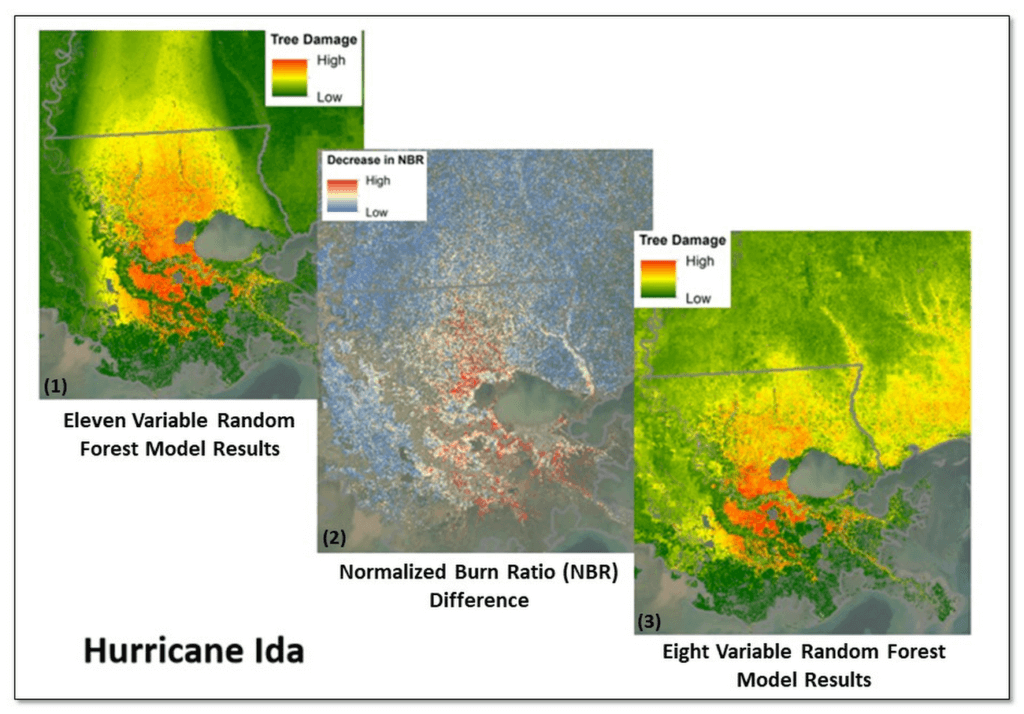
*Image 2: Leveraging Google Earth Engine (GEE), the USDA Forest Service (USFS) Geospatial Technology and Applications Center (GTAC) and USFS Region 8, developed the Tree Structure Damage Impact Predictive (TreeS-DIP) modeling approach to predict wind damage to trees resulting from large hurricane events and produce spatial products across the landscape. TreeS-DIP results become available within 48 hours following landfall of a large storm event to allow allocation of ground resources to the field for strategic planning and management. Boxes 1 and 3 above show TreeS-DIP modeled outputs with varying data inputs and parameters. Box 2 shows changes in greenness (Normalized Burn Ratio; NBR) that was measured with GEE during the recovery from Hurricane Ida and is shown as a visual comparison to the rapidly available products from TreeS-DIP.
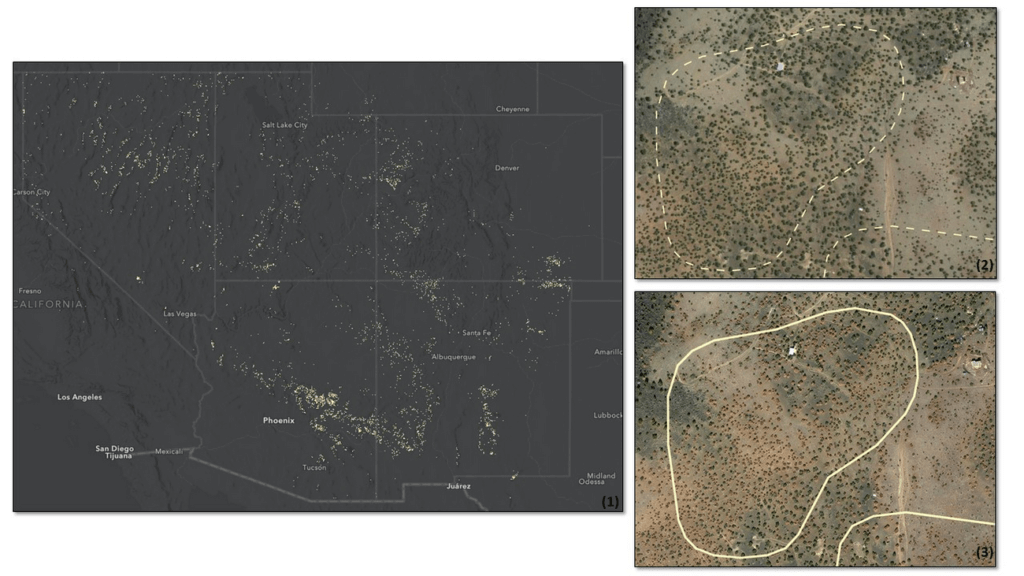
*Image 3: Severe drought conditions across the American West prompted concern about the health and status of pinyon-juniper woodlands, a vast and unique ecosystem. In a cooperative project between the USDA Forest Service (USFS) Geospatial Technology and Applications Center (GTAC) and Forest Health Protection (FHP), Google Earth Engine (GEE) was used to map pinyon pine and juniper mortality across 10 Western US States. The outputs are now being used to plan for future work including on-the-ground efforts, high-resolution imagery acquisitions, aerial surveys, in-depth mortality modeling, and planning for 2022 field season work.
Box 1 contains remote sensing change detection outputs (in white) generated with GEE, showing pinyon-juniper decline across the Southwestern US. Box 2 shows NAIP imagery from 2017 with, with box 3 showing NAIP imagery from 2021. NAIP imagery from these years shows trees changing from healthy and green in 2017 to brown and dying in 2021. In addition, box 2 and box 3 show change detection outputs from Box 1 for a location outside of Flagstaff, AZ converted to polygons (in white). The polygon in box 2 is displayed as a dashed line to serve as a reference, while the solid line in box 3 shows the measured change in 2021. Converting rasters to polygons allows the data to be easily used on tablet computers, as well as the ability to add information and photographs from field visits.
6090
Of your peers have already watched this video.
48:30 Minutes
The most insightful time you'll spend today!
Can Your Data Warehouse Handle a 100-Trillion Row Query?
Today’s enterprise demands from data go far beyond the capabilities of traditional data warehousing and for many leaders, the need to digitally transform their businesses is a key driver for data analytics spending.
Businesses want to make real-time decisions from fresh information as well as make future predictions from their data in order to remain competitive.
In this video, Jordan Tigani, Director of Product Management, Google BigQuery reveals the power of Google Cloud’s modern data warehouse, BigQuery, that helps businesses make informed decisions quickly.
In addition, he talks about how big Google BigQuery can get. He shares examples of how one customer ran a query against a giant table of 100 trillion rows. “I think it was something like 19 petabytes of data scanned. It took about took about 20 minutes. It used 39,000 slots, which is about 20,000 cores,” says Tigani.
He also shares examples of how businesses, such as online retailer, Zulily generate real business benefits from being able to query large datasets faster, and more easily than ever–without having to invest time managing infrastructure.
Finally, Amir Aryanpour, Technical Architect, Channel 4, talks abouut how connecting connecting Google BigQuery to other solutions with the Google Cloud Platform, including storage, data visualisation, and a sentiment analysis engine, among others, helped the company.
Google Cloud Next 21 for Data Analytics Unplugged

4962
Of your peers have already read this article.
4:30 Minutes
The most insightful time you'll spend today!
October 23rd (this past Saturday!) was my 4th Googlevarsery and we are wrapping an incredible Google Next 2021!
When I started in 2017, we had a dream of making BigQuery Intelligent Data Warehouse that would power every organization’s data driven digital transformation.
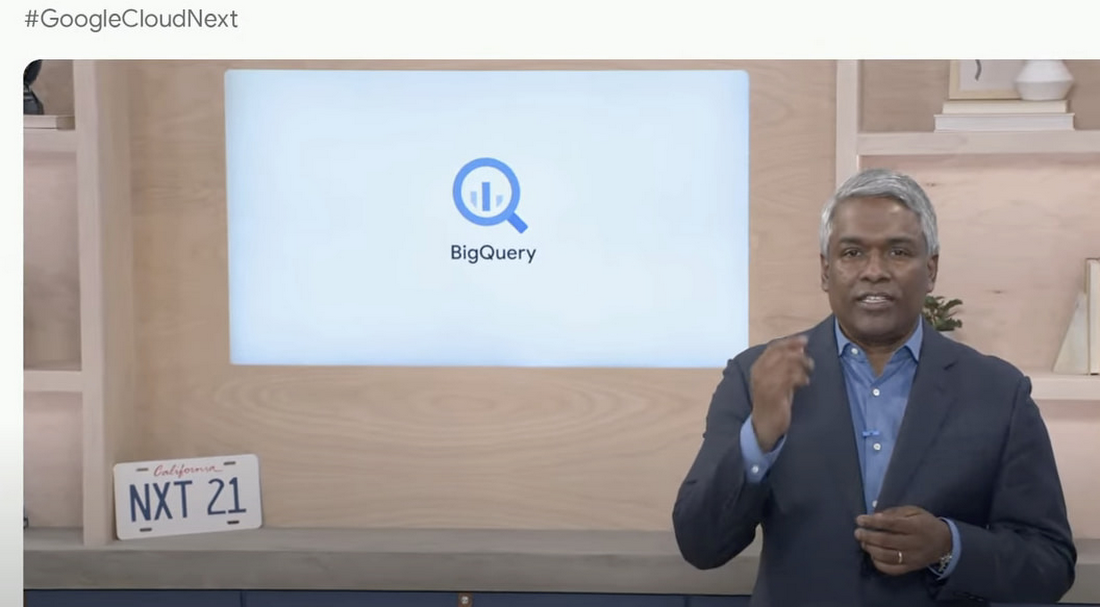
This year at Next, It was amazing to see Google Cloud’s CEO, Thomas Kurian, kick off his keynote with CTO of WalMart, Suresh Kumar , talking about how his organization is giving its data the “BigQuery treatment”.
AS I recap Next 2021 and reflect on our amazing journey over the past 4 years, I’m so proud of the opportunity I’ve had to work with some of the world’s most innovative companies from Twitter to Walmart to Home Depot, Snap, Paypal and many others.
So much of what we announced at Next is the result of years of hard work, persistence and commitment to delivering the best analytics experience for customers.
I believe that one of the reasons why customers choose Google for data is because we have shown a strong alignment between our strategy and theirs and because we’ve been relentlessly delivering innovation at the speed they require.
Unified Smart Analytics Platform
Over the past 4 years our focus has been to build industries leading unified smart analytics platforms. BigQuery is at the heart of this vision and seamlessly integrates with all our other services. Customers can use BigQuery to query data in BigQuery Storage, Google Cloud Storage, AWS S3, Azure Blobstore, various databases like BigTable, Spanner, Cloud SQL etc. They can also use any engine like Spark, Dataflow, Vertex AI with BigQuery. BigQuery automatically syncs all its metadata with Data Catalog and users can then run a Data Loss Prevention service to identify sensitive data and tag it. These tags can then be used to create access policies.
In addition to Google services, all our partner products also integrate with BigQuery seamlessly. Some of the key partners highlighted at Next 21 included Data Ingestion (Fivetran, Informatica & Confluent), Data preparation (Trifacta, DBT), Data Governance (Colibra), Data Science (Databricks, Dataiku) and BI (Tableau, PowerBI, Qlik etc).
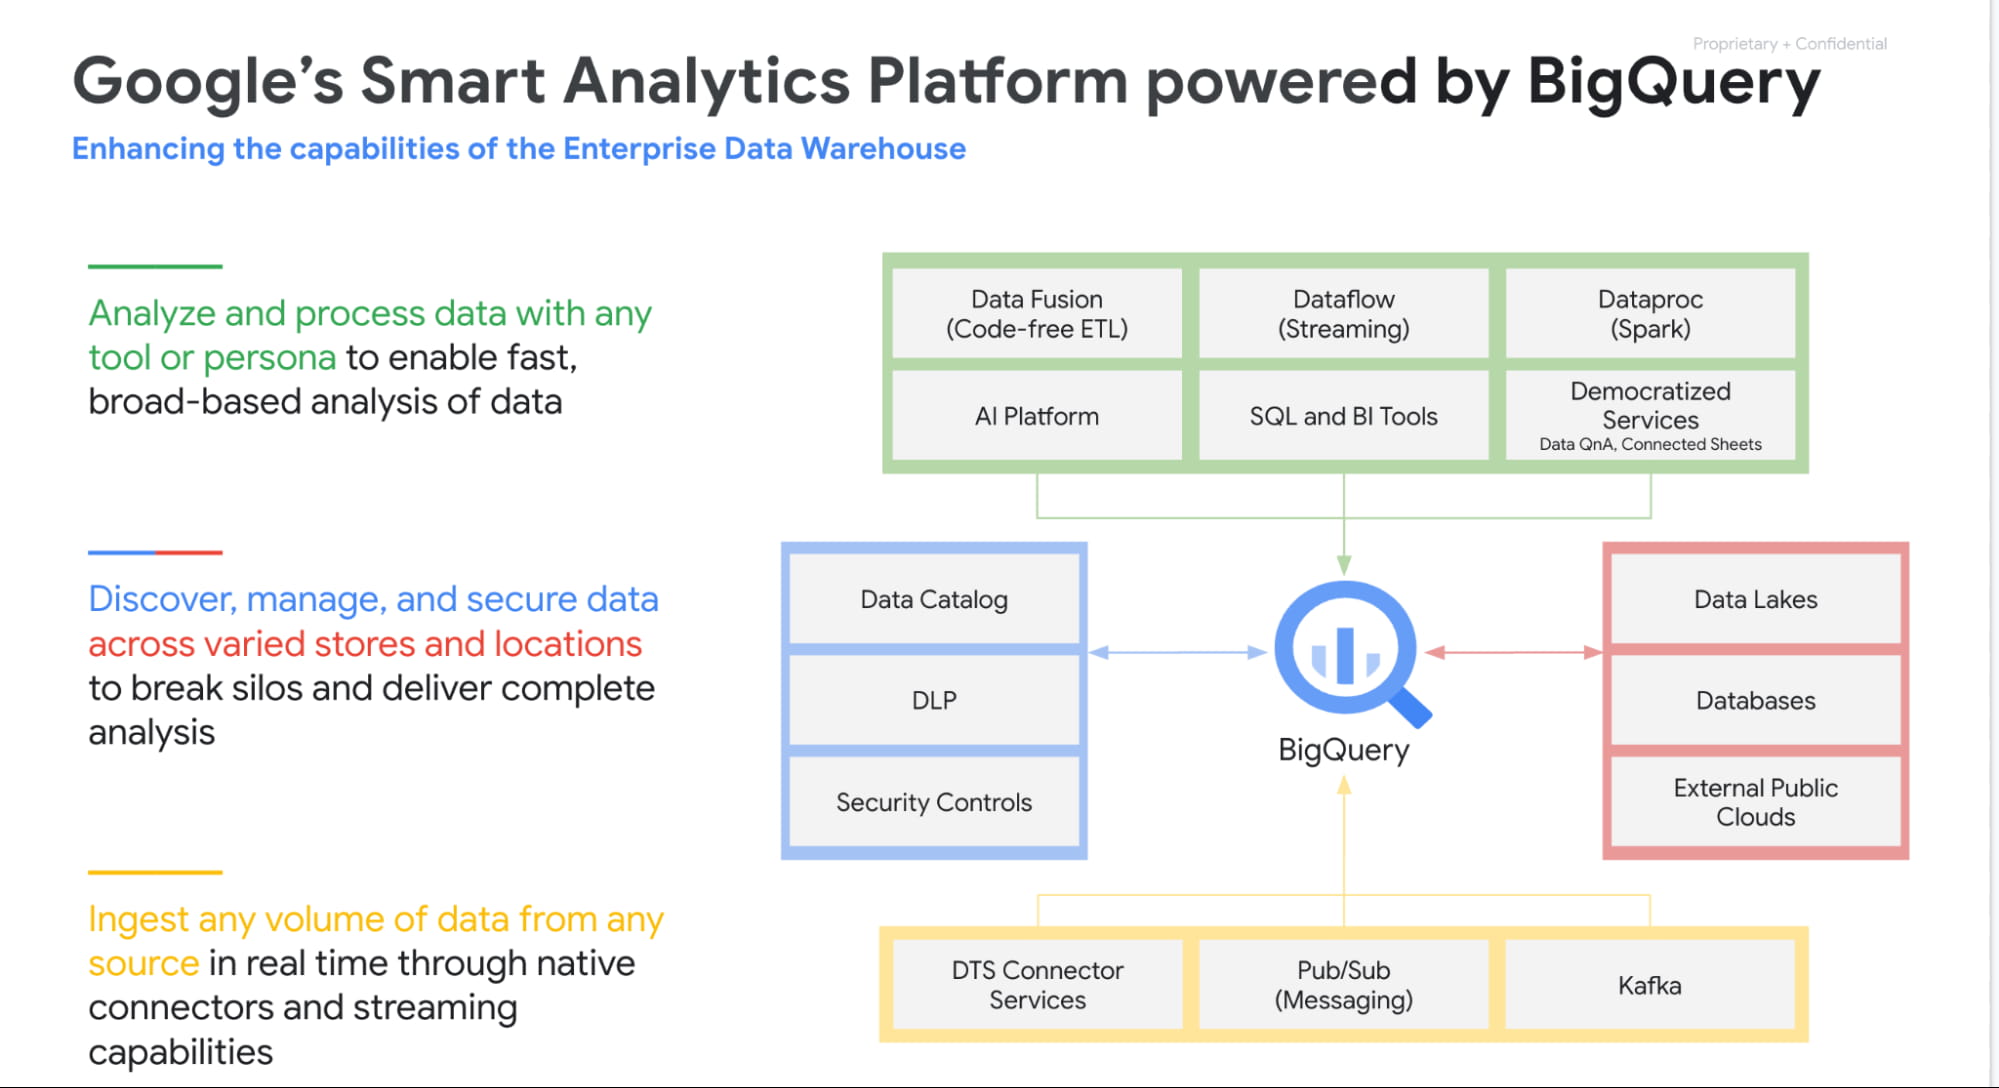
Planet Scale analytics with BigQuery
BigQuery is an amazing platform and over the past 11 years we have continued to innovate in various aspects. Scalability has always been a huge differentiator for BigQuery. BigQuery has many customers with more than 100 petabytes of data and our largest customer is now approaching an exabyte of data. Our large customers have run queries over trillions of rows.
But scale for us is not just about storing or processing a lot of data. Scale is also how we can reach every organization in the world. This is the reason we launched BigQuery Sandbox which enables organizations to get started with BigQuery without a credit card. This has enabled us to reach tens of thousands of customers. Additionally to make it easy to get started with BigQuery we have built integrations with various Google tools like Firebase, Google Ads, Google Analytics 360, etc.
Finally, to simplify adoption we now provide options for customers to choose whether they would like to pay per query, buy flat rate subscriptions or buy per second capacity. With our autoscaling capabilities we can provide customers best value by mixing flat rate subscription discounts with auto scaling with flex slots.
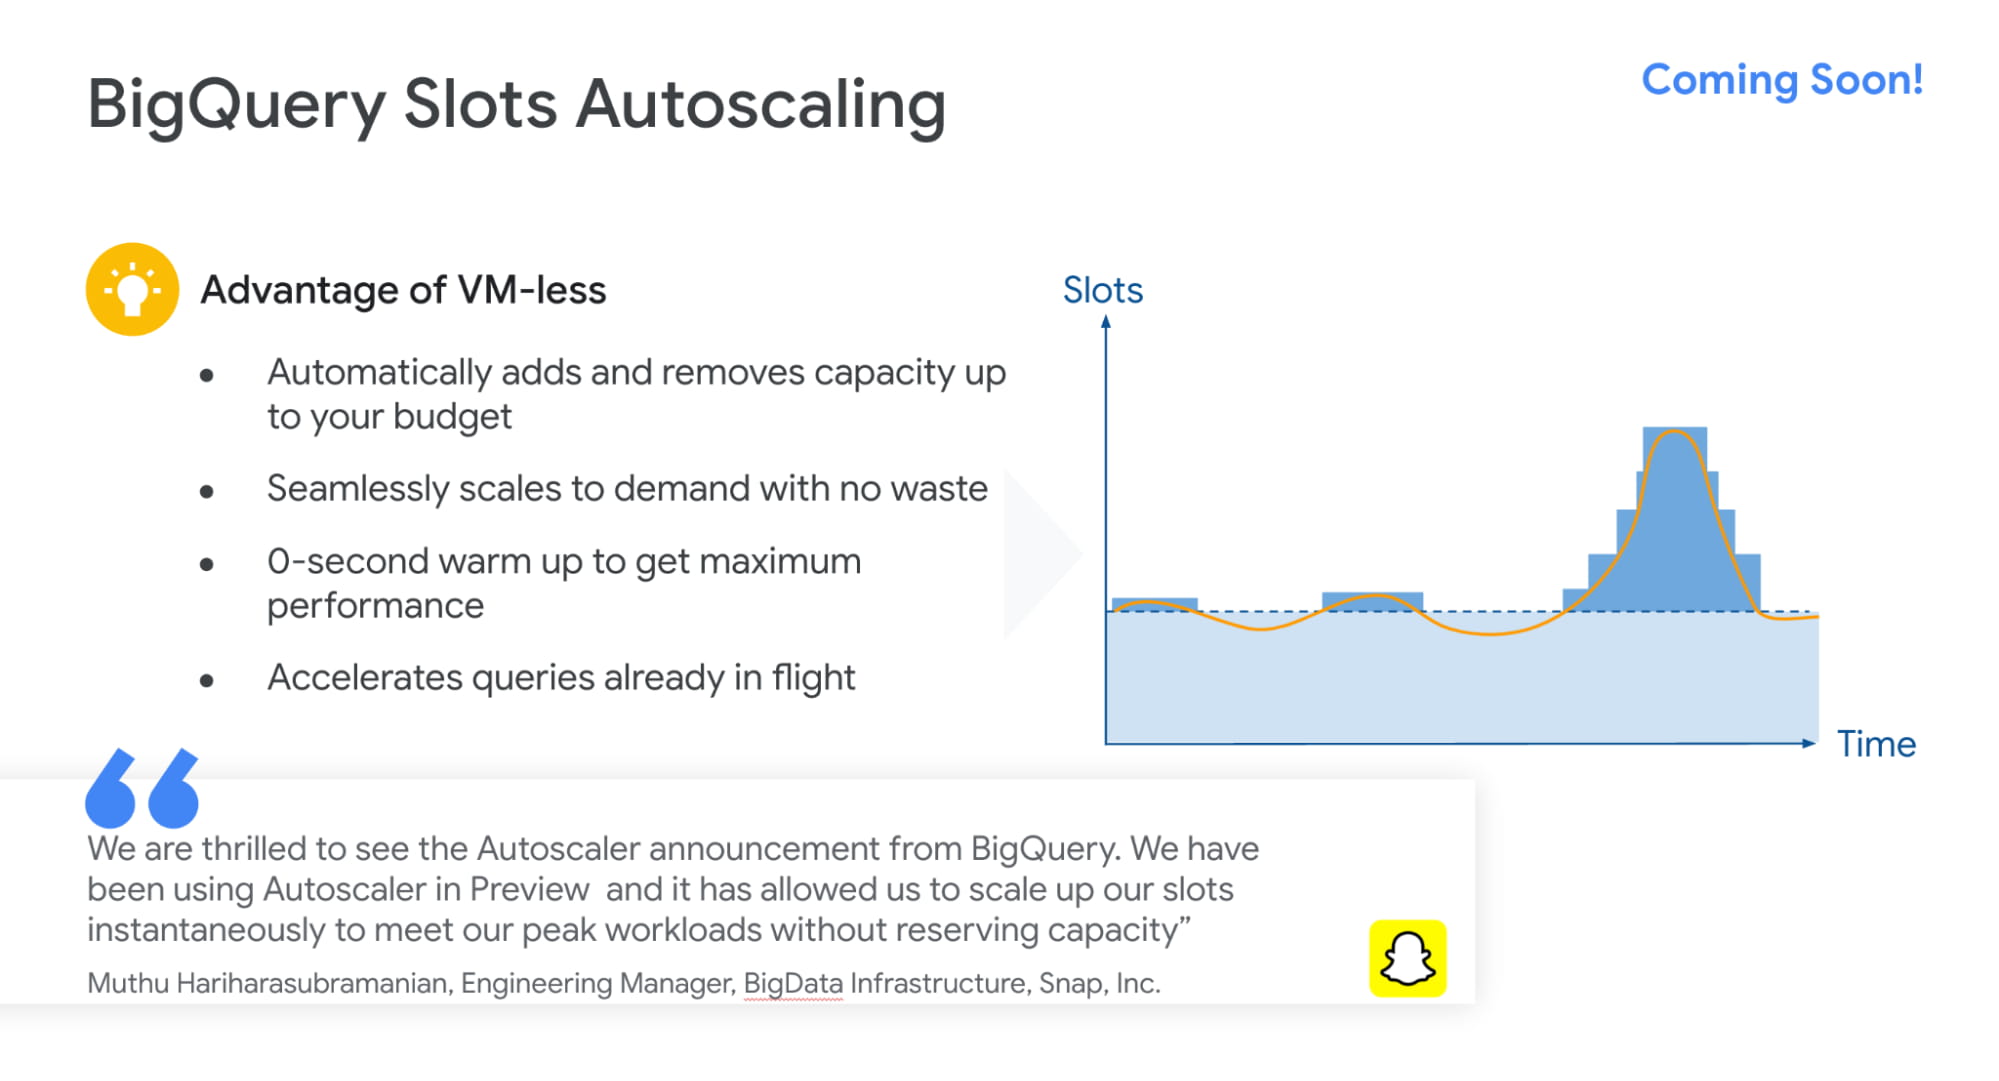
Intelligent Data Warehouse to empower every data analyst to become a data scientist
BigQuery ML is one of the biggest innovations that we have brought to market over the past few years. Our vision is to make every data analyst a data scientist by democratizing Machine learning. 80% of time is spent in moving, prepping and transforming data for the ML platform. This also causes a huge data governance problem as now every data scientist has a copy of your most valuable data. Our approach was very simple. We asked:”what if we could bring ML to data rather than taking data to an ML engine?”
That is how BigQuery ML was born. Simply write 2 lines of SQL code and create ML models.
Over the past 4 years we have launched many models like regression, matrix factorization, anomaly detection, time series, XGboost, DNN etc. These models are used by customers to solve complex business problems simply from segmentation, recommendations, time series forecasting, package delivery estimation etc. The service is very popular: 80%+ of our top customers are using BigQueryML today. When you consider that the average adoption rate of ML/AI is in the low 30%, 80% is a pretty good result!

We announced tighter integration of BQML with Vertex AI. Model explainability will provide the ability to explain the results of predictive ML classification and regression models by understanding how each feature contributes to the predicted result. Also users will be able to manage, compare and deploy BigQuery ML models in Vertex; leverage Vertex Pipelines to train and predict BigQuery ML models.
Real-time streaming analytics with BigQuery
Customer expectations are changing and everyone wants everything in an instant: according to Gartner, by the end of 2024, 75% of enterprises will shift from piloting to operationalizing AI, driving a 5X increase in streaming data and analytics infrastructures.
The BigQuery’s storage engine is optimized for real-time streaming. BigQuery supports streaming ingestion of 10s of millions of events in real-time and there is no impact on query performance. Additionally customers can use materialized views and BI Engine (which is now GA) on top of streaming data. We guarantee always fast, always fresh data. Our system automatically updates MVs and BI Engine.
Many customers also use our PubSub service to collect real-time events and process these through Dataflow prior to ingesting into BigQuery. This is a streaming ETL pattern which is very popular. Last year,we announced PubSub Lite to provide customers with a 90% lower price point and aTCO that is lower than any DIY Kafka deployment.
We also announced Dataflow Prime, it is our next generation platform for Dataflow. Big Data processing platforms have only focused on horizontal scaling to optimize workloads. But we have seen new patterns and use cases like streaming AI where you may have a few steps in pipelines that perform data prep and then customers have to run a GPU based model. Customers want to use different sizes and shapes of machines to run these pipelines in the most optimum manner. This is exactly what Dataflow Prime does. It delivers vertical auto scaling with the right fitting for your pipelines. We believe this should lower costs for pipelines significantly.
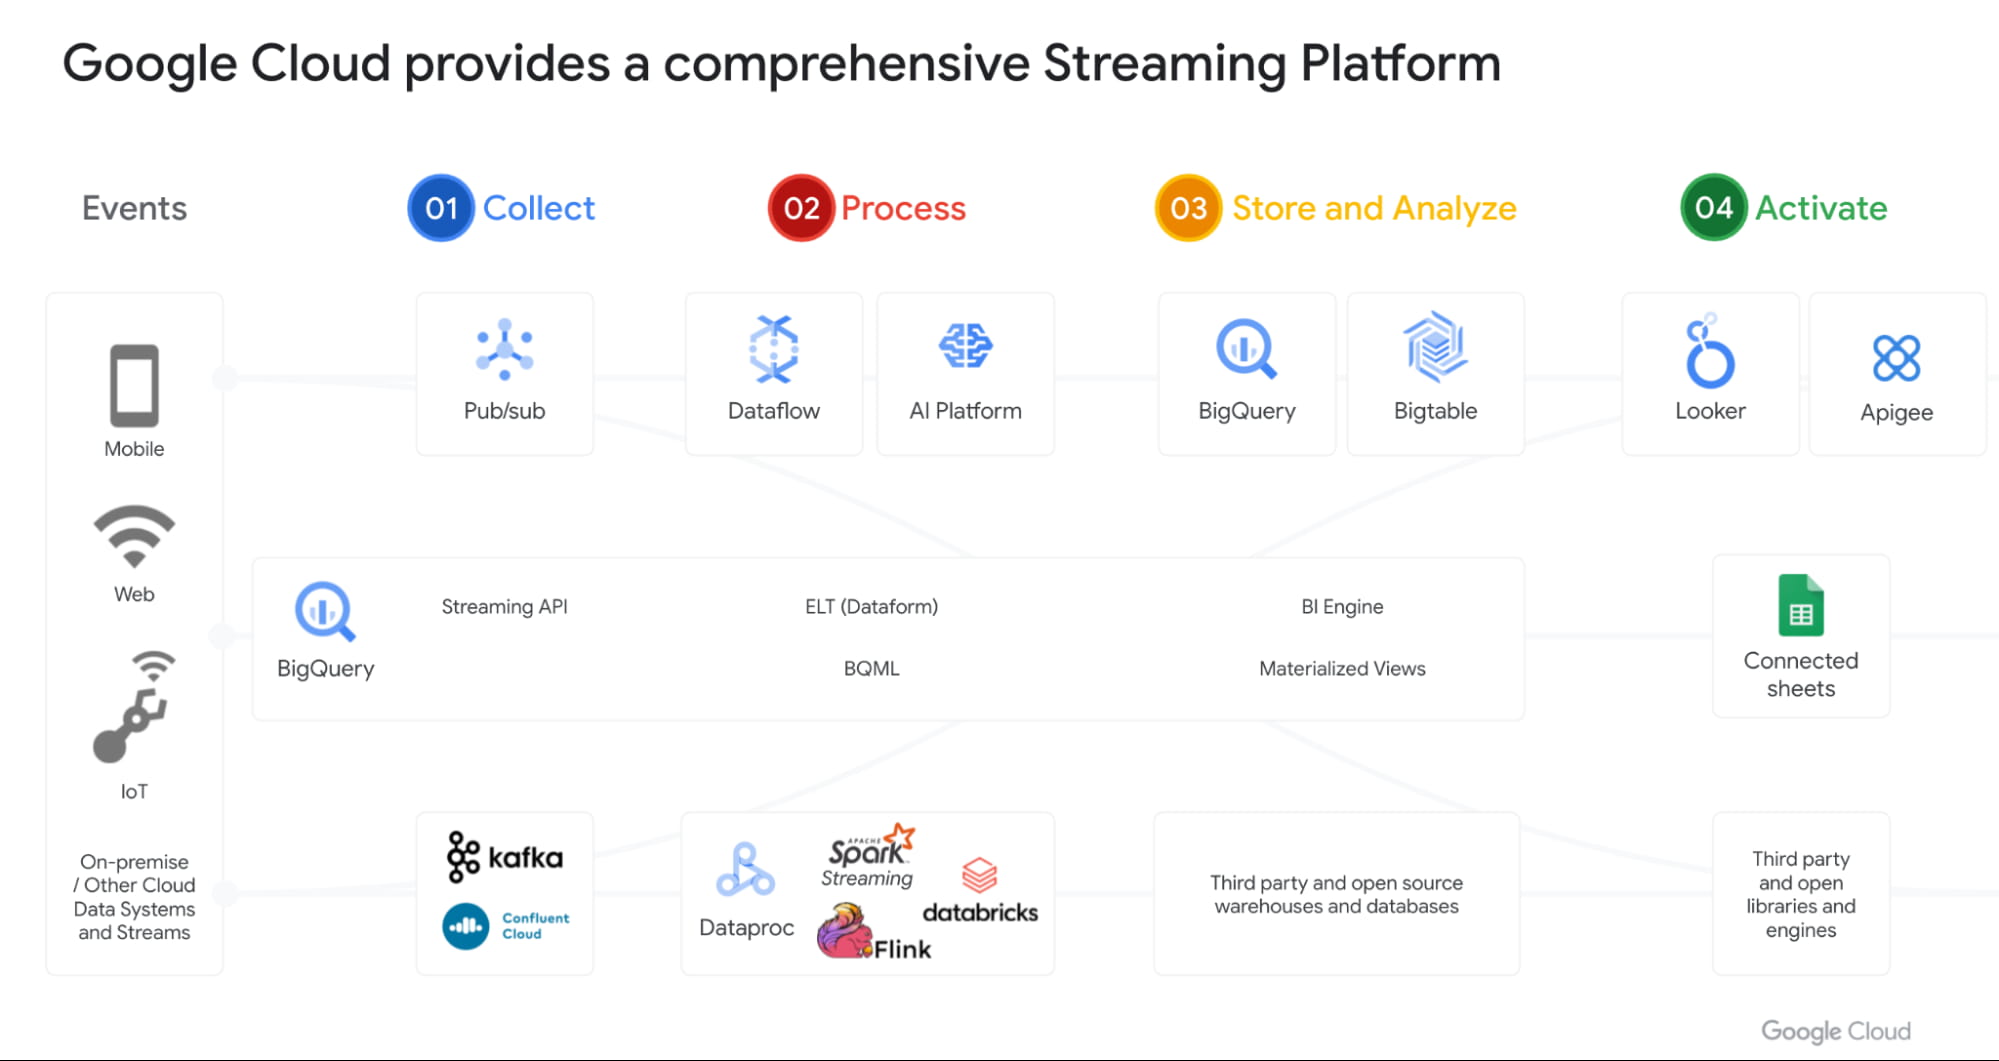
With Datastream as our change data capture service (built on Alooma technology), we have solved the last key problem space for customers. We can automatically detect changes in your operational databases like MySQL, Postgres, Oracle etc and sync them in BigQuery.
Most importantly, all these products work seamlessly with each other through a set of templates. Our goal is to make this even more seamless over next year.
Open Data Analytics with BigQuery
Google has always been a big believer in Open Source initiatives. Our customers love using various open source offerings like Spark, Flink, Presto, Airflow etc. With Dataproc & Composer our customers have been able to run various of these open source frameworks on GCP and leverage our scale, speed and security. Dataproc is a great service and delivers massive savings to customers moving from on-prem Hadoop environments. But customers want to focus on jobs and not clusters.
That’s why we launched Dataproc Serverless Spark (GA) offering at Next 2021. This new service adheres to one of our key design principles we started with: make data simple.
Just like with BigQuery, you can simply RUN QUERY. With Spark on Google Cloud, you simply RUN JOB. ZDNet did a great piece on this. I invite you to check it out!
Many of our customers are moving to Kubernetes and wanted to use that as the platform for Spark. Our upcoming Spark on GKE offering will give the ability to deploy spark workloads on existing Kubernetes clusters.
But for me the most exciting capability we have is, the ability to run Spark directly on BigQuery Storage. BigQuery storage is highly optimized analytical storage. By running Spark directly on it, we again bring compute to data and avoid moving data to compute.
BigSearch to power Log Analytics
We are bringing the power of Search to BigQuery. Customers already ingest massive amounts of log data into BigQuery and perform analytics on it. Our customers have been asking us for better support for native JSON and Search. At Next 21 we announced the upcoming availability of both these capabilities.
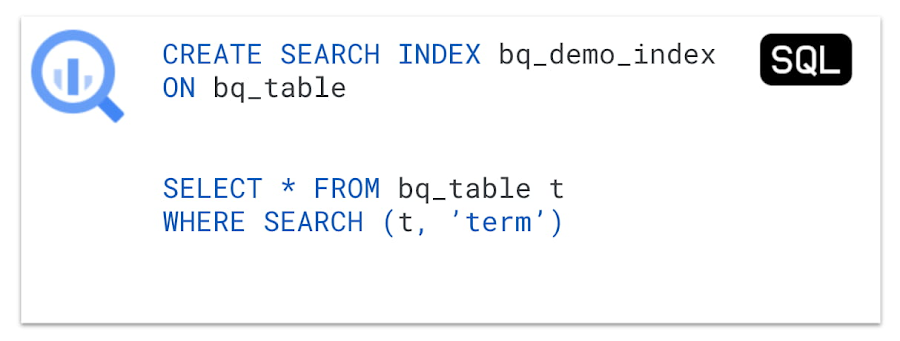
Fast cross column search will provide efficient indexing of structured, semi-structured and unstructured data. User friendly SQL functions let customers rapidly find data points without having to scan all the text in your table or even know which column the data resides in.
This will be tightly integrated with native JSON, allowing customers to get BigQuery performance and storage optimizations on JSON as well as search on unstructured or constantly changing data structures.
Multi & Cross Cloud Analytics
Research on multi cloud adoption is unequivocal — 92% of businesses in 2021 report having a multi cloud strategy. We have always believed in providing customers choice to our customers and meeting them where they are. It was clear that all our customers wanted us to take our gems like BigQuery to other clouds as their data was distributed on different clouds.
Additionally it was clear that customers wanted cross cloud analytics not multi-cloud solutions that can just run in different clouds. In short, see all their data with a single pane of glass, perform analysis on top of any data without worrying about where it is located, avoid egress costs and finally perform cross cloud analysis across datasets on different clouds.
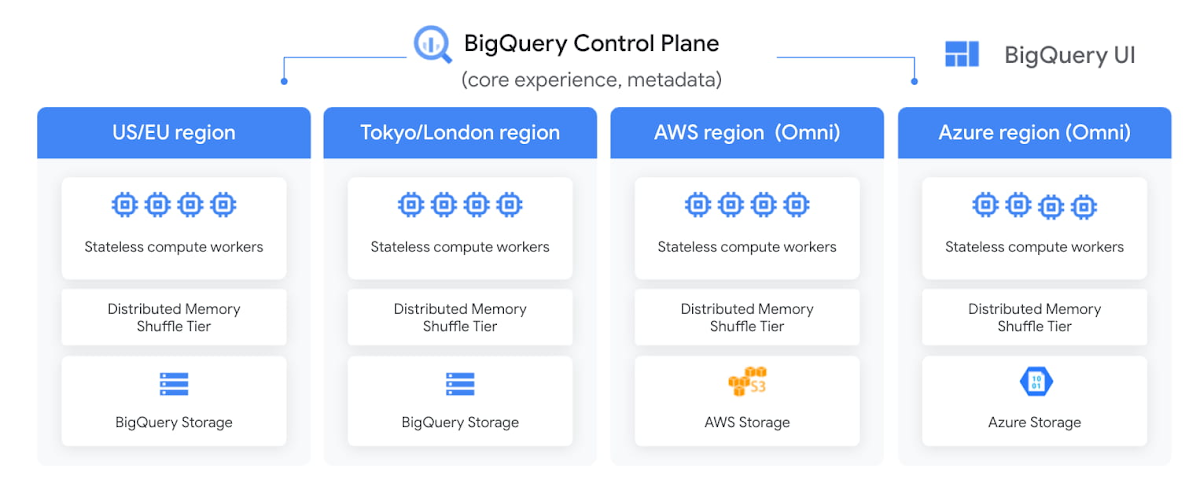
With BigQuery Omni, we deliver on this vision, with a new way of analyzing data stored in multiple public clouds. Unlike competitors, BigQuery Omni does not create silos across different clouds. BigQUery provides a single control plane that shows an analyst all data they have access to across all clouds. Analyst just writes the query and we send it to the right cloud across AWS, Azure or GCP to execute it locally. Hence no egress costs are incurred.
We announced BQ Omni GA for both AWS and Azure at Google Next 21 and I’m really proud of the team for delivering on this vision. Check out Vidya’s session and learn from Johnson and Johnson how they innovate in a multi-cloud world.
Geospatial Analytics with BigQuery and Earth Engine
We have partnered with our Google Geospatial team to deliver GIS functionality inside BigQuery over the years. At Next we announced that customers will be able to integrate Earth Engine with BigQuery, Google Cloud’s ML technologies, and Google Maps Platform.
Think about all the scenarios and use-cases your team’s going to be able to enable sustainable sourcing, saving energy or understanding business risks.
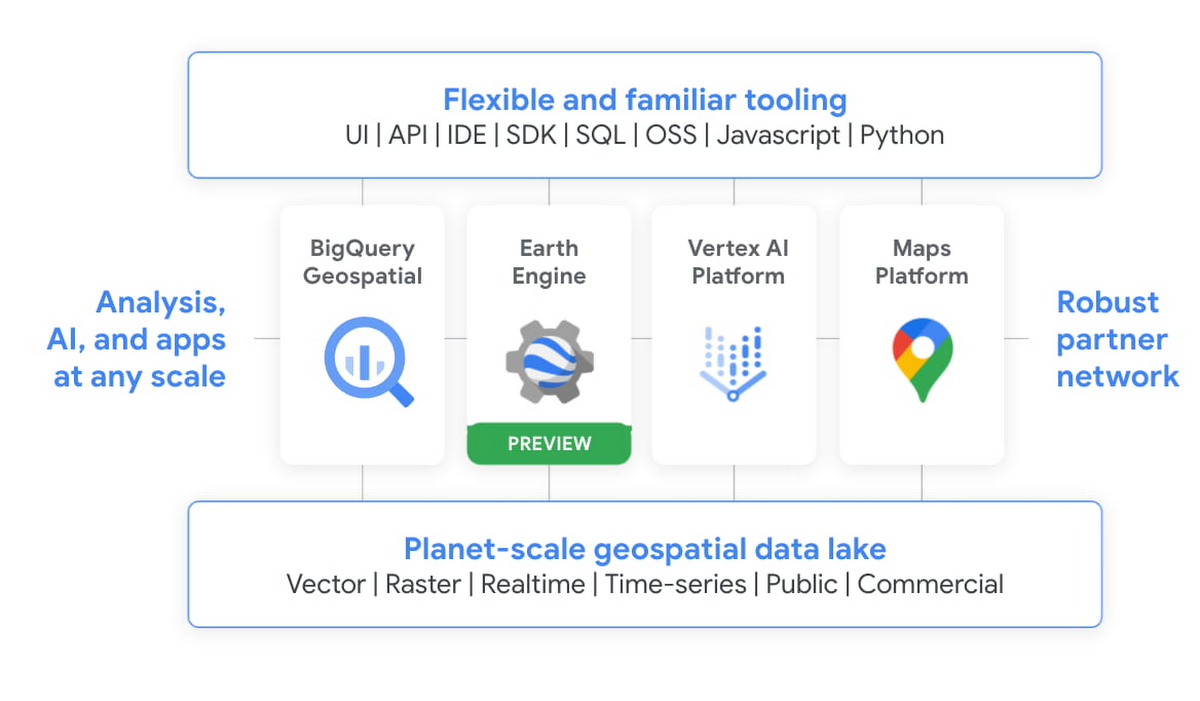
We’re integrating the best of Google and Google Cloud together to – again – make it easier to work with data to create a sustainable future for our planet.
BigQuery as a Data Exchange & Sharing Platform
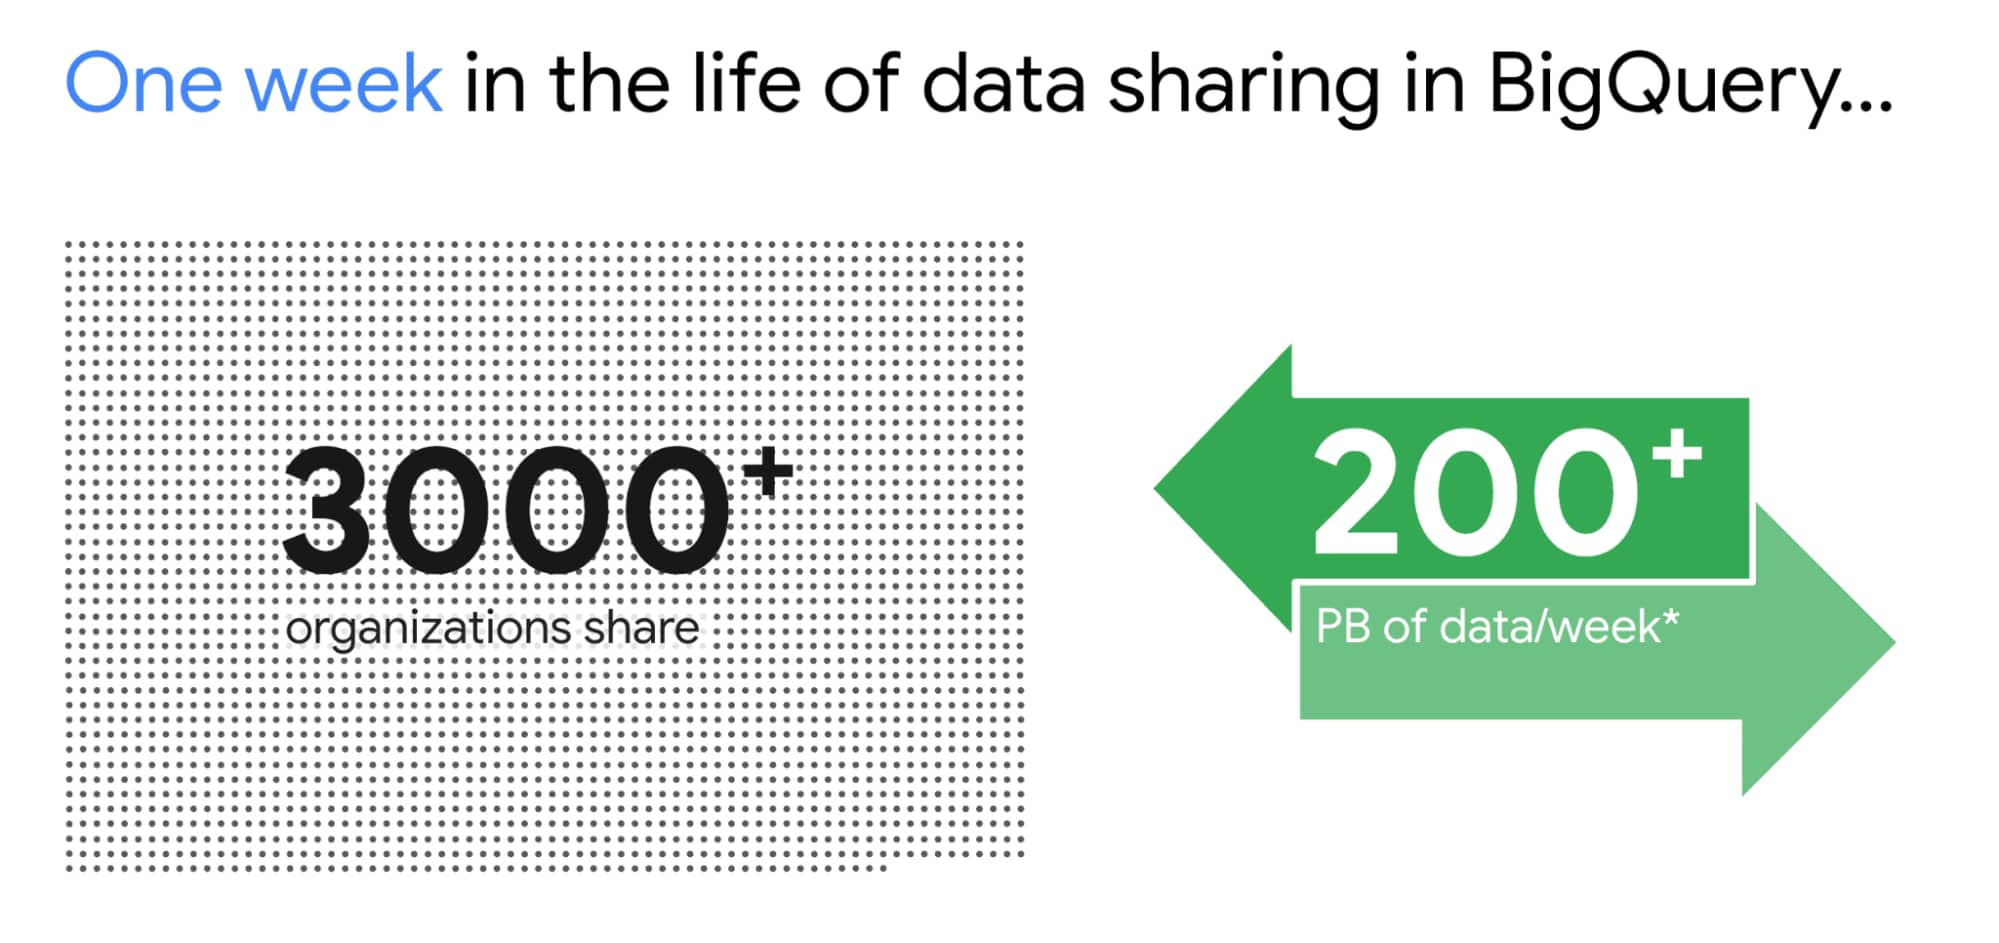
BigQuery was built to be a sharing platform. Today we have 3000+ organizations sharing more than 250 petabytes of data across organizations. Google also brings more than 150 public datasets to be used across various use cases. In addition to this, we are also bringing some of the most unique datasets like Google Trends to BigQuery. This will enable organizations to understand in real-time trends and apply to their business problems.
I am super excited about the Analytics Hub Preview announcement. Analytics Hub will provide the ability for organizations to build private and public analytics exchanges. This will include data, insights, ML Models and visualizations. This is built on top of the industry leading security capabilities of BigQuery.

Breaking Data Silos
Data is distributed across various systems in the organization and making it easy to break the data silo and make all this data accessible to all is critical. I’m also particularly excited about the Migration Factory we’re building with Informatica and the work we are doing for data movement, intelligent data wrangling with players like Trifacta and FiveTran, with whom we share over 1,000 customers (and growing!). Additionally we continue to deliver native Google service to help our customers.
We acquired Cask in 2018 and launched our self service Data Integration service in Data Fusion. Now Fusion allows customers to create complex pipelines with just simple drag and drop. This year we focused on unlocking SAP data for our customers. We have launched various SAP connectors and accelerators to achieve this.
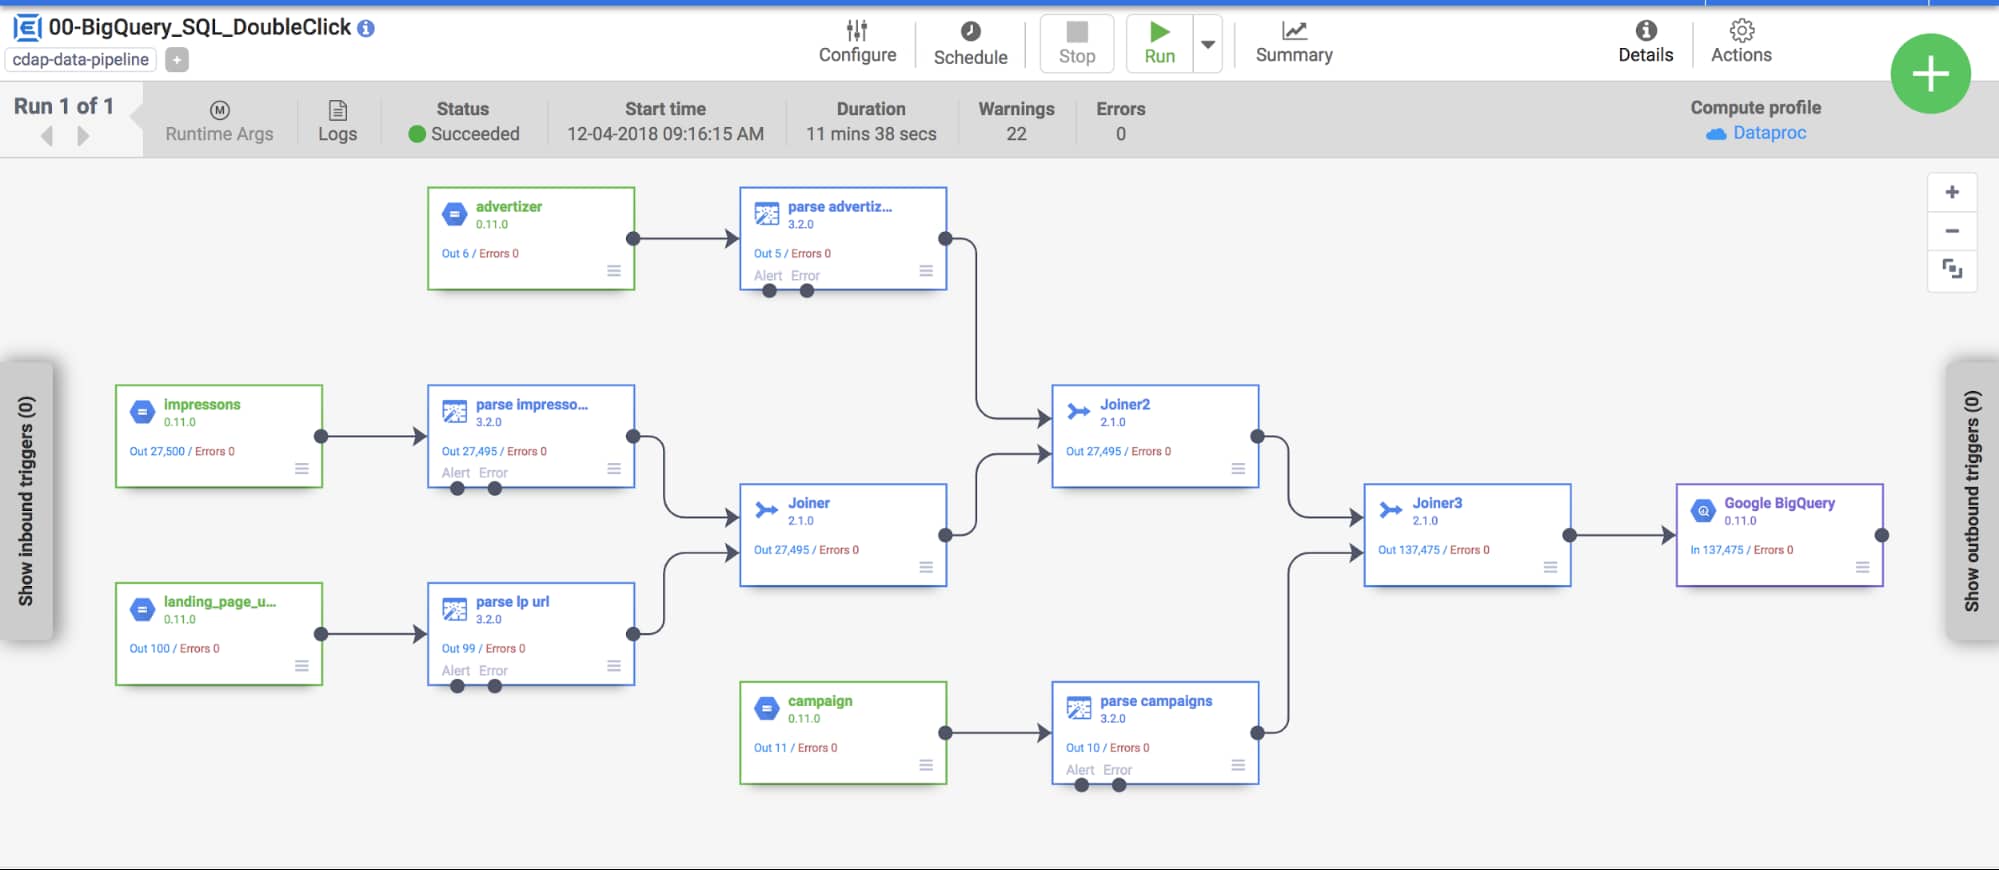
At GCP Next we also announced our BigQuery Migration service in preview. Many of our customers are migrating their legacy data warehouses and data lakes to BigQuery. BigQuery Migration Service provides end-to-end tools to simplify migrations for these customers.
And today, to make migrations to BigQuery easier for even more customers, I am super excited to announce the acquisition of CompilerWorks. CompilerWorks’ Transpiler is designed from the ground up to facilitate SQL migration in the real world and will help our customers accelerate their migrations. It supports migrations from over 10 legacy enterprises data warehouses and we will be making it available as part of our BigQuery Migration service in the coming months.
Data Democratization with BigQuery
Over the past 4 years we have focused a lot on making it very easy to derive actionable insights from data in BigQuery. Our priority has been to provide a strong ecosystem of partners that can provide you with great tools to achieve this but also deliver native Google capabilities.
With our BI engine GA announcement which we introduced in 2019, previewed earlier this year and showcased with tools like Microsoft PowerBI and Tableau, is now available for all to play with.

BigQuery + Data Studio are like peanut butter and Jelly. They just work well together. We launched BI Engine first with Data Studio and scaled it to all the users. More than 40% of our BigQuery customers use Data Studio. Once we knew BI Engine works extremely well we now have made it an integral part of BigQuery API and launched it for all our internal and partner BI tools.
We announced GA for BI Engine at Next 2021 but we were already GA with Data Studio for the past 2 years. We recently moved the Data Studio team back into Google Cloud making the partnership even stronger. If you have not used Data Studio, I encourage you to take a look and get started for free today here!!
Connected Sheets for BigQuery is one of my favorite combinations. You can give every business user in your organization the ability to analyze billions of records using standard Google Sheets experience. I personally use it everyday to analyze all our product data.
We acquired Looker in Feb 2020 with a vision of providing a semantic modeling layer to our customers with a governed BI solution. Looker is tightly integrated with BigQuery including BigQuery ML. Our latest partnership with Tableau where Tableau customers will soon be able to leverage Looker’s semantic model, enabling new levels of data governance while democratizing access to data.
Finally, I have a dream that one day we will bring Google Assistant to your enterprise data. This is the vision of Data QnA. We are in early innings on this and we will continue to work hard to make this vision a reality.
Intelligent Data Fabric to unify the platform
Another important trend that shaped our market is the Data Mesh. Earlier this year, Starburst invited me to talk about this very topic. We have been working for years on this concept, and although we would love for all data to be neatly organized in one place, we know that our customers’ reality is that it is not (If you want to know more about this, read about my debate on this topic with Fivetran’s George Fraser, a16z’s Martin Casado and Databricks’ Ali Ghodsi).
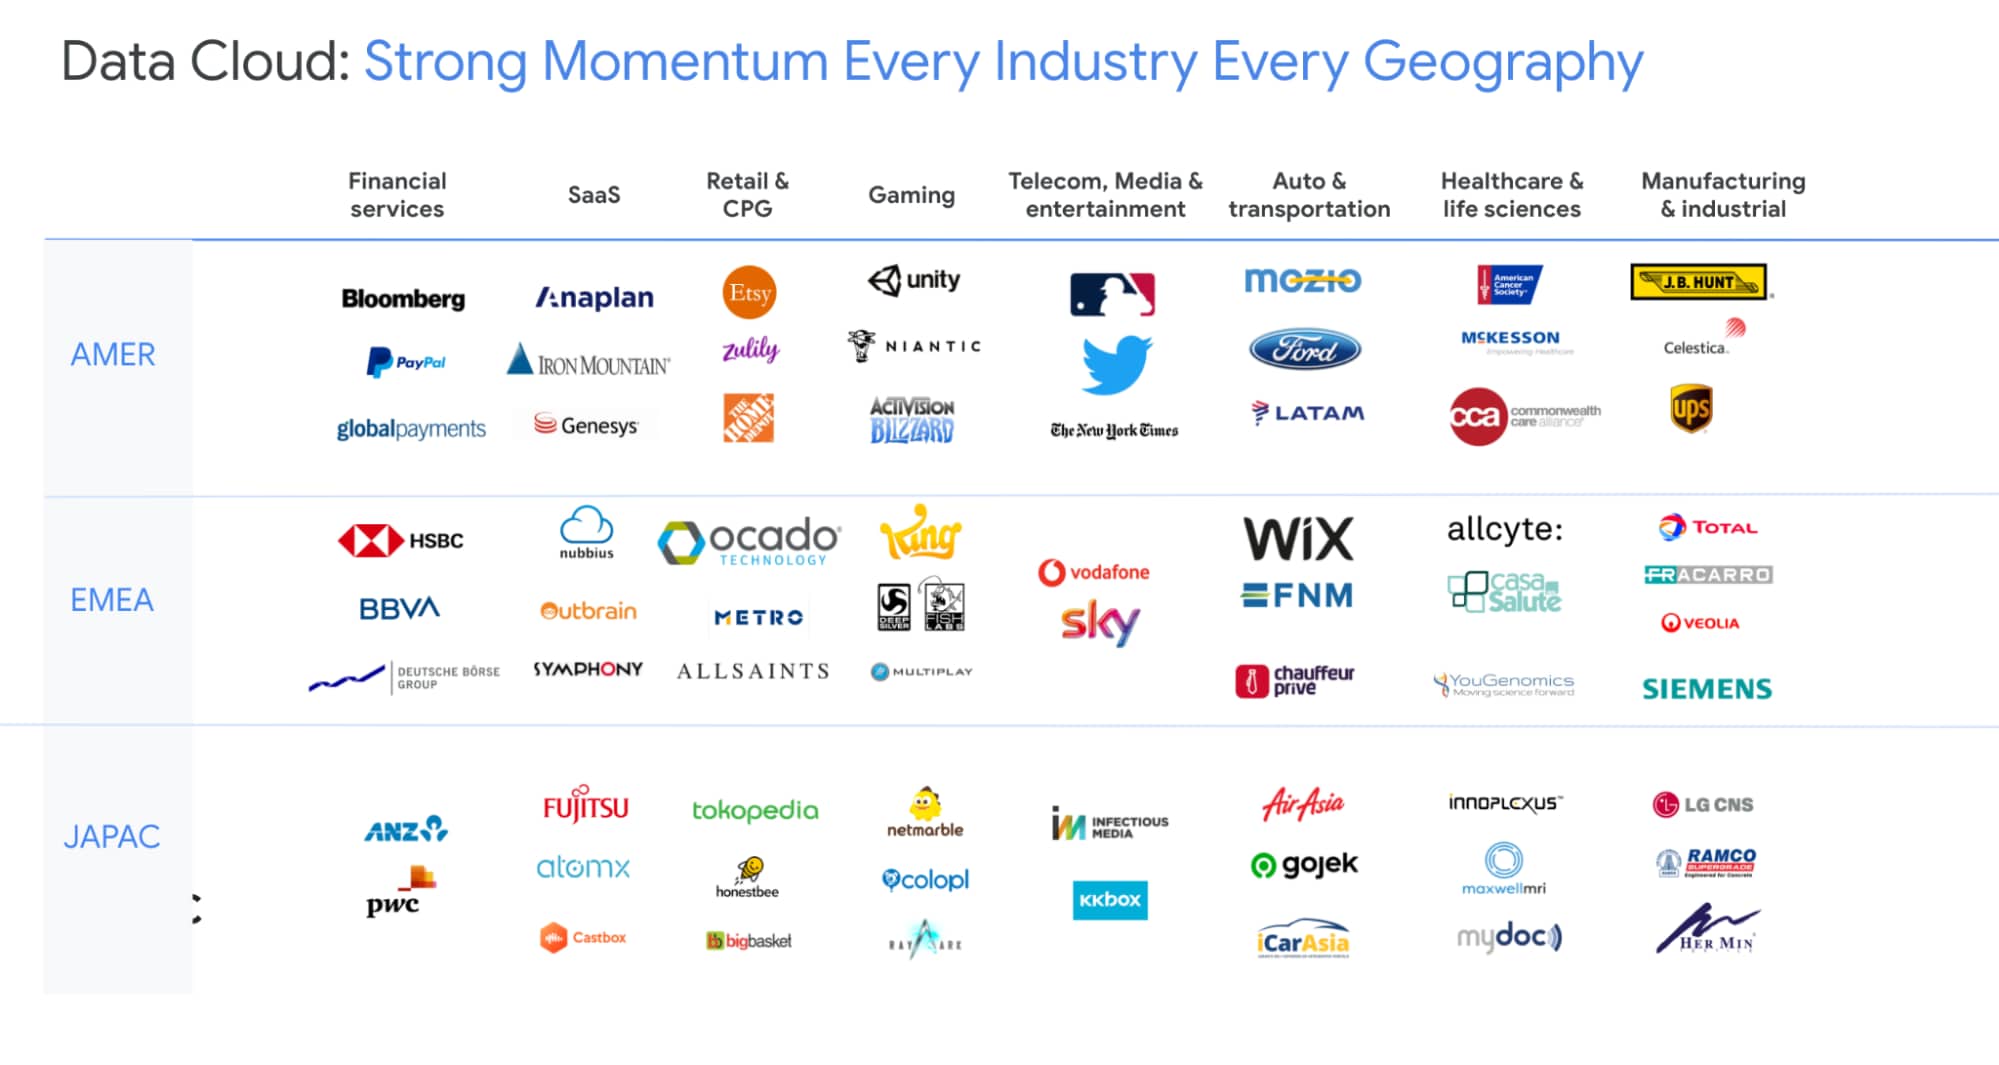
Everything I’ve learned from customers over my years in this field is that they don’t just need a data catalog or a set of data quality and governance tools, they need an intelligent data fabric. That is why we created Dataplex, whose general availability we announced at Next.
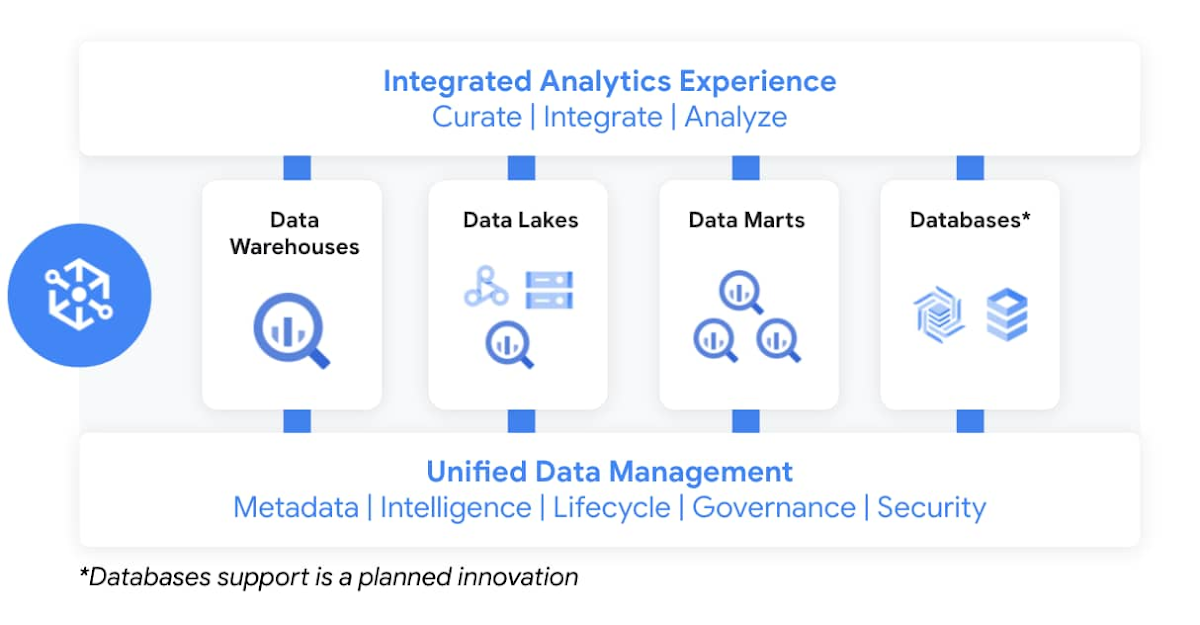
Dataplex enables customers to centrally manage, monitor, and govern data across data lakes, data warehouses, and data marts, while also ensuring data is securely accessible to a variety of analytics and data science tools. It lets customers organize and manage data in a way that makes sense for their business, without data movement or duplication. It provides logical constructs – lakes, data zones, and assets – which enable customers to abstract away the underlying storage systems to build a foundation for setting policies around data access, security, lifecycle management, and so on. Check out Prajakta Damle’s session and learn from Deutsche Bank how they are thinking about a unified data mesh across distributed data.
Closing Thoughts
Analysts have recognized our momentum and, as I look back at this year, I couldn’t thank our customers and partners enough for the support they provided my team and I across our large Data Analytics portfolio: in March, Google BigQuery was named a Leader in The Forrester Wave™: Cloud Data Warehouse, Q1 2021. And in June, Dataflow was named a Leader in The Forrester Wave™: Streaming Analytics, Q2 2021 report.
If you want to get a taste for why customers choose us over other hyperscalers or cloud data warehousing, I suggest you watch the Data Journey series we’ve just launched, which documents the stories of organizations modernizing to the cloud with us.
The Google Cloud Data Analytics portfolio has become a leading force in the industry and I couldn’t be more excited to have been part of it. I do miss you, my customers and partners, and I’m frankly bummed that we didn’t get to meet in person like we’ve done so many times before (see a photo of my last in-person talk before the pandemic), but this Google Next was extra special, so let’s dive into the product innovation and their themes.
I hope that I will get to see you in person next time we run Google Next!
Boost Database Performance with AlloyDB Index Advisor: The Ultimate Optimization Tool

1385
Of your peers have already read this article.
4:00 Minutes
The most insightful time you'll spend today!
Intro
One of the time consuming tasks for DBAs is to maximize query performance. To optimize slow-running queries, they often have to do detailed analysis, understand optimizer plans, and go through a lot of trial and error before getting to the best set of indexes that help with improved query performance. However, even with expert knowledge of a database’s internals, it is challenging to choose an effective set of indexes, especially when workloads change over time. The complexity of queries including several joins, filters, and subqueries make the process of identifying the right set of indexes very challenging for DBAs. Also, the effect of an index on the query plan needs to be taken into account when considering further indexes. Creating an index may cause the query optimizer to select completely different join orders and join/scan methods. This effect is hard to predict and quantify for DBAs.
Imagine if the database itself is intelligent enough to identify such queries, and recommends creating specific B-tree indexes?
Google Cloud’s AlloyDB for PostgreSQL is a fully-managed and fully PostgreSQL-compatible database for demanding transactional and analytical workloads that provides enterprise-grade performance and availability. AlloyDB offers Index Advisor, a built-in feature that helps alleviate the guesswork of tuning query performance with deep analysis of the different parts of a query including subqueries, joins, and filters. It periodically analyzes the database workload, identifies queries that can benefit from indexes, and recommends new indexes that can increase query performance.
How the AlloyDB Index Advisor works
First, let’s review a few AlloyDB terms relevant to the Index Advisor’s work.
- PostgreSQL’s system catalog has schema metadata, such as information about tables and columns, and internal bookkeeping information.
- HypoPG is an open source PostgreSQL extension that helps with hypothetical indexes without actually creating them to see if the index helps with query execution.
- Query Optimizer generates optimal execution plan.
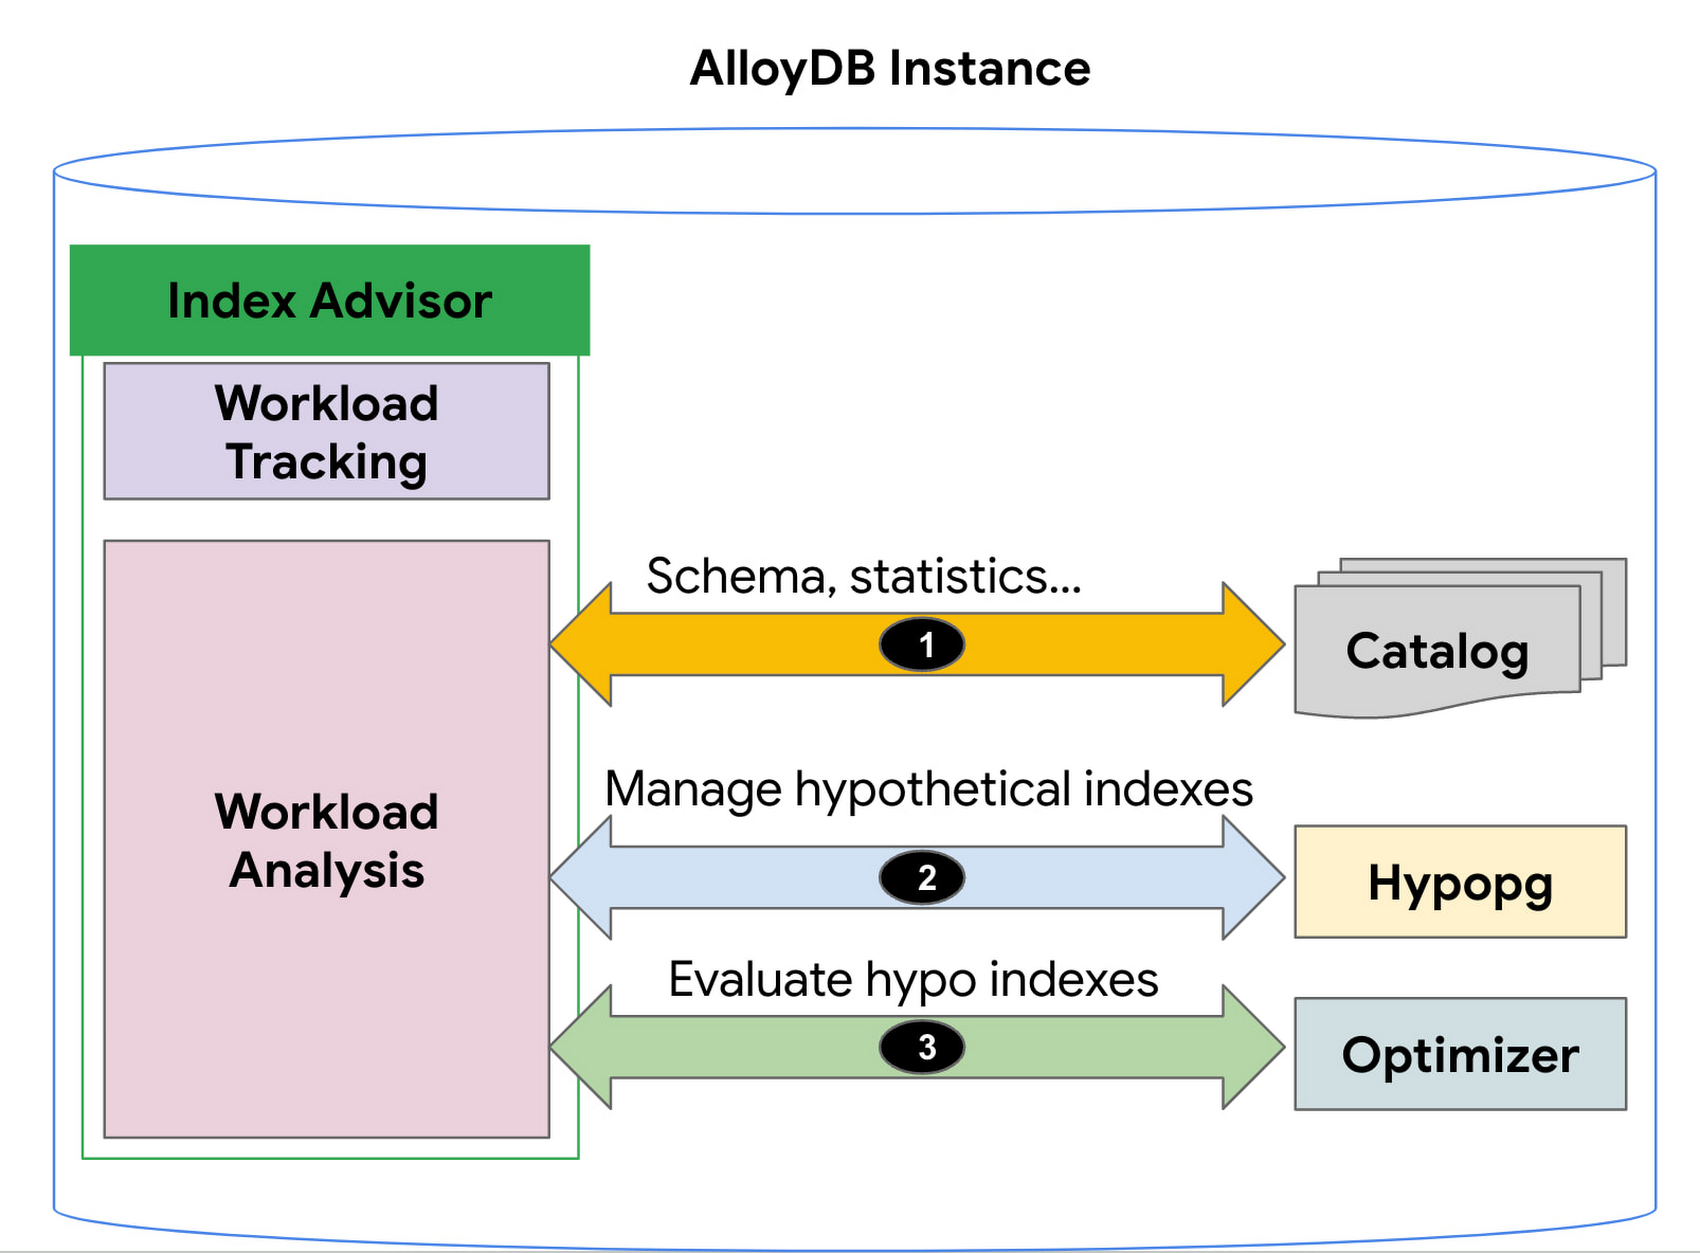
1. AlloyDB’s Index Advisor tracks the user query workload and analyzes it using statistics from the system catalog; it then identifies queries that could be improved significantly and potential candidate indexes for those cases. Note that there could be a large number of candidate indexes.
2. The Index Advisor evaluates each of these queries using hypothetical indexes based on the HypoPG, an open source extension and AlloyDB’s Query Optimizer.
3. The results of this evaluation are used to intelligently select the best set of indexes for the workload and to generate recommendations.
You can then simply copy and run the suggested index creation SQL commands. The Index Advisor consumes minimal resources and analyzes queries at a frequency that you define. It can also be constrained to have a user-specified maximum storage budget for the new indexes it recommends.
How to use the Index Advisor
1. Index Advisor is enabled by default. Its recommendation engine analyzes your workload at the specified frequency (every 24 hours by default) to capture any potential new index recommendations.
2. Run your queries that are representative of your workload to the instance. Index advisor tracks these queries automatically.
3. To request an index recommendation immediately, you can use the google_db_advisor_recommend_indexes() function. This function performs on-demand analysis and recommends indexes for the top 100 queries. SELECT * FROM google_db_advisor_recommend_indexes();
4. To view the recommended indexes and the queries based on periodic analysis, use the following query (also see the Usage Example section). SELECT DISTINCT recommended_indexes, queryFROM google_db_advisor_workload_report r JOIN google_db_advisor_workload_statements sON r.query_id = s.query_id;
Note that Index advisor analyzes queries issued by the connected user. For the user with the pg_read_all_stats role, it analyzes all tracked queries.
Currently, Index advisor only recommends new indexes. In future, the Index Advisor could be used to report unused indexes as well; dropping these can reduce index maintenance overhead for your transactional workload.
Evaluation
We will discuss two cases in this section.
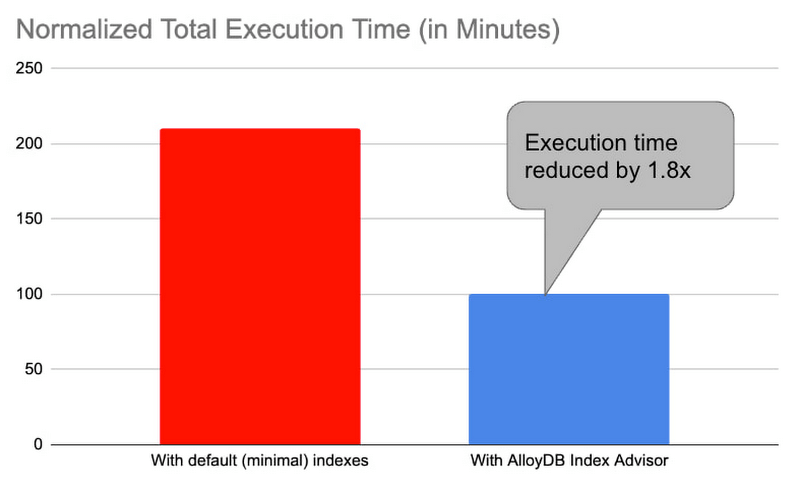
1. Decision support benchmark: We used a sample internal benchmark that modeled a decision support system. The benchmark dataset contained 450+ columns across 24 tables. The result quantified the performance of 100+ complex analytical queries. The benchmark initially had a minimal number of indexes and the normalized total query execution time was around 200+ minutes. We then enabled the AlloyDB Index Advisor and it recommended an additional 17 indexes. Creating those indexes and re-running the queries reduced the total execution time by half to ~100 minutes (1.8x).
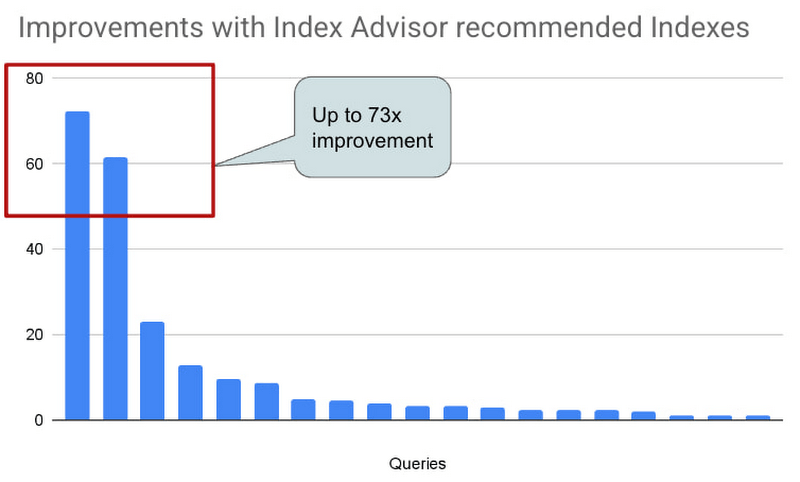
2. Real-world AlloyDB customer workload: This is a real-world workload from a large financial customer. They have a portfolio of complex analytical queries and business insights demand fast response times. Before using Index Advisor, DBAs had already created a few indexes that they considered to be useful to speed up these queries. Many of their queries joined 30+ tables, had 10+ filters and multiple subqueries. Those made it complex for DBAs to correctly identify the most beneficial indexes to create. AlloyDB Index Advisor analyzed these complex structures and identified four additional indexes. By adding the suggested indexes, performance of 17 queries were up by 5x – 73x. The response time of these queries dropped from seconds to milliseconds.
Usage Example
An example: We use the following example to demonstrate the use of Index Advisor. The example simulates a retail application performing analytics on its orders table.
1. Create a sample orders table.
CREATE TABLE orders (
    o_orderkey bigint NOT NULL,
    o_custkey int NOT NULL,
    o_orderstatus "char" NOT NULL,
    o_totalprice numeric(13,2) NOT NULL,
    o_orderdate date NOT NULL,
    o_orderpriority character varying(15) NOT NULL,
    o_clerk character varying(15) NOT NULL,
    o_shippriority int NOT NULL,
    o_comment character varying(79) NOT NULL
);
2. Insert 100K random orders into the table.
INSERT INTO orders
SELECT col, col, substr(md5(random()::text), 1, 1), random(), date '2023-01-01' + col * interval '1 hour', substr(md5(random()::text), 1, 1), concat('clerk', col), col%10, concat('comment', col)
 FROM generate_series(1,1000000) g(col);
3. Analyze the table to populate statistics.
ANALYZE orders;4. Run a query that counts the number of orders in the second week of Jan. You can run the query with timing on so that you can see how long it takes to run the query before and after the index is created.
\timing
SELECT COUNT(*) FROM ORDERS WHERE o_orderdate >= '2023-01-09' and o_orderdate <= '2023-01-15';

Time: 42.196 ms
5. Manually request an index recommendation.
SELECT * FROM google_db_advisor_recommend_indexes();
                      index                       | estimated_storage_size_in_mb
--------------------------------------------------+------------------------------
 CREATE INDEX ON "public"."orders"("o_orderdate") |                           25
(1 row)
6. View recommended indexes for tracked queries.
SELECT DISTINCT recommended_indexes, query
FROM google_db_advisor_workload_report r, google_db_advisor_workload_statements s
WHERE r.query_id = s.query_id AND recommended_indexes != '';
               recommended_indexes                |                                             query
--------------------------------------------------+------------------------------------------------------------------------------------------------
 CREATE INDEX ON "public"."orders"("o_orderdate") | SELECT COUNT(*) FROM ORDERS WHERE o_orderdate >= '2023-01-09' and o_orderdate <= '2023-01-15';
(1 row)
6. View recommended indexes for tracked queries.
SELECT DISTINCT recommended_indexes, query
FROM google_db_advisor_workload_report r, google_db_advisor_workload_statements s
WHERE r.query_id = s.query_id AND recommended_indexes != ”;
recommended_indexes | query
————————————————–+————————————————————————————————
CREATE INDEX ON “public”.”orders”(“o_orderdate”) | SELECT COUNT(*) FROM ORDERS WHERE o_orderdate >= ‘2023-01-09’ and o_orderdate <= ‘2023-01-15’;
(1 row)
7. Add the recommended index.
CREATE INDEX ON "public"."orders"("o_orderdate");8. Re-run the query.
\timing
SELECT COUNT(*) FROM ORDERS WHERE o_orderdate >= '2023-01-09' and o_orderdate <= '2023-01-15';

Time: 1.403 ms  (compared to 42.196ms before the index)
Learn more
- To learn more about AlloyDB’s Index Advisor, see Enable and use the index advisor | AlloyDB for PostgreSQL | Google Cloud
- To learn about AlloyDB, read AlloyDB for PostgreSQL intelligent scalable storage | Google Cloud Blog
- Start building on Google Cloud with $300 in free credits and 20+ always free products. https://cloud.google.com/free
How Arvind Fashions Ltd leads the fashion industry with powerful data analytics on BigQuery

4128
Of your peers have already read this article.
3:30 Minutes
The most insightful time you'll spend today!
Arvind Ltd has been in the apparel industry for more than 90 years, with its retail powerhouse Arvind Fashions Ltd being the backbone of well-known names in the retail fashion industry in India.
Arvind Fashions Ltd (Arvind) has seen significant growth in its portfolio with new franchises being added every year. The six high conviction brands include Tommy Hilfiger, Calvin Klein, Sephora, Arrow, U.S. Polo Assn. & Flying Machine.
To secure a foundation for future growth, the company has embarked on a digital transformation (DX) journey, focusing on profitability and improving the customer experience. The key objectives for Arvind’s DX is to unlock the value of existing applications, gain new insights, and build a solid workflow with resilient systems.
Getting Google Cloud to address the challenges around insights & analytics was a natural step forward, since Arvind had already formed a relationship with Google Cloud, starting with its productivity and collaboration tools during the pandemic.
Key Challenges
Arvind’s enterprise applications estate is a mix of SAP, Oracle POS, logistics management systems and other applications. Having so many different applications made it a challenge for the company to bring all of this data together to drive retail insights and at the same time maintain the freshness of its products.
As a case in point, the existing sales reporting and inventory reconciliation process had been enabled by a mix of automated and semi-automated desktop applications. There were challenges to scale the infrastructure in order to process large amounts of data at a low latency.
The synchronization of master data across functions was critical to build the data platform that provides consistent insights to multiple stakeholders across the organization.
Solution Approach – Modern Data Platform
There are several ways to solve the challenges above and do more by building a modern data analytics platform. For example, using a data lake based approach that builds use case by use case, hybrid data estates and so on. Regardless of the approach, it is important to define the solution based on certain principles.
In Arvind’s scenario, the key business principles considered are that data platforms should support Variety, Variability, Velocity and Volume. Each of these 4 V’s are critical business pivots to successful fashion retailing. Variety in SKU’s to deal with myriad fashion trends every season, Variability in shopping footfalls due to different festivities, weekends and special occasions, Velocity to be agile and responsive to customer needs, and Volumes of data that bring richer insights.
This is where Google BigQuery enabled data platform comes in, as it is able to meet the needs above.
Solution Architecture – Current Capabilities & Future Vision
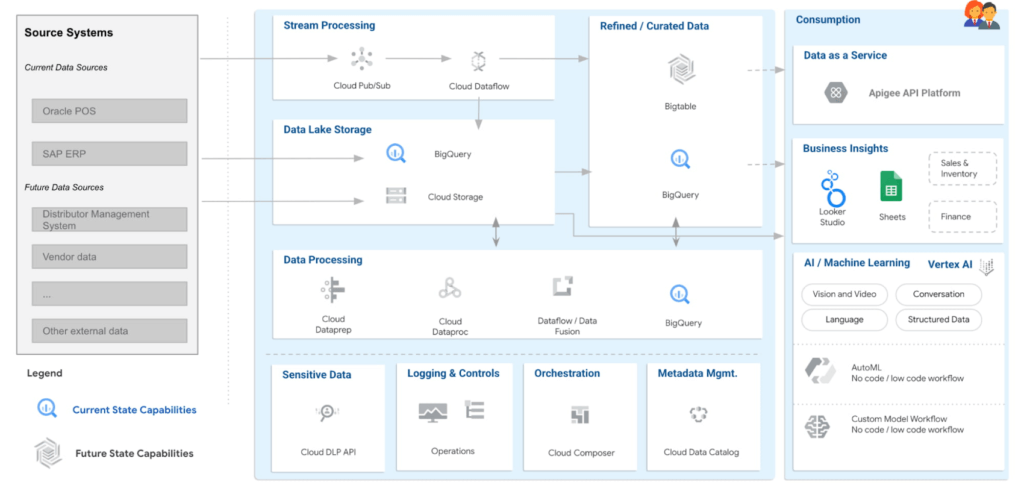
BigQuery is the mothership of the data and analytics platform on Google Cloud. Its serverless construct ensures that data engineering teams focus only on insights & analytics. Storage and compute is decoupled and can be independently scaled. BigQuery has been leveraged to service both the raw as well as the curated data zones.
With BigQuery procedures, it is possible to process the data natively within the data warehouse itself. Procedures have been leveraged to process the data in a low latency manner with the familiar SQL.
But then what happens to advanced analytics and insights? With simplicity being our key guiding principle, BigQuery machine learning ensures that data analysts can create, train and deploy analytics models even with complex requirements. It can also consume data from Looker Studio, which is seamlessly integrated with BigQuery.
Here are the key principles and highlights of the data platform that have been achieved:
- Simple, yet exhaustive – We needed a solution with vast technical capabilities such as data lake & data warehouse, data processing, data consumption, analytics amongst others. And at the same time it needed to be simple to implement and run ongoing operations.
- Agility – High quality analytics use cases typically require a significant amount of time, effort and skill set. While building a simple solution we ensured that the selection of technology services ensured agility in the long term.
- Security – An organization can be truly successful if the insights and analytics operations are democratized. But while data is made available to a wider community, we need to ensure data governance and security.
- Ease of operations – Data engineering teams spend a lot of time doing infrastructure setting and management operations. With BigQuery, teams can put in more effort on building the data pipelines and models to feed into analytics instead of worrying about the infrastructure operations.
- Costs – Decoupling storage and compute allows for flexible pricing. A pay-as-you-go model is the ideal solution to managing costs.
Business Impact
The ingestion frequency of the store level inventory (~800 stores) has now been changed to daily. With the additional data volumes and processing the scaling on BigQuery has been seamless. There are new processes and dashboards to address the reconciliation and root cause analysis. Operational efficiencies have improved leading to better productivity and turn around time of critical processes.
The discrepancies in various reconciliation activities have drastically reduced by an order of magnitude of 300X due to the capabilities offered by the data platform. Not only is it possible to identify discrepancies but the data platform has also enabled in identifying the root causes for the same as well.
Arvind Fashions Ltd have also been able to enhance some of the existing business processes and systems with insight from the data platform.
It’s going to be an exciting journey for Arvind Fashions Ltd and Google Cloud. There are several initiatives ready for kick off such as getting more apps on the edge devices, warehouse analytics, advanced customer data platforms, predicting the lifecycle of designs, style codes and other exciting initiatives.
4962
Of your peers have already watched this video.
49:30 Minutes
The most insightful time you'll spend today!
How to Migrate an Oracle Database to Google Cloud
As more enterprises migrate a growing number of workloads to the cloud, migrating databases, too, has become a key focus.
But migrating databases is also really tough. This is due to a number of different reasons.
The first one is that there’s a lot of proprietary technology and functionality that’s built into a lot of the legacy database technologies.
With Oracle, for example, that may be things like stored procedure, custom functions, Oracle RAC, so on and so forth.
This makes it really hard for database administrators to migrate to an equivalent cloud-native technology.
The second challenge is that historical on-prem databases are all quite monolithic.
These are humongous servers which don’t really fit into the cloud way of doing things.
So often, database administrators have to split these up into multiple servers in the cloud.
The third challenge, which a lot of companies underestimate, is the reliance of applications on databases.
Say, you are a company that’s been around for 10 to 15 years. As the business has grown, it’s added tens to hundreds of apps, both internal- and external-facing, that are all relying on the database.
So as you’re thinking about migration, it’s really important to consider the risks that are associated of migrating to different cloud technologies. Obviously, you would like to minimize your company’s exposure.
With that background, here are the steps, procedures, best practices, and how to solve the challenges associated with migrating on-premises Oracle databases to Google Cloud SQL PostgreSQL.
From source database migration assessment to schema conversion, data replication, and performance tuning, we will cover all of the basics required to get you started with your first Oracle to Cloud SQL migration project.
More Relevant Stories for Your Company

Google Migration and BigQuery Brings PedidosYa Closer towards its Goal of Becoming Data-driven
Editor’s note: PedidosYa is the market leader for online food ordering in Latin America, serving 15 markets and over 400 cities. It’s also one of the largest brands within the German multinational company Delivery Hero SE. With over 20 million app downloads, PedidosYa provides the best online delivery experience through

Data Cloud Skills to Pick Up in 2022: Google Experts Recommended
It’s 2022 and nanosatellites, NFTs, and autonomous cars that deliver your pizza are in full force. In a world where people rely on simple technology to untangle complex problems, companies must deliver simple experiences to be successful in today’s landscape. For many cloud providers this means enabling tightly integrated data

Making Mothers’ Day Special: How Google Cloud Migration for 1-800-FLOWERS.COM, Inc Impacts CX
Editor’s note: In honor of Mother’s Day, we look at how 1-800-FLOWERS.COM, Inc. migrated to Google Cloud as part of its digital transformation to quickly deploy seamless and convenient customer experiences across multiple brands on Mother’s Day and every day. As a leading provider of gifts designed to help customers

The Right Datawarehouse Helps Fight Climate Change, While Improving Customer Experience
When you think about climate change, you might not consider a daily commute to work or a drive around town as big contributing factors. And yet, transport is the fastest growing source of CO2 emissions from fossil fuel, which in turn is the largest contributor to climate change. This is the key insight
