





How Data Efficiency with Google Cloud Empower Governments to Make Data-first Decisions

5068
Of your peers have already read this article.
1:30 Minutes
The most insightful time you'll spend today!
Presently, every government agency has to take a hard look at their data capabilities and decide whether their current infrastructure supports their workflow. For many, it doesn’t. Most data systems are developed with a strict set of parameters in mind before implementation, which can limit flexibility and long-term use. Particularly during a crisis, flexible “living systems” offer tremendous advantages as they’re able to change capacity rapidly. Building living data systems with the cloud in mind allows organizations to respond to a changing world with confidence.
Last summer, the Government Business Council conducted a survey of government employees to understand the impacts of data efficiency on government operations. The report Built to Last: A Survey on Organizational Data Efficiency in Times of Crisis offers key insights into organizational efficacy and whether organizations can adapt to a crisis at speed. It also highlights differences between traditional data systems and living data systems.
Data needs to be readily available
When the pandemic first hit, many agencies needed to create or transition their systems to allow employees to work remotely. This change tested the limits of existing data systems. Even after finding a cloud service provider, agencies encountered the challenges of migrating their data to the cloud.
Government organizations had decades of data stored in paper records. Most have been working to transfer these records to a digital format, but the process has been slow. They are also faced with collecting sizable amounts of data in real time from their ongoing services, which involves interfacing with the public, external vendors, or third-party institutions.
Building the cloud into a flexible data system can solve both issues. Old records can be digitized and given an easy-to-access home for those who need them. Incoming data, both internal and external, can be made accessible as well. Migrating data to the cloud also doubles as a way to create backups of raw data, adding an extra layer of security. Most importantly, building in the cloud unlocked the capacity to scale when demand rises.
Data should be updated in real-time
One of the key takeaways from the Government Business Council report is the fact that agencies are better able to adapt at speed when data efficiencies are higher. 74% of organizations with pandemic related functions reported a moderate to severe impact to their jobs at the onset of the pandemic. Of those organizations, the ones reporting their data efficiency as “very good” have largely already recovered. That adaptability directly affects an agency’s ability to make informed decisions during a time of a crisis.
Having a real-time data solution in place lets agencies make near real-time decisions. A great example of this from early in the pandemic is vaccine distribution. Google Cloud supported multiple states, such as the State of Wyoming, in distributing vaccines efficiently while handling challenges such as reaching rural populations. Data systems that gathered real-time patient data made a difference in the number of vaccines distributed. Knowing population data and patient risk factors enabled quick and effective decision-making.
A global pandemic is far from the only crisis that needs effective data analytics. Natural disasters, food deserts, public health issues, and more can all be handled more efficiently by having real-time data at hand. Effective data analytics systems are the digital equal of “having your ear to the ground” in each community. They provide valuable insights into what people need.
Data needs to be accessible and easy to use
Making data easy to work with and understand sets phenomenal data systems apart from functional ones. Having data in the cloud is a great first step, but agencies need to be able to easily access and quickly use the data to accomplish their goals. This is where traditional data systems fail most often. Traditional IT systems and data strategies are designed for a specific purpose, usually identified before development and implementation begin. That means that when the data living in those systems needs to be used differently, adapting to new requirements can be difficult.
Data can often feel “locked” in traditional systems; the data is there, but there’s no way to get to it or work with it in a way that meets the needs of a crisis. Flexible data systems address this by allowing for greater accessibility. Google Cloud, for example, has customizable tools, such as Contact Center AI and Document AI, which let agencies work with data in ever-changing ways. This also produces greater data transparency since data sets can be worked with and accessed more easily.
Governments need to respond to the changing needs of their constituents in emergencies. While traditional data systems can handle slowly shifting demands on the system, they do not serve agencies well in a crisis. When urgency, accuracy, and accessibility all matter, flexible systems rise to the challenge. The pandemic has pushed agencies to adapt in real time, and many have realized they need a system that adapts with them.
Google Cloud has a suite of tools to create integrated data ecosystems. These ecosystems can scale with increasing demand, meet dynamic development needs, and adapt to a changing landscape. Data-first decision-making is a core tenet of “living data systems.” Google Cloud data systems have handled everything from administering vaccines to detecting fraud. In each of these applications, a core tenet of data-first decision making was implemented at scale.
For more insights on how flexible data systems help the public sector, download the full report “Built to Last: A Survey on Organizational Data Efficiency in Times of Crisis.”
What’s Google Cloud Firestore Database and What are it’s Benefits for Business and Developers?

5977
Of your peers have already read this article.
2:30 Minutes
The most insightful time you'll spend today!
Cloud Firestore is a NoSQL document database that simplifies storing, syncing, and querying data for your mobile and web apps at global scale.
Cloud Firestore is a fast, fully managed, serverless, cloud-native NoSQL document database that simplifies storing, syncing, and querying data for your mobile, web, and IoT apps at global scale.
Its client libraries provide live synchronization and offline support, while its security features and integrations with Firebase and Google Cloud Platform (GCP) accelerate building truly serverless apps.
Here’s other stuff it’s good at:
Sync data across devices, on or offline
With Cloud Firestore, your applications can be updated in near real time when data on the back end changes. This is not only great for building collaborative multi-user mobile applications, but also means you can keep your data in sync with individual users who might want to use your app from multiple devices.
With Firebase Realtime Database, we felt we had built the best force-plate testing software on the market. Thanks to Cloud Firestore, in only two weeks, we built a system that’s significantly better and includes features we never thought possible to ship on Day 1.
Chris Wales, CTO, Hawkin Dynamics
Cloud Firestore has full offline support, so you can access and make changes to your data, and those changes will be synced to the cloud when the client comes back online. Built-in offline support leverages local cache to serve and store data, so your app remains responsive regardless of network latency or internet connectivity.
Simple and effortless
Cloud Firestore’s robust client libraries make it easy for you to update and receive new data while worrying less about establishing network connections or unforeseen race conditions. It can scale effortlessly as your app grows. Cloud Firestore allows you to run sophisticated queries against your data. This gives you more flexibility in the way you structure your data and can often mean that you have to do less filtering on the client, which keeps your network calls and data usage more efficient.
Enterprise-grade, scalable NoSQL
Cloud Firestore is a fast and fully managed NoSQL cloud database. It is built to scale and takes advantage of GCP’s powerful infrastructure, with automatic horizontal scaling in and out, in response to your application’s load. Security access controls for data are built in and enable you to handle data validation via a configuration language.
A Breakdown of Cloud-based Data Ingestion Practices

8836
Of your peers have already read this article.
3:00 Minutes
The most insightful time you'll spend today!
Businesses around the globe are realizing the benefits of replacing legacy data silos with cloud-based enterprise data warehouses, including easier collaboration across business units and access to insights within their data that were previously unseen. However, bringing data from numerous disparate data sources into a single data warehouse requires you to develop pipelines that ingest data from these various sources into your enterprise data warehouse. Historically, this has meant that data engineering teams across the organization procure and implement various tools to do so. But this adds significant complexity to managing and maintaining all these pipelines and makes it much harder to effectively scale these efforts across the organization. Developing enterprise-grade, cloud-native pipelines to bring data into your data warehouse can alleviate many of these challenges. But, if done incorrectly, these pipelines can present new challenges that your teams will have to spend their time and energy addressing.
Developing cloud-based data ingestion pipelines that replicate data from various sources into your cloud data warehouse can be a massive undertaking that requires significant investment of staffing resources. Such a large project can seem overwhelming and it can be difficult to identify where to begin planning such a project. We have defined the following principles for data pipeline planning to begin the process. These principles are intended to help you answer key business questions about your effort and begin to build data pipelines that address your business and technical needs. Each section below details a principle of data pipelines and certain factors your teams should consider as they begin developing their pipelines.
Principle 1: Clarify your objectives
The first principle to consider for pipeline development is clarify your objectives. This can be broadly defined as taking a holistic approach to pipeline development that encompasses requirements from several perspectives: technical teams, regulatory or policy requirements, desired outcomes, business goals, key timelines, available teams and their skill sets, and downstream data users. Clarifying your objectives clearly identifies and defines requirements from each key stakeholder at the beginning of the process and continually checks development against these requirements to ensure the pipelines built will meet these requirements.This is done by first clearly defining the desired end state for each project in a way that addresses a demonstrated business need of downstream data users. Remember that data pipelines are almost always the means to accomplish your end state, rather than the end state itself. An example of an effectively defined end-state is “enabling teams to gain a better understanding of our customers by providing access to our CRM data within our cloud data warehouse” rather than “move data from our CRM to our cloud data warehouse”. This may seem like a merely semantic difference, but framing the problem in terms of business needs helps your teams make technical decisions that will best meet these needs.
After clearly defining the business problem you are trying to solve, you should facilitate requirement gathering from each stakeholder and use these requirements to guide the technical development and implementation of your ingestion pipelines. We recommend gathering stakeholders from each team, including downstream data users, prior to development to gather requirements for the technical implementation of the data pipeline. These will include critical timelines, uptime requirements, data update frequency, data transformation, DevOps needs, and security, policy, or regulatory requirements by which a data pipeline must meet.
Principle 2: Build your team
The second principle to consider for pipeline development is build your team. This means ensuring you have the right people with the right skills available in the right places to develop, deploy, and maintain your data pipelines. After you have gathered your pipeline requirements, you can begin to develop a summary architecture that will be used to build and deploy your data pipelines. This will help you identify the human talent you will need to successfully build, deploy, and manage these data pipelines and identify any potential shortfalls that would require additional support from either third-party partners or new team members.
Not only do you need to ensure you have the right people and skill sets available in aggregate, but these individuals need to be effectively structured to empower them to maximize their abilities. This means developing team structures that are optimized for each team’s responsibilities and their ability to support adjacent teams as needed.
This also means developing processes that prevent blockers to technical development whenever possible, such as ensuring that teams have all of the appropriate permissions they need to move data from the original source to your cloud data warehouse without violating the concept of least privilege. Developers need access to the original data source (depending on your requirements and architecture) in addition to the destination data warehouse. Examples of this are ensuring that developers have access to develop and/or connect to a Salesforce Connected App or read access to specific Search Ads 360 data fields.
Principle 3: Minimize time to value
The third principle to consider for pipeline development is minimize time to value. This means considering the long-term maintenance burden of a data pipeline prior to developing and deploying it in addition to being able to deploy a minimum viable pipeline as quickly as possible. Generally speaking, we recommend the following approach to building data pipelines to minimize their maintenance burden: Write as little code as possible. Functionally, this can be implemented by:
1. Leveraging interface-based data ingestion products whenever possible. These products minimize the amount of code that requires ongoing maintenance and empower users who aren’t software developers to build data pipelines. They can also reduce development time for data pipelines, allowing them to be deployed and updated more quickly.
- Products like Google Data Transfer Service and Fivetran allow for managed data ingestion pipelines by any user to centralize data from SaaS applications, databases, file systems, and other tooling. With little to no code required, these managed services enable you to connect your data warehouse to your sources quickly and easily.
- For workloads managed by ETL developers and data engineers, tools like Google Cloud’s Data Fusion provide an easy-to-use visual interface for designing, managing and monitoring advanced pipelines with complex transformations.
2. Whenever interface-based products or data connectors are insufficient, use pre-existing code templates. Examples of this include templates available for Dataflow that allow users to define variables and run pipelines for common data ingestion use cases, and the Public Datasets pipeline architecture that our Datasets team uses for onboarding.
3. If neither of these options are sufficient, utilize managed services to deploy code for your pipelines. Managed services, such as Dataflow or Dataproc, eliminate the operational overhead of managing pipeline configuration by automatically scaling pipeline instances within predefined parameters.
Principle 4: Increase data trust and transparency
The fourth principle to consider for pipeline development is increase data trust and transparency. For the purposes of this document, we define this as the process of overseeing and managing data pipelines across all tools. Numerous data ingestion pipelines that each leverage different tools or are not developed under a coordinated management plan can result in “tech sprawl”, which significantly increases the management overhead of data ingestion pipelines as the quantity of data pipelines increases. This becomes especially cumbersome if you are subject to service-level agreements, or legal, regulatory, or policy requirements for overseeing data pipelines. Preventing tech sprawl is, by far, the best strategy for dealing with it by developing streamlined pipeline management processes that automate reporting. Although this can theoretically be achieved by building all of your data pipelines using a single cloud-based product, we do not recommend doing so because it prevents you from taking advantage of features and cost optimizations that come with choosing the best product for your use case.
A monitoring service such as Google Cloud Monitoring Service or Splunk that automates metrics, events, and metadata collection from various products, including those hosted in on-premise and hybrid computing environments, can help you centralize reporting and monitoring of your data pipelines. A metadata management tool such as Google Cloud’s Data Catalog or Informatica’s Enterprise Data Catalog can help you better communicate the nuances of your data so users better understand which data resources are best fit for a given use case. This significantly reduces your pipeline’s governance burden by eliminating manual reporting processes that often result in inaccuracies or lagging updates.
Principle 5: Manage costs
The fifth principle to consider for pipeline development is manage costs. This encompasses both the cost of cloud resources and the staffing costs necessary to design, develop, deploy, and maintain your cloud resources. We believe that your goal should not necessarily be to minimize cost, but rather maximizing the value of your investment. This means maximizing the impact of every dollar spent by minimizing waste in cloud resource utilization and human time. There are several factors to consider when it comes to managing costs:
- Use the right tool for the job – Different data ingestion pipelines will have different requirements for latency, uptime, transformations, etc. Similarly, different data pipeline tools have different strengths and weaknesses. Choosing the right tool for each data pipeline can help your pipelines operate significantly more efficiently. This can reduce your overall cost, free up staffing time to focus on the most impactful projects, and make your pipelines much more efficient.
- Standardize resource labeling – Implement and utilize a consistent labeling schema across all tools and platforms to have the most comprehensive view of your organization’s spending. One example is requiring all resources to be labeled by the cost center or team at time of creation. Consistent labeling allows you to monitor your spend across different teams and calculate the overall value of your cloud spending.
- Implement cost controls – If available, leverage cost controls to prevent errors that result in unexpectedly large bills.
- Capture cloud spend – Capture your spend on all cloud resource utilization for internal analysis using a cloud data warehouse and a data visualization tool. Without it, you won’t understand the context of changes in cloud spend and how they correlate with changes in business.
- Make cost management everyone’s job – Managing costs should be part of the responsibilities of everyone who can create or utilize cloud resources. To do this well, we recommend making cloud spend reporting more transparent internally and/or implementing chargebacks to internal cost centers based on utilization.
Long-term, the increased granularity in cost reporting available within Google Cloud can help you better measure your key performance indicators. You can shift from cost-based reporting (i.e. – “We spent $X on BigQuery storage last month”) to value-based reporting (i.e. – “It costs $X to serve customers who bring in $Y revenue”).
To learn more about managing costs, check out Google Cloud’s “Understanding the principles of cost optimization” white paper.
Principle 6: Leverage continually improving services
The sixth principle is leverage continually improving services. Cloud services are consistently improving their performance and stability, even if some of these improvements are not obvious to users. These improvements can help your pipelines run faster, cheaper, and more consistently over time. You can take advantage of the benefits of these improvements by:
- Automating both your pipelines and pipeline management: Not only should data pipelines be automated, but almost all aspects of managing your pipelines can also be automated. This includes pipeline/data lineage tracking, monitoring, cost management, scheduling, access management and more. This helps reduce long-term operational costs of each data pipeline that can significantly alter your value proposition and prevent any manual configurations from negating the benefits of later product improvements.
- Minimizing pipeline complexity whenever possible: While ingestion pipelines are relatively easy to develop using UI-based or managed services, they also require continued maintenance as long as they are in use. The most easily maintained data ingestion pipelines are typically the ones that minimize complexity and leverage automatic optimization capabilities. Any transformation in a data ingestion pipeline is a manual optimization of the pipeline that may struggle to adapt or scale as the underlying services improve. You can minimize the need for such transformations by building ELT (extract, load, transform) pipelines rather than ETL (extract, transform, load) pipelines. This pushes transformations down to the data warehouse that is use a specifically optimized query engine to transform your data rather than manually configured pipelines.
Next steps
If you’re looking for more information about developing your cloud-based data platform, check out our Build a modern, unified analytics data platform whitepaper. You can also visit our data integration site to learn more and find ways to get started with your data integration journey.
Once you’re ready to begin building your data ingestion pipelines, learn more about how Cloud Data Fusion and Fivetran can help you make sure your pipelines address these principles.
UKG Ready: Meeting the Needs of Complex Machine Learning Models and Distributed Data Sets

3982
Of your peers have already read this article.
2:30 Minutes
The most insightful time you'll spend today!
Business Problem
UKG Ready primarily operates in the Small and Medium Business (SMB) space, so inherently many customers are forced to operate and make key business decisions with less Workforce Management (WFM) / Human Capital Management (HCM) data. In addition to volume, SMB lacks the variety of data needed to create a dynamic and agile organization. This puts SMB at a major disadvantage compared to larger segments.
Project Goals
People Insights module is committed to surfacing insights to customers in the context of their day-to-day duties and aid in decision making. With the SMB customer data limitations mentioned above, the goal of this project was to create a global dataset that augments individual customer data to bring light to less obvious, yet important information.
Challenges
UKG Ready is a highly configurable application that gives customers the opportunity to build solutions on a platform that meets their specific business needs. High configurability gives high flexibility to customers in their usage of the software. However, it becomes nearly impossible to create a global dataset for machine learning and data insights. UKG Ready manages just under 4 million of the US workforce and some 30,000+ customers. Despite the large employee dataset size, machine learning models that are specific to customers are starved for data because the individual customers have a relatively small employee population. Does that mean we cannot support our SMB customers’ decision making with ML?
Result
Partnering with Google, we were able to develop an approach that allowed us to standardize various domain entities (pay categories, time off codes, job titles, etc.) so that we could build a global dataset to augment SMB customer data. Using machine learning we were able to build a common vocabulary across our customer base. This common vocabulary encapsulates the nuances of how our customers manage their business and yet is generalized and standardized such that the data can be aggregated over the variety of customer configurations. This allows us to serve up practical insights to customers through various use cases. Our partnership allowed us to leverage Google Cloud Services to meet the needs of our complex machine learning models, distributed data sets and CI/CD processes.
How
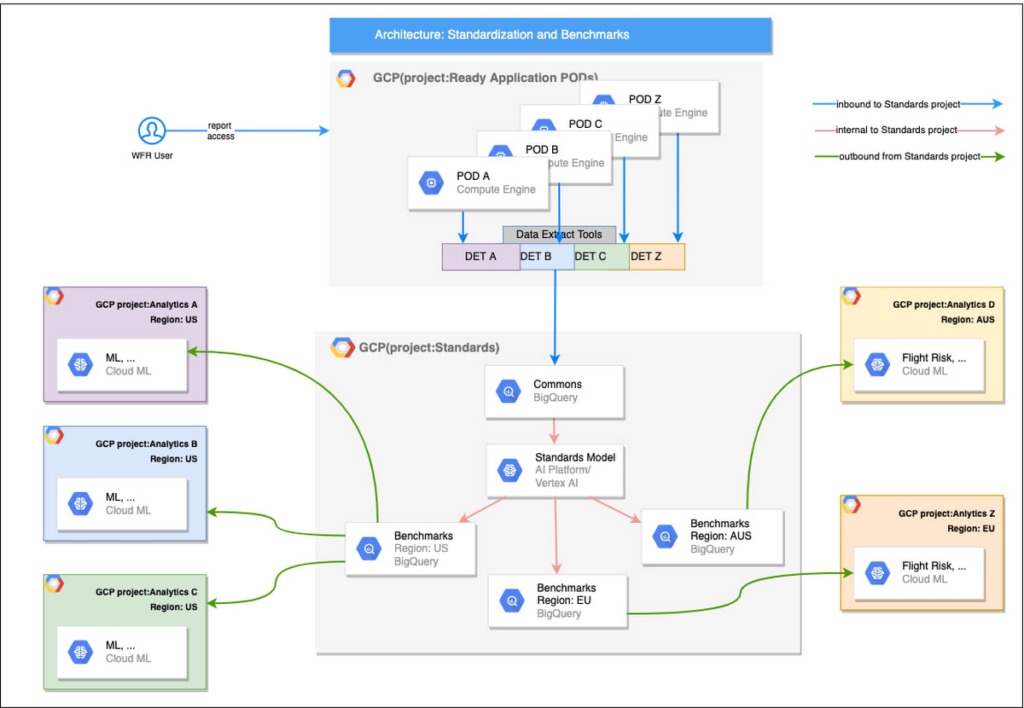
UKG Ready decided to partner with Google for an end-to-end solution for the analytics offering. This allowed us to focus on our core business logic without having to worry about the platform, environment configurations, performance and scalability of the entire solution. We make use of various Google Cloud services such as Cloud Triggers, Cloud Storage, Cloud Functions, Cloud Composer, Cloud Dataflow, Big Query, Vertex AI, Cloud Pub/Sub… to host our analytics solution. Jenkins manages the entire CI/CD pipelines and cloud environments are configured and deployed using Terraform.
The standardization of business entities problem was solved in three distinct steps:
Step 1: Collecting aggregated data
We needed an approach to collect aggregated data from our highly distributed, sharded, multi-tenant data sources. We developed a custom solution that allows us to extract data aggregated at source for PII and GDPR considerations and transfer to Google Cloud Storage in the fastest manner possible. Data is then transformed and stored in Big Query. Services used: GCS, Cloud Functions, DataFlow, Cloud Composer and Big Query. All processes are orchestrated using Cloud Composer and detailed logging is available in Cloud Logging (Stackdriver).
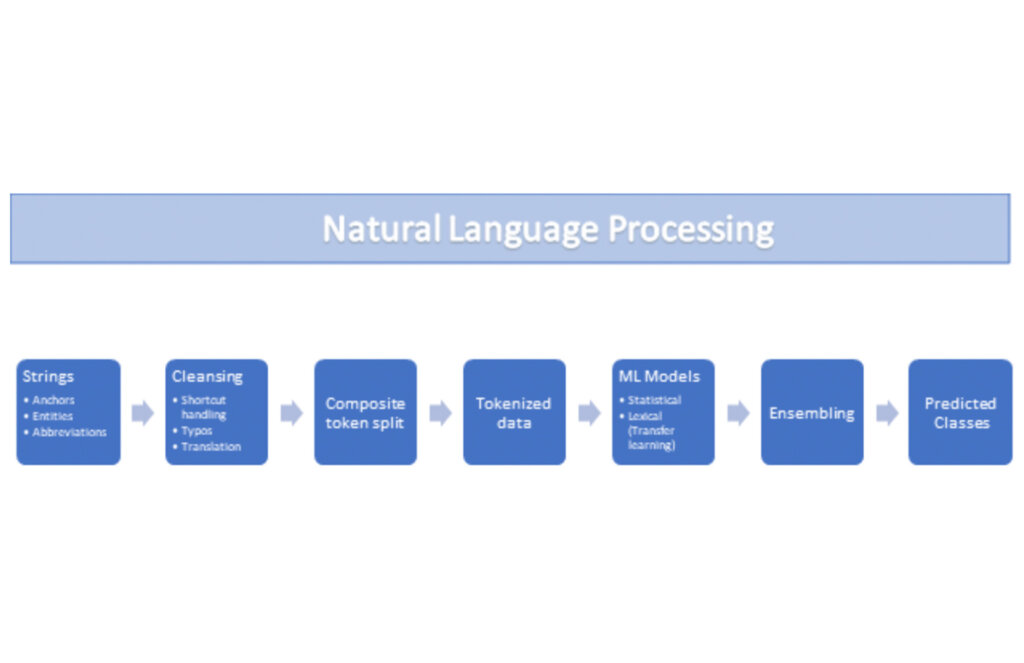
Step 2: Applying NLP (Natural Language Processing)
Once we had the variety of customer configurations or the business entities available, we then applied NLP algorithms to categorize and standardize these in buckets. This approach assumes that customers use natural language for configurations like job titles, pay codes etc.
String Preparation
The input data for string preparation process is an entity string or several strings, that describe one entity object (like name-description pair or code-name pair). The output represents set of tokens that may be used to run a classification/clustering model. The process of string preparation tokenizes strings, replaces shortcuts, handles abbreviations, translates tokens, handles grammatical errors and mistypes
ML Models
Statistical
The idea of the model is to use defined target classes (clusters) and assign several tokens (anchors) to each of them an entity that has any of those tokens would be “attracted” to appropriate class. All other tokens are weighted according to frequencies of usage of theses tokens in the entities with anchor tokens:
Using anchor tokens, we are building kind-of Word2Vec - dimensionality of vector is equal to number of target classes. The higher the specific dimension (cluster) value, the higher the probability of entity to be included in appropriate cluster. Final prediction for entity tokens list for specific class is sum of weights of all the tokens included. Predicted cluster is a cluster that has maximal prediction score.
Lexical Model
We managed to generate reasonable amount of labeled data during statistical model implementation and testing. That opens a possibility to build “classical” NLP model that uses labeled data to train classification neural network using pretrained layers to produce token embeddings or even string embeddings. We started experimentation with pre-trained models like GloVe and got good results with single words and bi-grams but started getting issues in handling of n-grams. Our Google account team came to our rescue and recommended some white papers that helped formulate our strategy. We now use Tensorflow nnlm-en-dim128 model to produce string embeddings – it was trained on 200B records English Google News corpus and produces for each input string 128-dimensional vector. After that we use several Dense and Dropout layers to build a classification model.
Ensembling
To perform ensembling all the model results for each class are cast to probabilities using softmax transformation with scale normalization. Final predicted probability is maximal average score of both models among all the classes scores – appropriate class is predicted class.
The machine learning models are deployed on Vertex AI and are used in batch predictions. Model performance is captured at every prediction boundary and monitored for quality in production.
Step 3: Making available common vocabulary
Having the standardized vocabulary, we then needed a mechanism to have the results be available in UKG Ready reports and customer specific models like Flight Risk and Fatigue. For this we again used Google Services for orchestration, data transformation and data storage.
Once the modeling is complete, we made the customer specific models leveraging the above architecture be available in Reports. We utilized our proven existing technology choices in GCP for orchestration, data transformation and data storage
Results
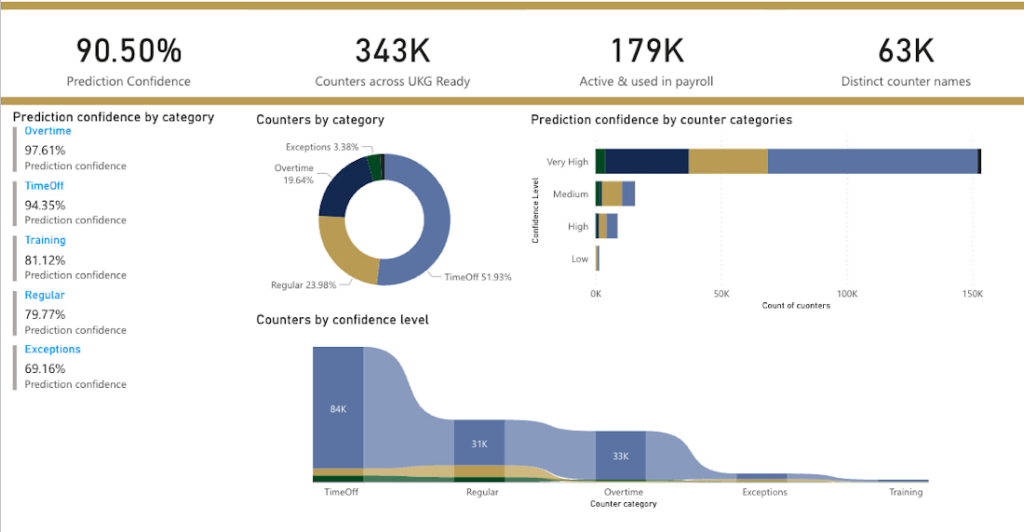
We are able to build a common vocabulary of our customers’ business entities with good confidence. And be an expert advisor to our SMB customers in their decision-making using machine learning. With the advice of our Google account team and using Google services we can add value to our product in a relatively short amount of time. And we are not done! We continue to use this platform for new use cases, complex business problems and innovative machine learning solutions.
Sample result:
Special thanks to Kanchana Patlolla , AI Specialist, Google for the collaboration in bringing this to light
Cloud IoT Core Helps Businesses Leverage their IoT Data to Build a Competitive Edge

7109
Of your peers have already read this article.
1:30 Minutes
The most insightful time you'll spend today!
The ability to gain real-time insights from IoT data can redefine competitiveness for businesses. Intelligence allows connected devices and assets to interact efficiently with applications and with human beings in an intuitive and non-disruptive way. After your IoT project is up and running, many devices will be producing lots of data. You need an efficient, scalable, affordable way to both manage those devices and handle all that information.
IoT Core is a fully managed service for managing IoT devices. It supports registration, authentication, and authorization inside the Google Cloud resource hierarchy as well as device metadata stored in the cloud, and the ability to send device configuration from other GCP or third-party services to devices.
Main components
The main components of Cloud IoT Core are the device manager and the protocol bridges:
- The device manager registers devices with the service, so you can then monitor and configure them. It provides:
- Device identity management
- Support for configuring, updating, and controlling individual devices
- Role-level access control
- Console and APIs for device deployment and monitoring
- Two protocol bridges (MQTT and HTTP) can be used by devices to connect to Google Cloud Platform for:
- Bi-directional messaging
- Automatic load balancing
- Global data access with Pub/Sub
How does Cloud IoT Core work?
Device telemetry data is forwarded to a Cloud Pub/Sub topic, which can then be used to trigger Cloud Functions as well as other third-party apps to consume the data. You can also perform streaming analysis with Dataflow or custom analysis with your own subscribers.
Cloud IoT Core supports direct device connections as well as gateway-based architectures. In both cases the real time state of the device and the operational data is ingested into Cloud IoT Core and the key and certificates at the edge are also managed by Cloud IoT Core. From Pub/Sub the raw input is fed into Dataflow for transformation, and the cleaned output is populated in Cloud Bigtable for real-time monitoring or BigQuery for warehousing and machine learning. From BigQuery the data can be used for visualization in Looker or Data Studio and it can be used in Vertex AI for creating machine learning models. The models created can be deployed at the edge using Edge Manager (in experimental phase). Device configuration updates or device commands can be triggered by Cloud Functions or Dataflow to Cloud IoT Core, which then updates the device.
Design principles of Cloud IoT Core
As a managed service to securely connect, manage, and ingest data from global device fleets, Cloud IoT COre is designed to be:
- Flexible, providing easy provisioning of device identities and enabling devices to access most of Google Cloud
- IThe industry leader in IoT scalability and performance
- Interoperable, with supports for the most common industry-standard IoT protocols
Use cases
IoT use cases range across numerous industries. Some typical examples include:
- Asset tracking, visual inspection, and quality control in retail, automotive, industrial, supply chain and logistics
- Remote monitoring and predictive maintenance in oil & gas, utilities, manufacturing, and transportation
- Connected homes and consumer technologies.
- Vision intelligence in retail, security, manufacturing, and industrial sectors
- Smart living in commercial, residential, and smart spaces
- Smart factories with predictive maintenance and real-time plant floor analytics
For a more in-depth look into Cloud IoT Core check out the documentation.
https://youtube.com/watch?v=76v16P-Wqe4%3Fenablejsapi%3D1%26
For more #GCPSketchnote, follow the GitHub repo. For similar cloud content follow me on Twitter @pvergadia and keep an eye out on thecloudgirl.dev.
Statsig’s Journey to Seamless Data Management with Google BigQuery

1204
Of your peers have already read this article.
3:30 Minutes
The most insightful time you'll spend today!
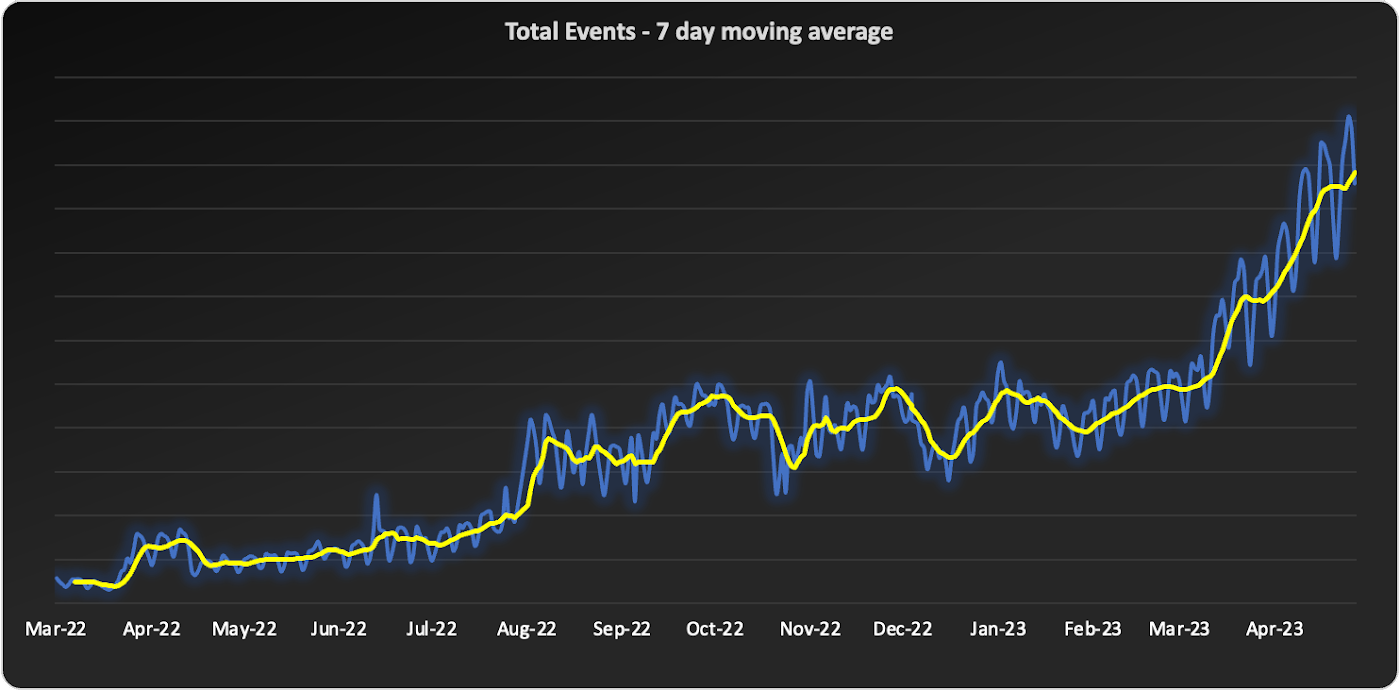
Statsig is a modern feature management and experimentation platform used by hundreds of organizations. Statsig’s end-to-end product analytics platform simplifies and accelerates experimentation with integrated feature gates (flags), custom metrics, real-time analytics tools, and more, enabling data-driven decision-making and confident feature releases. Companies send their real-time event-stream data to Statsig’s data platform, which, on average, adds up to over 30B events a day and has been growing at 30-40% month over month.
With these fast-growing event volumes, our Spark-based data processing regularly ran into performance issues, pipeline bottlenecks, and storage limits. In turn, this rapid data growth negatively impacted the team’s ability to deliver product insights on time. The sustained Spark tuning efforts that we were dealing with made it challenging to keep up with our feature backlog. Instead of spending time building new features for our customers, our engineering team was controlling significant increases in Spark’s runtime and cloud costs.
Adopting BigQuery pulled us out of Spark’s recurring spiral of re-architecture and into a Data Cloud, enabling us to focus on our customers and develop new features to help them run scalable experimentation programs.
The growing data dilemma
At Statsig, our processing volumes were growing rapidly. The assumptions and optimizations we madea month ago would become irrelevant the next month. While our team was knowledgeable in Spark performance tuning, the benefits of each change were short lived and became obsolete almost as quickly as it was implemented. As the months passed, our data teams were dedicating moretime to optimizing and tuning Spark clusters instead of building new data products and features. We knew we needed to change our data cloud strategy.
We started to source advice from companies and startups who had faced similar data scaling challenges – the resounding recommendation was “Go with BigQuery.” Initially, our team was reluctant. For us, a BigQuery migration would require an entirely new data warehouse and a cross-cloud migration to GCP.
However, during a company-wide hackathon, a pair of engineers decided to test BigQuery with our most resource-intensive job. Shockingly, this unoptimized job finished much faster and at a lower cost than our current finely-tuned setup. This outcome made it impossible for us to ignore a BigQuery migration any longer. We set out to learn more.
Investigating BigQuery
When we started our BigQuery journey, the first and obvious thing we had to understand was how to actually run jobs. With Spark, we were accustomed to daunting configurations, mapping concepts like executors back to virtual machines, and creating orchestration pipelines for all the tracking and variations required.
When we approached running jobs on BigQuery, we were surprised to learn that we only needed to configure the number of slots allocated to the project. Suddenly, with BigQuery, there were no longer hundreds of settings affecting query performance. Even before running our first migration test, BigQuery had already eliminated an expensive and tedious task list of optimizations our team would typically need to complete.
Digging into BigQuery, we learned about additional serverless optimizations that BigQuery offered out of the box that addressed many of the issues we had with Spark. For example, we often had a single task get stuck with Spark because virtual machines would be lost or the right VM shape needed to be attainable. With BigQuery’s autoscaling, SQL jobs are much more granularly defined and can move resources as needed between multiple jobs. As another example, we sometimes encountered a storage issue with Spark due to the shuffled data overwhelming a machine’s disk. On BigQuery, there is a separate in-memory shuffle service that eliminates the need for our team to worry about predicting and sizing shuffle disk sizes.
At this point, it was clear that the migration away from the DevOps of Spark and into the serverless BigQuery architecture would be worth the effort.
Spark to BigQuery migration
When migrating our pipelines over, we ran into situations where we had to rewrite large blocks of code, making it easy to introduce new bugs. We needed a way to simultaneously stage this migration without committing to huge rewrites . Dataproc is a very useful tool for this purpose. Dataproc provides us with a simple yet flexible API to spin up Spark clusters and gives us access to the full swath of configurations and optimizations that we’re accustomed to from our previous Spark deployments.
Additionally, BigQuery offers a direct Spark integration through stored procedures with Apache Spark, which provides a fully managed and serverless Spark experience native to BigQuery and allows you to call Spark code directly from BigQuery SQL. It can be configured as part of the BigQuery autoscaler and called from any orchestration tool that can execute SQL, such as dbt.
This ability to mix and match BigQuery SQL and multiple options for Spark gave us the flexibility to move to BigQuery immediately but roll out the entire migration on our timeline.
With BigQuery, we’re back to building features
With BigQuery, we could to tap into performance improvements, direct cost savings, and experienced a reduction in our data pipeline error rates. However, BigQuery really changed our business by unlocking new real-time features that we didn’t have before. A couple of examples are:
1. Fresh, fast data results
On our Spark cluster, we needed to pre-compute tens of thousands of possible results each day if a customer wanted to look at a specific detail. While only a small percentage of results would get viewed each day, we couldn’t predict which results would be needed, so we had to pre-compute it all. With BigQuery, the queries run much faster, so we now compute specific results when customers need them. We benefit from avoiding expensive jobs. To our customers, this translates into fresher data.
2. Real-time decision features
Since our migration to BigQuery began, we have rolled out several new features powered by BigQuery’s ability to compute things in near real-time, enhancing our customers’ ability to make real-time decisions.
1) A metrics explorer that lets our customers query their metric data in real-time.
2) A deep dive experience that lets our customers instantly dig into a specific user’s details instead of waiting on a 15-minute Spark job to process.
3) A warehouse-native solution that lets our customers use their own BigQuery project to run analysis.
Migrating from Spark to BigQuery has simplified many of our workflows and saved us significant money. But equally importantly, it has made it easier to work with massive data, reduced the strain on our perpetually stretched-thin data team, and allowed us to build awesome products faster for our customers.
Getting started with BigQuery
There are a few ways to get started with BigQuery. New customers get $300 in free credits to spend on BigQuery. All customers get 10GB storage and up to 1TB queries free per month, not charged against their credits. You can get these credits by signing up for the BigQuery free trial. Not ready yet? You can use the BigQuery sandbox without a credit card to see how it works.
The Built with BigQuery advantage for ISVs
Google is helping tech companies like Statsig build innovative applications on Google’s data cloud with simplified access to technology, helpful and dedicated engineering support, and joint go-to-market programs through the Built with BigQuery initiative.
More on Statsig
Companies want to understand the impact of their new features on the business, test different options, and identify optimal configurations that balance customer success with business impact. But running these experiments is hard. Simple mistakes can cause you to make wrong decisions, and lack of standardization can make results hard to compare, and reduce user trust. When implemented poorly, an experimentation program can become a bottleneck, causing feature releases to slow down or, in some cases, causing teams to skip experimentation altogether. Statsig provides an end-to-end product experimentation and analytics platform that makes it simple for companies to leverage best-in-class experimentation tooling.
If you’re looking to improve your company’s experimentation process, visit statsig.com and explore what our platform can offer. We have a generous free tier and a community of experts on Slack to help ensure your efforts are successful. Boost your business’s growth with Statsig and unlock the full potential of your data.
More Relevant Stories for Your Company

Wayfair Writes its Success Story with BigQuery for Internal Analytics
Editor’s note: Home-goods and furniture giant Wayfair first partnered up with Google Cloud to transform and scale its storefront—work that proved its value many times over during the unprecedented surge in ecommerce traffic during 2020. Today, we hear how BigQuery’s performance and cost optimization have transformed the company’s internal analytics

MerPay Platform Scales its Reach to Millions of Users using Cloud Spanner
Editor’s note: To launch a new mobile payment platform, Mercari needed a database solution strong on scalability, availability, and performance. Here’s how Cloud Spanner delivered those results. E-commerce companies need to connect customers to their services securely, reliably, with zero downtime. When Mercari, Inc. launched a new mobile payment platform, we chose Cloud

Why More DB Admins Love Google Cloud Spanner, Its Best Uses Cases—and What it Costs
Cloud Spanner is the first scalable, enterprise-grade, globally-distributed, and strongly consistent database service built for the cloud specifically to combine the benefits of relational database structure with non-relational horizontal scale. This combination delivers high-performance transactions and strong consistency across rows, regions, and continents with an industry-leading 99.999% availability SLA, no

Google Cloud’s Transfer Services Helps Move Nuro’s Petabytes of Data from Edge to the Cloud
Engineers that build last-mile delivery services belong to an elite order, a hallowed subcategory. Delivery customers are incredibly demanding when it comes to speed and convenience, and the services they use must take variables like increased traffic, road conditions, human error, and even driver availability into account every day. Nuro
