





Wayfair Writes its Success Story with BigQuery for Internal Analytics

4929
Of your peers have already read this article.
4:00 Minutes
The most insightful time you'll spend today!
Editor’s note: Home-goods and furniture giant Wayfair first partnered up with Google Cloud to transform and scale its storefront—work that proved its value many times over during the unprecedented surge in ecommerce traffic during 2020. Today, we hear how BigQuery’s performance and cost optimization have transformed the company’s internal analytics to create an environment of “yes”.
At Wayfair, we have several unique challenges relating to the scale of our product catalog, our global delivery network, and our position in a multi-sided marketplace that supports both our customers and suppliers. To give you a sense of our scale we have a team of more than 3,000 engineers with tens of millions of customers. We supply more than 20 Million items using more than 16,000 supplier partners.
Serving those constituents generates a lot of analytics work. Wayfair runs over a billion ‘analytic’ database queries a year, from both humans and systems, against multi-petabyte datasets. Scaling our previous environment to meet these challenges required us to maintain dozens of copies of data for different use cases and manage complex data synchronization routines to move trillions of records each day, resulting in long development times and high support costs for our analytics projects.
Centralizing our data using Cloud Storage and BigQuery enabled us to break down existing silos and build unified pipelines for our batch and real-time operations. BigQuery shines by letting us decouple our compute and storage resources and flexibly ingest structured data in streaming and batch modes. We also benefit from the same decoupling for more complicated machine learning (ML) workflows in Dataproc and Cloud Storage. In particular, BigQuery is extremely low maintenance. From ML and easy data integrations to the integrated query cache, many out-of-the-box features have proven valuable for multiple use cases.
Beyond storage and compute, Google Cloud offers multiple tools to maximize the value of our data. For example, we can easily connect Data Studio to BigQuery for lightning-fast dashboarding of enterprise KPI reporting. When we need to dive deeper into a metric, Looker provides an interface and semantic model that empowers more business users to answer important questions — without understanding SQL or our vast dataset and table structure.
The combination of all of Google Cloud’s tools enables every Wayfairian the opportunity to self-serve their data visualization and analysis needs. We are able to support all of the requirements of our internal and external users, from descriptive analytics to alerting and ML, in a platform that blends Google’s proprietary technology with open-source standards.we have seen a greater than 90% reduction in the number of analytic queries in production that take more than one minute to run
As a result, we have seen a greater than 90% reduction in the number of analytic queries in production that take more than one minute to run, which delights our users and increases adoption of our analytics tools across the business.
Higher performance means saying “Yes” more often
We went into the BigQuery experience expecting very strong performance on large, aggregate queries and excellent scalability — the kind of performance that could enable consistent 5-15 minute processing queries and 5-10 second response times for large analytics queries.
We weren’t disappointed — we saw slightly better than linear performance profiles as record counts went up from millions to trillions for a flat resource allocation. BigQuery had the expected high performance for aggregate queries. This made our large data processing pipelines predictable and straightforward to maintain and optimize.
Below is a plot of gigabytes processed by a query against query run time in seconds; outliers are filtered and the axes are pruned to ranges where we had a large sample size. This focuses on longer-duration queries. As an example of the linear performance, a 2 terabyte query averages 5 minutes — 2.5min/terabyte — and an 18 terabyte query (9 times as much data) averages 25s — only 1.4min/terabyte. This is despite the fact that complex queries [sorting and analytic functions are particularly problematic] are more common with large data sizes. We do see increasing variability at large sizes as slot limits and other resource constraints come into play, but these factors are controllable and ultimately a business optimization decision.
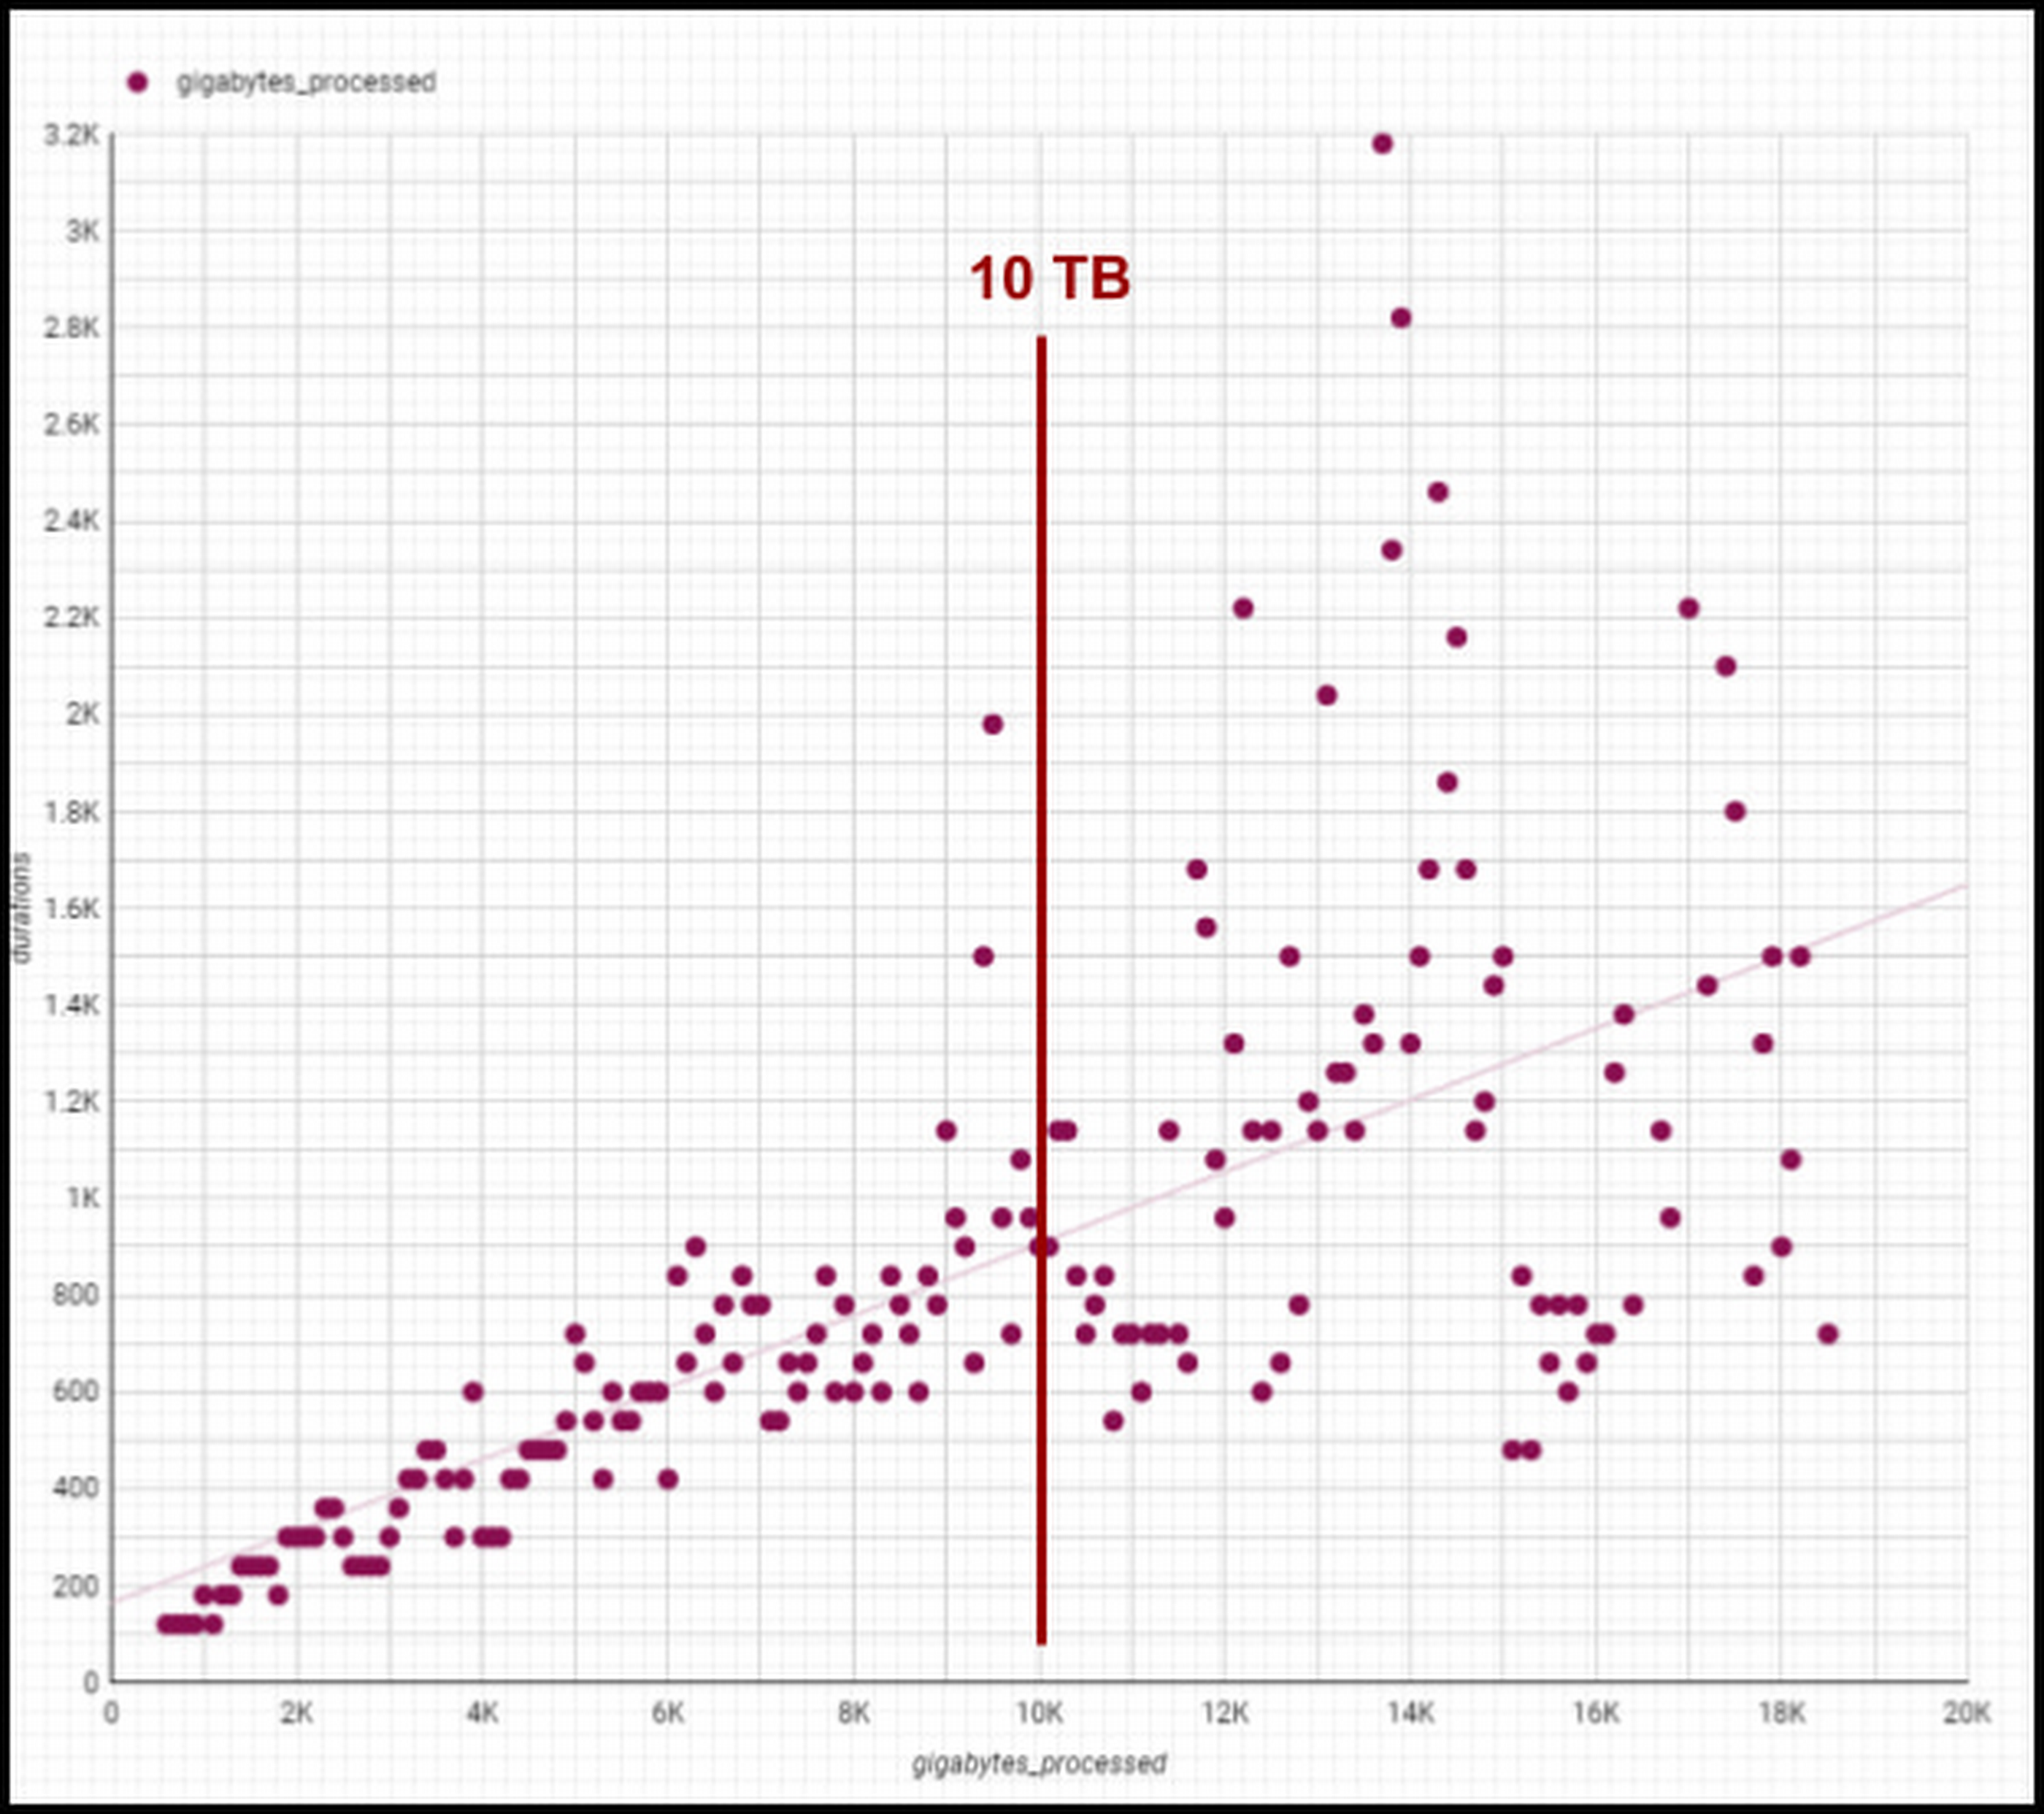
Though individual values vary greatly depending on query complexity [analytic functions/sorting can be computationally expensive], the overall trend line is below 1-1 for bytes versus duration, meaning our BigQuery query runtimes are increasing slower than our data volumes. We are still seeing sub 1:1 threshold runtimes, and we’re already at 100 PB of total data with single queries running on 50PB or more. Going strong!
One unexpected and pleasant surprise has been high performance for smaller queries, such as those required for development, interactive analytics, and internal applications we use for forecasting, segmentation, and other latency-sensitive data workflows. BigQuery’s resource management systems have provided smoother degradation and parallelism profiles than we initially expected for a multi-tenant platform.
We regularly see sub-second p50 query performance for interactive use cases, with p90 performance coming in under 10 seconds for Looker, Data Studio, and AtScale — meeting the threshold we set to avoid analysts losing focus during a business investigation. The chart below shows p50, p90, and p95 timing for core workloads, as well as the number of queries in each bucket and the number of unique users. [Looker and Atscale will use small numbers of service accounts for a large number of users].

This has enabled two important shifts in the way our customers experience analytics services:
- Delivering better user productivity. People no longer have long wait times to get results for a basic query delivering an improved overall user experience.
- Scaling our data transformation. BigQuery has proven, effective data transformation that allows us to embrace the industry shift away towards ELT (extract, load, transform) to transform raw data right within the database.
We no longer have to ask ourselves, “Can we meet the SLA for this data processing task?” The new conversation is, “Of course, we can meet it. What’s the associated cost based on how many resources we assign?” We can make cost and resource trade-offs clear to our users and say “yes” more often to requirements that have measurable business value.
Supporting cost vs. performance decisions
Democratized access to internal analytics is a powerful decision-making tool. With BigQuery’s robust tooling, the decision about how to best allocate computational resources is in the hands of the analytics groups closest to the business decision being made. If they want to spend a sprint optimizing a dashboard, they can show exactly how much money it will save. If they choose not to optimize a report, they can offset the decision with concrete cost savings and other realized value.
Wayfair teams also benefit from visibility into their committed costs by abstracting away the details of the underlying services, including BigQuery slots, the virtual CPUs used to execute SQL queries.
Take a look at this example view consumed by our teams (the metrics for these dashboards are from the BigQuery INFORMATION_SCHEMA (jobs and reservations tables):
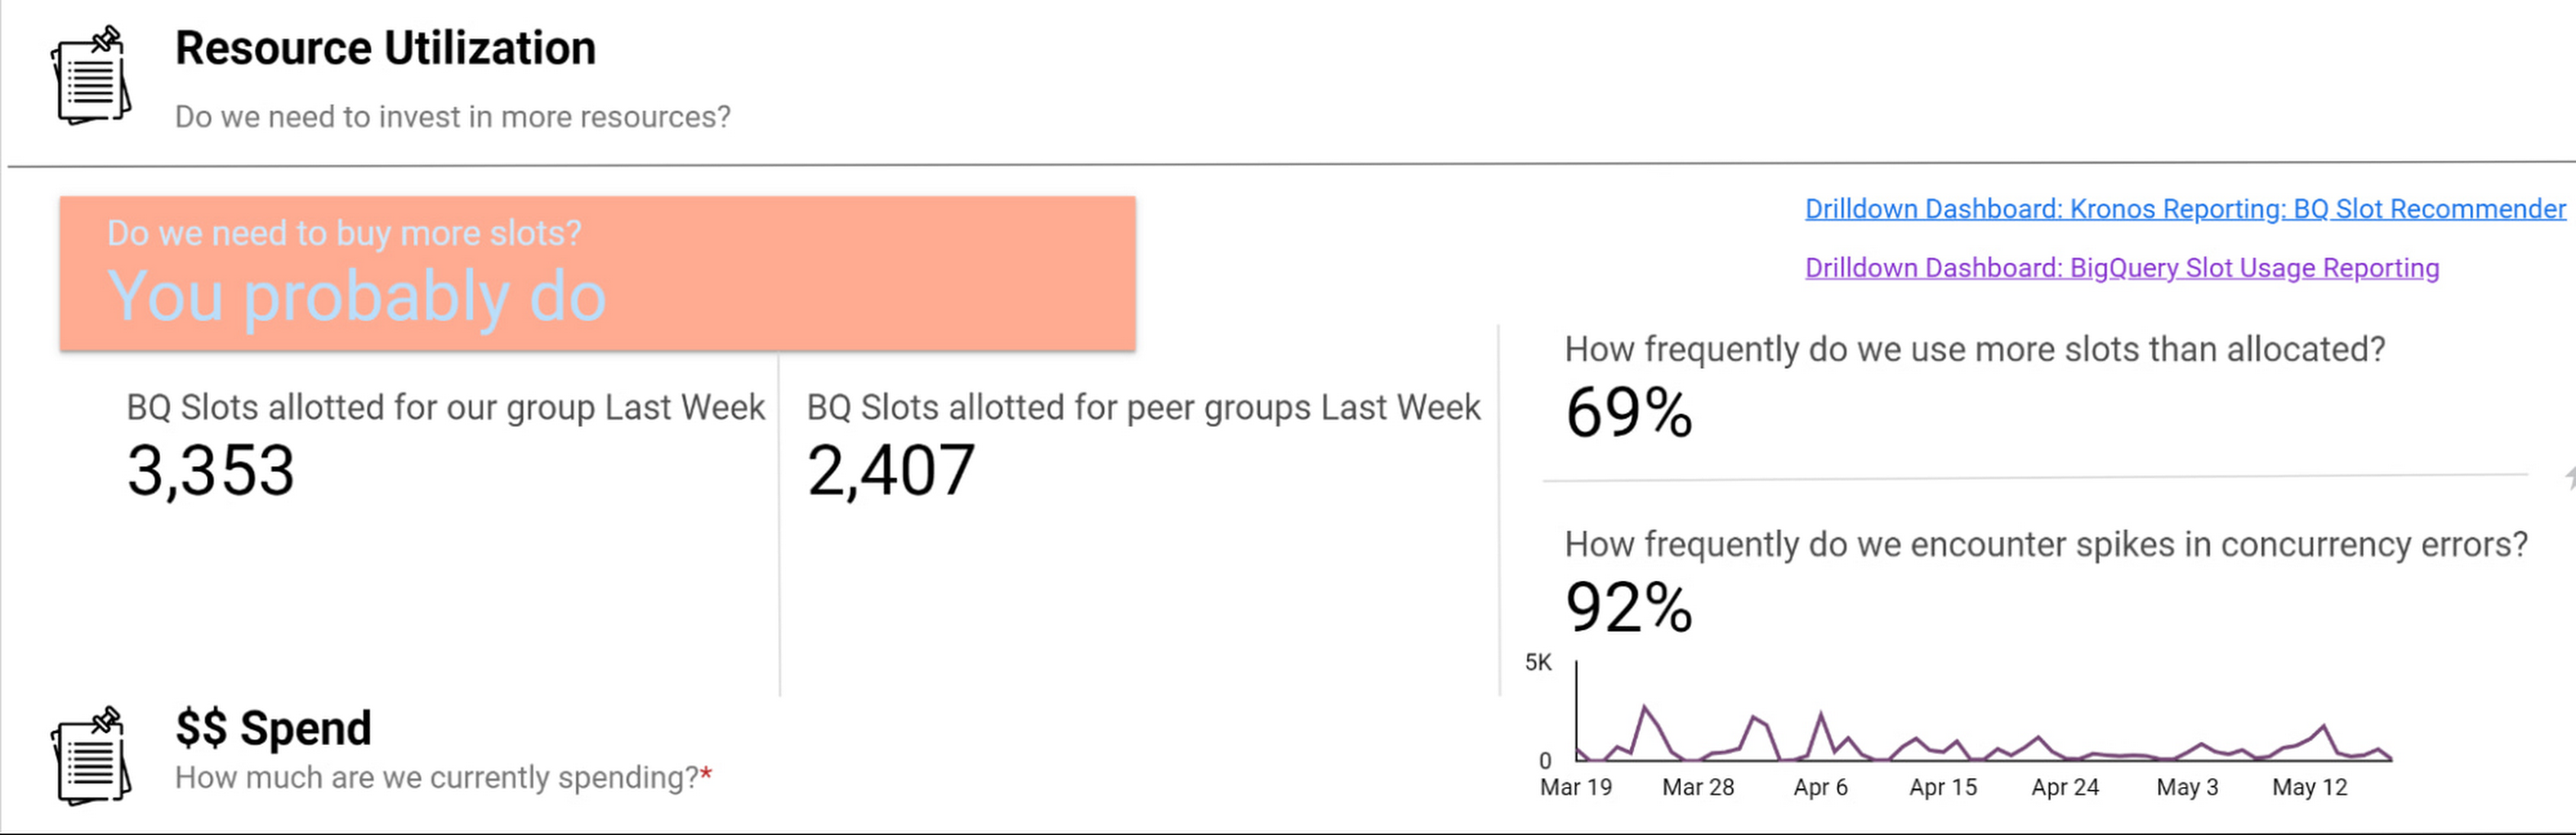
Suppose an organization wants to purchase capacity for a period of time. In that case, we provide an average cost for a slot during that time and charge them based on their slot usage for queries, multiplied by the average price.
Teams can see whether their consumption matches their reservations with a consistent, high-level number. We apply the same approach to tools like Dataproc by aggregating up the costs of component services and providing an organizational cost for those services.
How we use performance signals to improve user efficiency
Instead of overcorrecting for occasional performance fluctuations by allocating excessive resources, we try to align incentives so that people make the right choices for the business. Showback doesn’t work in a vacuum — it requires context and integrated insights. Teams need to show the cost of running a dashboard as well as the ROI is in terms of end user engagement and what peer dashboards with equivalent source datasets might cost.
We want to give users the freedom to do things the way they want and need to while also educating them on achieving their goals and using best practices to reduce their costs and improve their performance. The goal is never for all dashboards to load “less than x seconds” — we believe that any dashboard can load in x seconds when it is properly designed and resourced.
For instance, BigQuery allocates slots for a new workload quickly and efficiently, and queries that are optimized and have dedicated resources consistently complete quickly. When users experience a slowdown, it’s typically because they are sharing resources or inefficiently using their resources. Variable performance is a useful signal to help users discover opportunities to optimize queries and work more productively. We value these signals as we like to focus on the aggregate experience of all users interacting with the tool, not individual interaction.
A natural way to improve user efficiency is to reward ideal behaviors and discourage those that do not align with our analytics strategy. Some examples include splitting out high-demand reporting from ad-hoc exploration to reduce concurrency errors or encouraging people to use materialized tables instead of writing complex custom SQL. For instance, a dedicated reporting project might only include an organization’s Data Studio dashboard if it directly references a table or meets other optimization requirements. Using this approach, we give our users a high degree of freedom and experimentation at the entry-level while providing a well-documented path to scale.
Visibility into query performance improves business performance
The detailed tracking information we get from Google Cloud products is critical — Google’s robust analytics performance has enabled us to scale Data Studio to over 15,000 Wayfarians. Of course, a larger user base always comes with concerns that less sophisticated users may not appropriately optimize their queries or make the best use of the infrastructure.
Evaluating the different Data Studio dashboards helps us identify opportunities to use better query optimization practices, such as reducing custom queries, connecting directly to permanent tables, or using the BI Engine to improve dashboard performance. Recently, our team built new billing projects specific for Data Studio reporting. We can scale up a reservation dedicated to reporting about a major sales event in minutes.
Beyond everyday reporting, holidays and sales events may require higher, guaranteed performance. BigQuery’s flexible capacity commitments allow us to decide at a business level whether an urgent need requires us to reprioritize resources immediately or whether we have the time to optimize queries and rebuild dashboards to be performant. These new billing projects let us evaluate if teams need to scale up resourcing, what areas they can optimize in BigQuery, or if a new reservation is needed to resource that team separately.
Recommendations for achieving high performance at low cost
Are you wondering how to allocate BigQuery slots? Teams must see direct, immediate return on their investment in performance and optimization.
Our first rule of thumb is to align resource utilization with ownership as closely as possible. This makes it easier for teams to secure dedicated resources, even if they start out small. We’re comfortable doing this because BigQuery dynamically reassigns capacity between the targeted reservation and other consumers in milliseconds. We always get the total usage of our slots — there is no wasted capacity even when we break assignments down granularly.
Once a team has a reservation, we provide reporting that consumes various BigQuery information schema views, such as query logs and reservation information, and processes it into aggregated reporting. We look for metrics like the average slots available to a query at a point in time, overall query performance, and how long queries took to execute to pinpoint the overall health of a reservation against our business objectives. Flex slots also let us experiment easily with additional capacity, and BigQuery’s performance is so consistent that we can use straightforward models to estimate return on additional slot investment.
Other key cost optimization tips we have found helpful at Wayfair include:
- Optimize for worst-case performance. Given BigQuery’s ability to share slots, we expect teams will often see much better performance, but we find that thinking it’s more effective when teams think about the most pessimistic case when resourcing their jobs.
- Take advantage of BI Engine reservations. We like to think critically about the data and workload. BI Engine reservations are excellent for workloads that query lots of small dimension tables or a few larger tables loaded into memory. In cases like that, such as with OLAP tools using pre-computed aggregates, we’ve seen BI engine investments drive a 25% reduction in average query time—excellent ROI.
- Leverage Looker for large, longitudinal datasets. Since Looker supports a wide range of use cases, we see a broader range of performance — p50 is still under a second, but p95 can get as high as a minute. For these cases, we recommend modeling user patterns [first of month, first day of week] and dynamically allocating more slots for these periods while deprioritizing batch workloads in the key windows.
- Lean in heavily on the BQ cache for broad-based reporting. To avoid a Monday morning reporting lag, We use the BigQuery cache to avoid Monday morning report loading lags. Up to 30% of our Data Studio queries hit the BQ cache, ensuring our Data Studio p95 consistently stays under 10 seconds.
- Use slots-per-job to improve experience. In our reporting, we find that the most valuable view is slots-per-job. We look for dips in slots available for jobs as this situation often correlates strongly with poor user experiences. For example, our reporting showed us that Looker has the highest volumes of queries and users on Mondays and during each month’s first two business days. We used this information to scale up slots to support these periods of highest demand, delivering on performance SLAs to support business users.

- Get a global picture of usage. We manage slots in a central tool. Teams input their requirements into a calendar to indicate when they want higher or lower capacity to inform our flex slot purchases and annual commitments. It might seem like dozens of relatively inconsistent workloads at the team level, but the picture changes when you look at demand across a week (or our entire business). Understanding global usage makes it easy for us to model baseline capacity recommendations for serving year slots versus flexible demands.
Reaping the rewards of BigQuery
From our first initial undertaking with Google Cloud to transform our storefront, we had a lot of confidence in the underlying technology offerings and the teams that ran them and their ability to meet our unique requirements. But our experience using BigQuery for internal analytics at Wayfair has exceeded our already high expectations.
BigQuery’s fast, dynamic allocation of resources and ability to transform data in place are important to our mission of maintaining consistently high performance for our users while closely managing costs. Moreover, our visibility into query and dashboard performance through BigQuery’s DSP views and other performance metrics have helped us make clearer connections between performance goals and the costs required to meet them — and guide our analysts across the company towards attaining high performance on every project.
2839
Of your peers have already watched this video.
22:00 Minutes
The most insightful time you'll spend today!
Deploying Real-time AI: A Walkthrough
Enterprises are increasingly looking to leverage streaming data (customer interactions, sales transactions, machine logs) for building new innovative features, increasing sales, and protecting against risks.
AI/ML (artificial intelligence/machine learning) technologies make it possible to amp up the detection of insights in large volumes of data: insights that otherwise would be impossible to gain with manual inspection.
Learn how Dataflow together with TensorFlow Extended (TFX) and Cloud AI are enabling the extraction of label and classification information from video clips and natural text, predicting probabilities and detecting anomalies, fraud, and patterns in streams of business data.
5132
Of your peers have already watched this video.
15:30 Minutes
The most insightful time you'll spend today!
Analytics in a Multi-Cloud World with BigQuery Omni
Enterprises have more data at hand than they have ever had in the past. But are unable to leverage it fully.
“We have all of this data at our fingertips. But we just can’t quite get to it because we’re living in this world of data silos,” says Emily Rapp, Product Manager, Google Cloud.
Part of the problem is that over 80% of enterprises use more than one cloud provider. For many companies, leveraging a multi-cloud strategy is a competitive advantage, and sometimes a necessity. Multi-cloud allows organizations to meet users where they are and expedite their transformation journey to deliver a compelling customer experience.
So how can data teams manage? That’s why Google Cloud has introduced BigQuery Omni, a flexible, multi-cloud solution that lets you analyze data across clouds.
Watch the video to learn how to break down data silos in your environment and see how you can run analytics in a multi-cloud world.
Data to Business Outcomes with Google’s Data Analytics Design Pattern

6723
Of your peers have already read this article.
1:30 Minutes
The most insightful time you'll spend today!
Companies today are inundated with vast amounts of data from various sources. This overwhelming amount of data is meant to benefit the company, but often leaves data teams feeling overwhelmed, which can create data bottlenecks and result in a slow time to value. In fact, only twenty seven percent of companies agree that data and analytics projects produce insights and recommendations that are highly actionable (Accenture). This means that nearly 3 in 4 companies are not unlocking value in their data, which poses a huge challenge for organizations trying to move the needle and drive real business results. We at Google Cloud, however, saw opportunity in this challenge, which is why we created Data Analytics Design Patterns: cross-product technical solutions designed to accelerate a customer’s path to value realization with their data. These industry solutions bring together product capabilities alongside design methodology, open source deployable code, data models, and reference architectures to accelerate your business outcomes.

With Data Analytics Design Patterns, you get access to more than 30 ready-to-deploy data analytics solutions. Design patterns leverage the best of Google and our rich partner ecosystem, including Technology Partners & System Integrators. In this blog, we will cover 3 examples on how a design pattern can be applied to unlock the value of data:
- Improve mobile app experience with Unified App Analytics
- Maximize digital shop’s revenue with Price Optimization
- Protect internal systems from security and malware threat with Anomaly Detection
Unified App Analytics
If mobile apps are part of your go-to-market strategy, you have several data sources that can provide invaluable customer insights. In addition to tools such as CRM (e.g. Salesforce) and customer care (e.g. Zendesk), you likely use Google Analytics to log app events and Firebase Crashlytics to gather data about app errors. But can you easily combine back-end server data with app front-end data to unlock customer insights?
The Unified App Analytics design pattern makes it easy to plug all the disparate data sources into a single warehouse (BigQuery) and start analyzing it with a Business Intelligence tool (Looker). Once you have a complete and real time view of your customer experience with your app, you can take action. For example, if you notice an increase in app errors, you can quickly combine your Crashlytics data with your CRM data to narrow down the crashes with the highest revenue impact and prioritize their resolution. Further, you can automate your issue resolution workflow by creating a rule for any future crash that impacts a subset of VIP customers.

With the Unified App Analytics design pattern, you’ll gain access to valuable insights about your user experience with your app so you can inform your future app strategy. For example, NPR, an American media company, increased user engagement by showing content that better mapped to listener interests and behaviors.
Price Optimization
In a competitive and hectic global marketplace, strategic pricing matters more than ever, but often projects are consumed by the tedium of standardizing, cleaning, and preparing data—from transactions, inventory, demand, among other sources.
Price Optimization solution allows retailers to build a data driven pricing model. The solution consists of three main components:
- Dataprep by Trifacta: integrates different data sources into a single Common Data Model (CDM). Dataprep is an intelligent data service for visually exploring, cleaning, and preparing structured and unstructured data for analysis, reporting, and machine learning.
- BigQuery: allows you to create and store pricing models in a consistent and scalable way as a serverless Cloud Data Warehouse service
- Looker dashboards: surface insights and enable business teams to take action with enterprise ready BI platform
With the Price Optimization design pattern from Google Cloud and our partner Trifacta, you’ll be able to rapidly unify multiple data sources and create a real-time and ML-powered analysis, leveraging predictive models to estimate future sales. For example, PDPAOLA, an online jewelry company, doubled sales with dynamic pricing adjustments enabled by a single data view.

Anomaly Detection
Organizations need to anticipate and act on risks and opportunities to stay competitive in a digitally transforming society. Anomaly detection helps organizations identify and respond to data points and data trends in high velocity, high volume data sets that deviate from historical standards and expected behaviors, allowing them to take action on changing user needs, mitigate malicious actors and behaviors, and prevent unnecessary costs and monetary losses.
The Anomaly Detection design pattern uses Google Pub/Sub, BigQuery, Dataflow, and Looker to:
- Stream events in real time
- Process the events, extract useful data points, train the detection algorithm of choice
- Apply the detection algorithm in near-real time to the events to detect anomalies
- Update dashboards and/or send alerts
The challenge of finding the important insights and anomalies in vast amounts of data applies to organizations across all industries and lines of business, but is especially important to protecting the security of an organization. For example, TELUS, a national communications company, modernized their security analytics platform leveraging this pattern, allowing them to detect anomalies in near real time to detect and mitigate suspicious activity.
Get started
Turn your data into business outcomes with Google Cloud and our broad partner ecosystem by deploying Data Analytics Design Patterns at your organization. There are more than 30 Data Analytics Design Patterns ready for you to use. We have more than 200+ more ideas in the pipeline, so be sure to check in regularly as new patterns will be added soon.
To dive deeper and find out more about how Data Analytics Design Patterns can help your organization accelerate use cases and create faster time to value, check out this video.
Leverage the Power of Looker to Extract Data Value at Web Scale

4438
Of your peers have already read this article.
3:00 Minutes
The most insightful time you'll spend today!
Data science can be applied to business problems to improve practices and help to strengthen customer satisfaction. In this blog, we address how the addition of Looker extends the value of your Google Cloud investments to help you understand your customer journey, unlock value from first-party data, and optimize existing cloud infrastructure.
Data is a powerful tool
While everyone doesn’t need to understand the nuts and bolts of data technologies, most people do care about the value data can create for them — how it can help them do their jobs better. Within the data space, we are seeing a trend of ongoing failure to make data accessible to “humans” – the industry still hasn’t figured out how to put data into the hands of people when and where they need it, how they need it.
What if everyone in your organization could analyze data at scale, and make more-informed, fact-based decisions? Data and insights derived from data are valuable but only if your users see it. We think Looker helps solve that.
Solutions tell a larger story of how it all fits together
Across all verticals and industries, businesses benefit from knowing and understanding their customers better. Many business goals are to increase revenue by improving product recommendations and pricing optimization, improving the user experience through targeted marketing and personalization, and reducing churn while improving retention rates. To help reach these goals, key strategies should focus on understanding customer needs, their motivations, likes and dislikes, and using all available data – in other words, put yourself in the shoes of your customer.
Our goal with Looker solutions is to offer the right level of out-of-box support that allows customers to get to value quickly, while maintaining the necessary flexibility. We aim to offer a library of data-driven solutions that accelerate data projects. Many solutions include Looker Blocks (pre-built pieces of code that accelerate data exploration environments) and Actions (custom integrations) that get customers up and running quickly and lets you build business-friendly access points for Google Cloud functionality like BQML, App Engine and Cloud Functions.
Below, you’ll find a sampling of the newest Looker solutions.
Listening to customers by looking at the data
Looker’s solution for Contact Center AI (CCAI), helps businesses gain a deeper understanding and appreciation of their customers’ full journey by unlocking insights from all their company’s first-party data. Call centers can converse naturally with customers and deliver outstanding experiences by leveraging artificial intelligence. CCAI‘s newest product —CCAI Insights — reviews conversations support agents are having, finding and annotating the data with the important information, and identifying the calls that need review. We’ve partnered with the product teams at CCAI to build Looker’s Block for CCAI Insights, which sets you on the path to integrating the advanced insights into your first-party data in Looker, overlaying business data with the customer experience.

Businesses can better understand contact center experiences and take immediate action when necessary to make sure the most valuable customers receive the best service.
Realizing full business value of First-Party data
Looker for Google Marketing Platform (GMP) provides marketers the power to unlock the value of their company’s first-party data to more effectively target audiences. The Looker Blocks and Actions for GMP offer interactive data exploration, slices of data with built-in ML predictions and activation paths back to the GMP. This strategic solution continues to evolve with the Looker Action for Google Ads (Customer Match), the Looker Action for Google Analytics (Data Import) and the Looker Block for Google Analytics 4 (GA4).
- The Looker Action for Customer Match allows marketers to send segments and audiences based on first-party data directly into Google Ads. Reach users cross-device and across the web’s most powerful channels such as Display, Video, YouTube, and Gmail. The entire process is performed within a single screen in Looker, and is able to be completed in a few minutes by a non-technical user.
- The Looker Action for Data Import can be used to enhance user segmentation and remarketing audiences in Google Analytics by taking advantage of user information accessible in Looker, such as in CRM systems or transactional data warehouses.
- The Looker Block for Google Analytics 4 (GA4) expands the solution’s support with out-of-the-box dashboards and pre-baked BigQuery ML models for the newest version of Google Analytics.The Looker Block offers up reports with flexible configuration capabilities to unlock custom insights beyond the standard GA reporting. Customize audience segments, define custom goals to track and share these reports with teams who do not have access to the GA console.
From clinical notes to patient insights at scale
Taking a look at the Healthcare vertical, the Looker Healthcare NLP API Block serves as a critical bridge between existing care systems and applications hosted on Google Cloud providing a managed solution for storing and accessing healthcare data in Google Cloud. The Healthcare NLP API uses natural language models to extract healthcare information from medical text, rapidly unlocking insights from unstructured medical text and providing medical providers with simplified access to intelligent insights. Healthcare providers, payers, and pharma companies can quickly understand the context and relationships of medical concepts within the text, such as medications, procedures, conditions, clinical history, and begin to link this to other clinical data sources for downstream AI/ML.
Specifically, the natural language processing (NLP) Patient View (pictured below) allows you to review a single selected patient of interest, surfacing their clinical notes history over time. It informs clinical diagnosis with family history insights, which is not currently captured in claims, and captures additional procedure coding for revenue cycle purposes.

The dashboard below shows the NLP Term View which allows users to focus on chosen medical terms across the entire patient population in the dataset so they can start to view trends and patterns across groups of patients.

This data can be used to:
- Enhance patient matching for clinical trials
- Identify re-purposed medications
- Drive advancements for research in cancer and rare diseases
- Identify how social determinants of health impact access to care
Managing Costs Across Clouds
Effective cloud cost management is important for reasons beyond cost control — it provides you the ability to reduce waste and predictably forecast both costs and resource needs. Looker’s solution for Cloud Cost Management offers quick access to necessary reporting and clear insights into cloud expenditures and utilization.
This solution brings together billing data from different cloud providers in a phased approach: get up and running quickly with Blocks optimized for where the data is today (Google Cloud, AWS or Azure) as you work towards more sophisticated analysis for cross-platform planning and even cloud spend optimization with the mapping of tags, labels and cost centers across clouds.
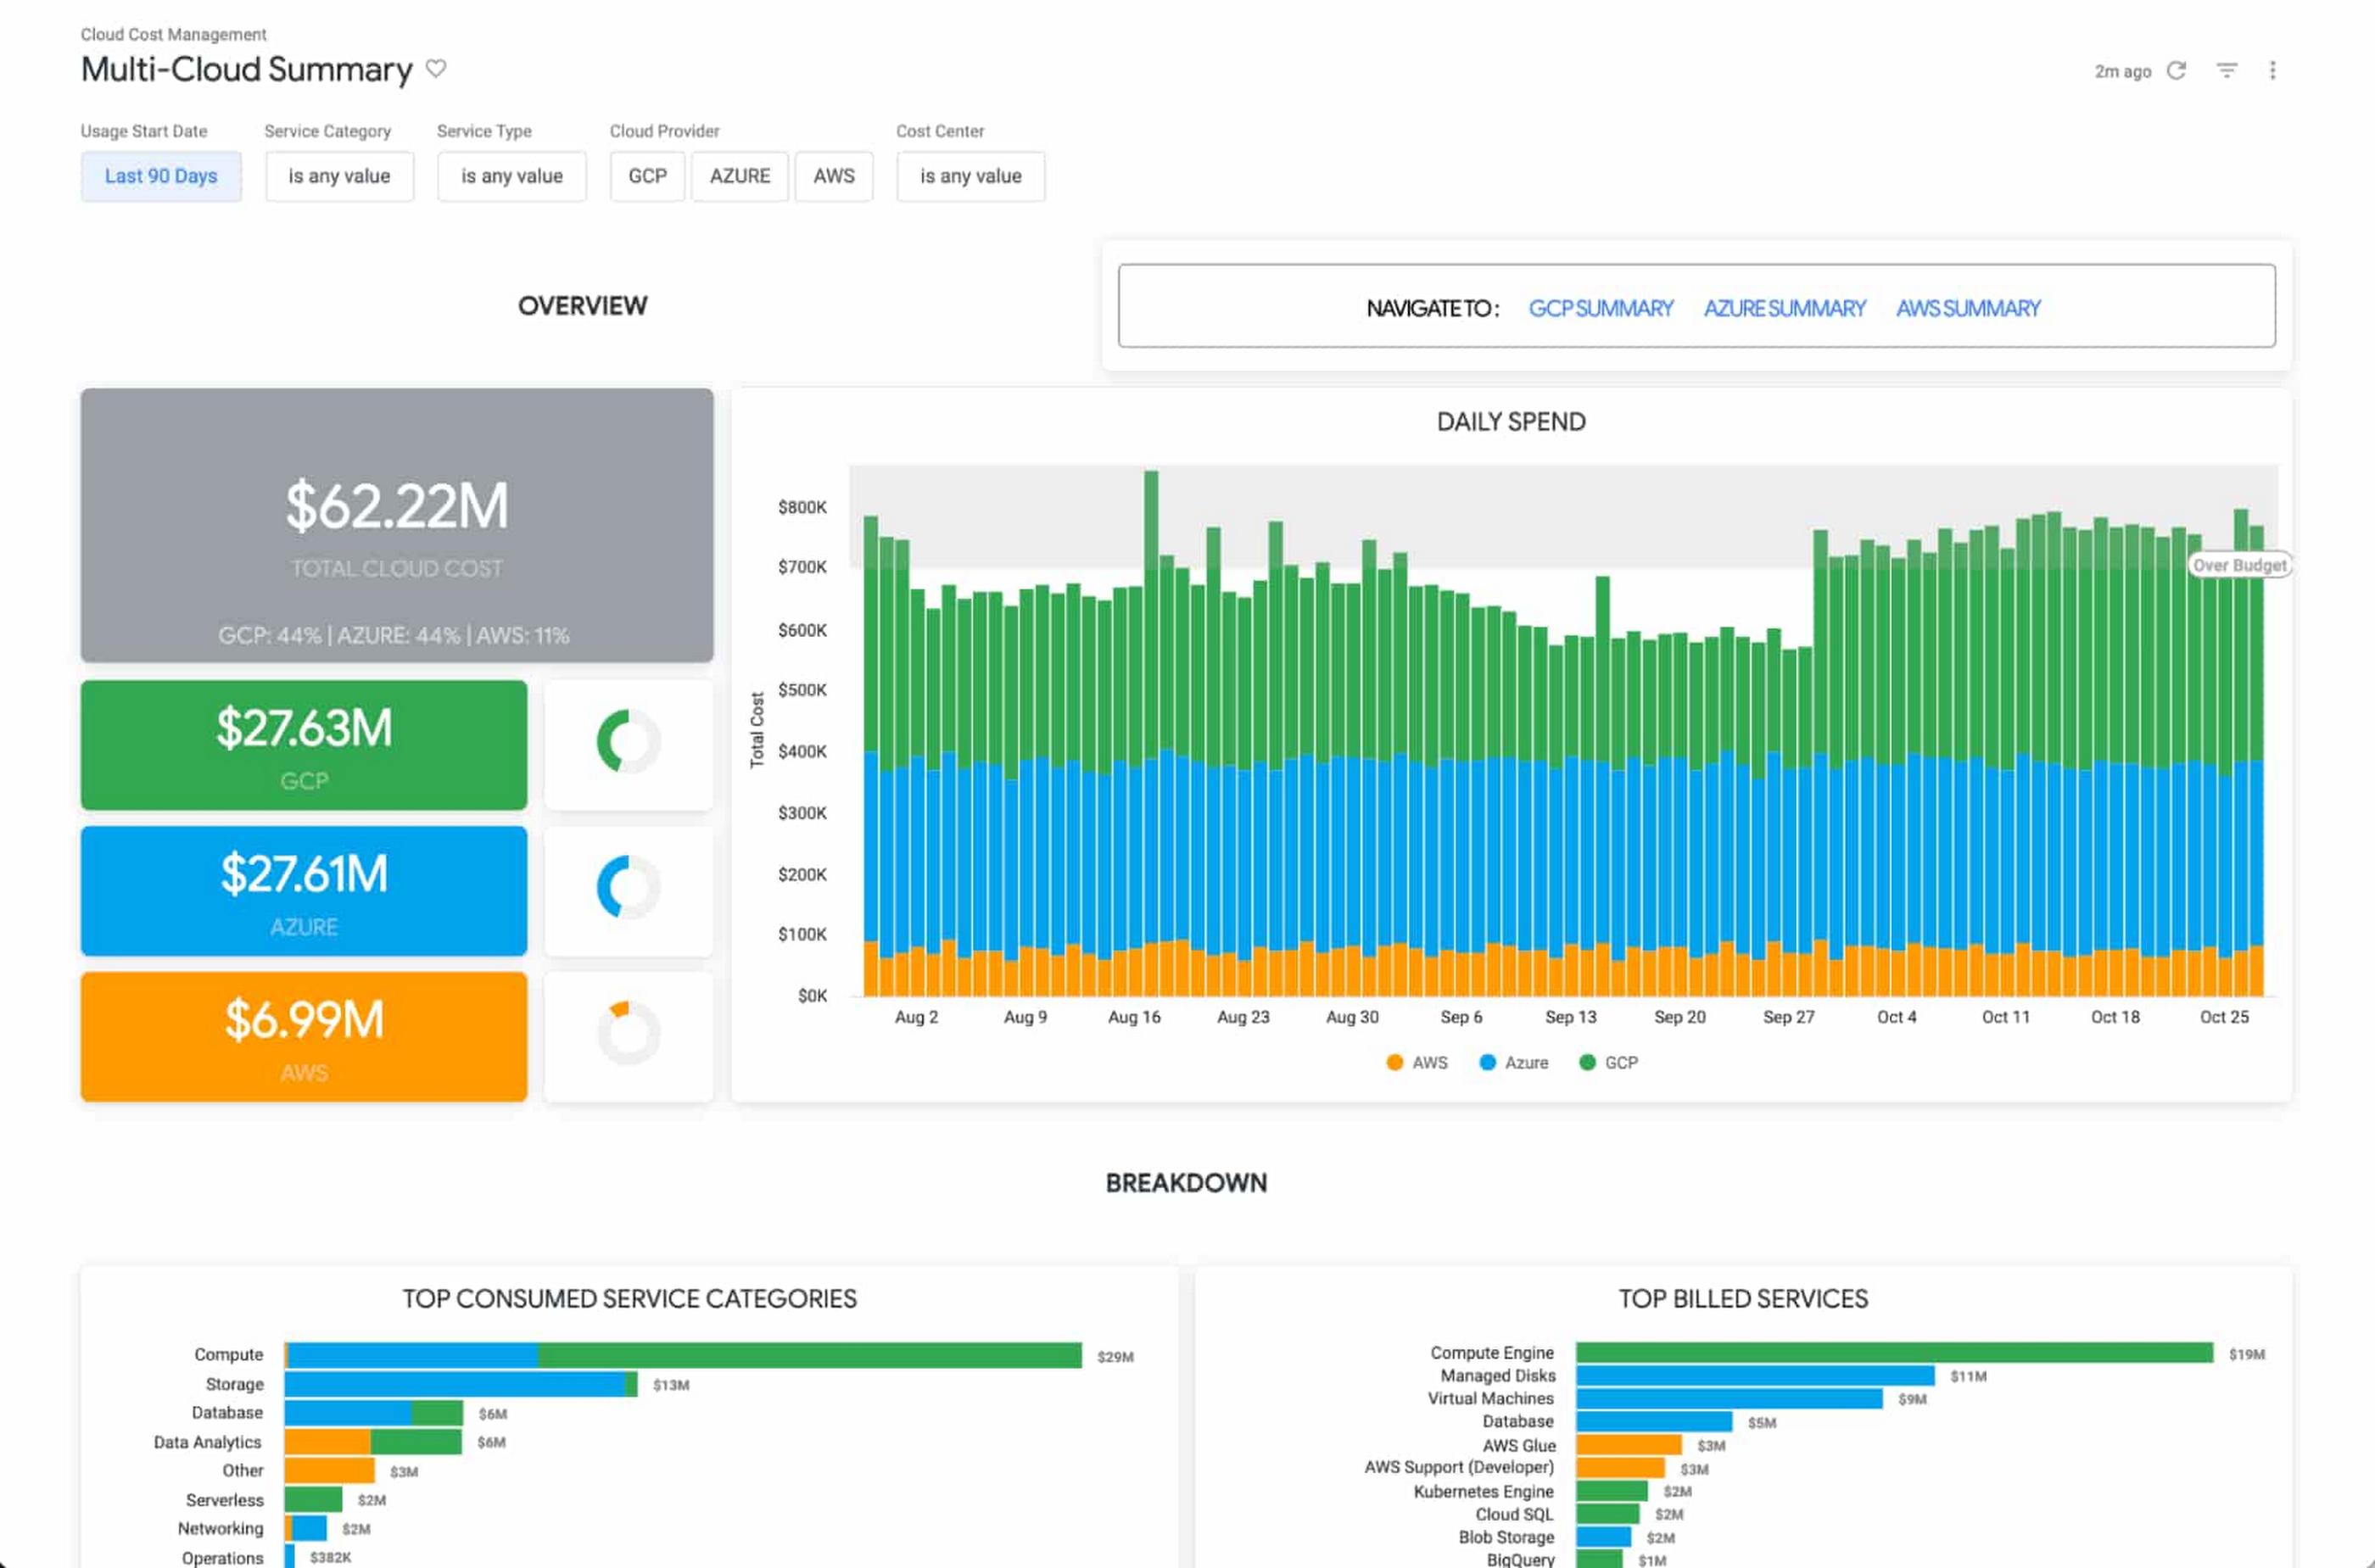
The Looker Cloud Cost Management solution provides operational teams struggling to monitor, understand, and manage the costs and needs associated with their cloud technology with a comprehensive view into what, where and why they are spending money.
Making better decisions with Looker-powered data
Leading companies are discovering ways to get value from all of that data beyond displaying it in a report or a dashboard. They want to enable everyone to make better decisions but that’s only going to happen if everyone can ask questions of the data, and get reliable, correct answers without using outdated or incomplete data and without waiting for it. People and systems need to have data available to them in the way that makes the most sense for them at that moment.
It’s clear that successful data-driven organizations will lead their respective segments not because they use data to create reports, but because they use it to power data experiences tailored to every part of the business, including employees, customers, operational workflows, products and services.
As people’s way of experiencing data has evolved, more than ever before, dashboards alone are not enough. You can use data as fuel for data-driven business workflows, and to power digital experiences that improve customer engagement, conversions, and advocacy.
From Nov. 9 – 11th, Looker is hosting its annual conference JOIN, where we’ll be showing new features, including how we help to:
- Build data experiences at the speed of business
- Accelerate the business value with packaged experiences
- Unleash more insights for more people in the right way – Deliver data experiences at scale
There is no cost to attend JOIN. Register here and learn how Looker helps organizations build and deliver custom data-driven experiences that goes beyond just reports and dashboards, scales and grows with your business, allows developers to build innovative data products faster, and ensures data reaches everyone.
STAC-M3 Tick History Analytics in Google Cloud Benchmark Results Reveals it is 18X Faster than Previous Version

4752
Of your peers have already read this article.
5:00 Minutes
The most insightful time you'll spend today!
The Securities Technology Analysis Center (STAC®), an organization that improves technology discovery and assessment in the finance industry through dialog and research, recently audited the STAC-M3™ benchmark suite on Google Cloud (SUT ID KDB211210). These enterprise tick-analytics benchmarks assess the ability of a solution stack such as database software, servers, and storage, to perform a variety of I/O-intensive and compute-intensive operations on historical market data.
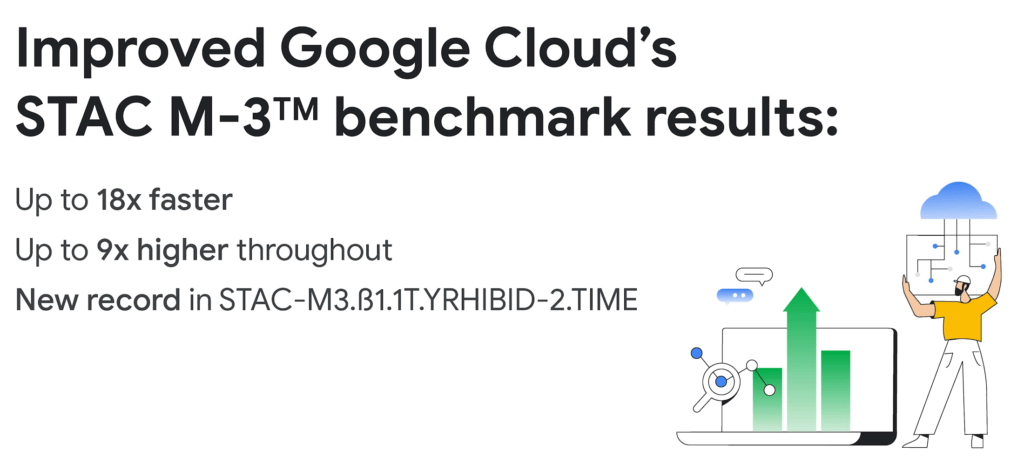
Following up on our previous STAC-M3 benchmark audit (SUT ID KDB181001), a redesigned Google Cloud architecture leveraged the most recent version of kdb+ 4.0, the time-series database from KX, and achieved significant improvements: 35 out of 41 benchmarks ran faster in the new cluster – by up to 18x faster than Google Cloud’s prior results. Key highlights include the following:
Compared to the previous STAC-M3 Antuco suite results on Google Cloud:
- Was faster in 13 of 17 mean response-time benchmarks
- Was 18x faster – a 94% reduction in run time – in the version of Year-High Bid that allows caching (STAC-M3.ß1.1T.YRHIBID-2.TIME), which also set an overall record for all published results
- Had 9x higher throughput in Year-High Bid (STAC-M3.ß1.1T.YRHIBID.MBPS)
Compared to the previous STAC-M3 Kanaga suite results on Google Cloud:
- Was faster in 22 of 24 mean response-time benchmarks
- Was over 10x faster in all four Market Snapshot workloads (STAC-M3.ß1.10T.YR[2,3,4,5]-MKTSNAP.TIME)
- Had 5x the throughput in Year-High Bid involving 2 years of data (STAC-M3.ß1.1T.2YRHIBID.MBPS)
“The STAC-M3 standard was designed by financial firms to reveal the performance of tick analytics stacks. Generational improvements like those exhibited by Google Cloud’s most recent STAC-M3 audit, are important data points for firms evaluating new architectures for performance and scale,” said Peter Nabicht, President of STAC.
These performance results may translate to real-world advantages that may be difficult for investment firms to achieve in static and costly on-premises environments: immediate answers in high data velocity markets, more thoroughly explored research theories by adding data or new quantitative approaches, and reduced costs by releasing cloud resources more quickly.
STAC-M3: High-speed tick analytics
Designing for record-breaking results
In our STAC-M3 audit, the stack under test (SUT) was designed to take advantage of horizontal scalability in the cloud by sharding data across independent compute nodes. The cluster of 12 Google Compute Engine N2 instances was powered by Intel Cascade Lake, with each node using 32 vCPUs, 160GiB of memory, and 9TiB of local NVMe SSDs. The full STAC-M3 Antuco and Kanaga data set was split across the cluster and kdb+ scripts distributed queries between nodes.
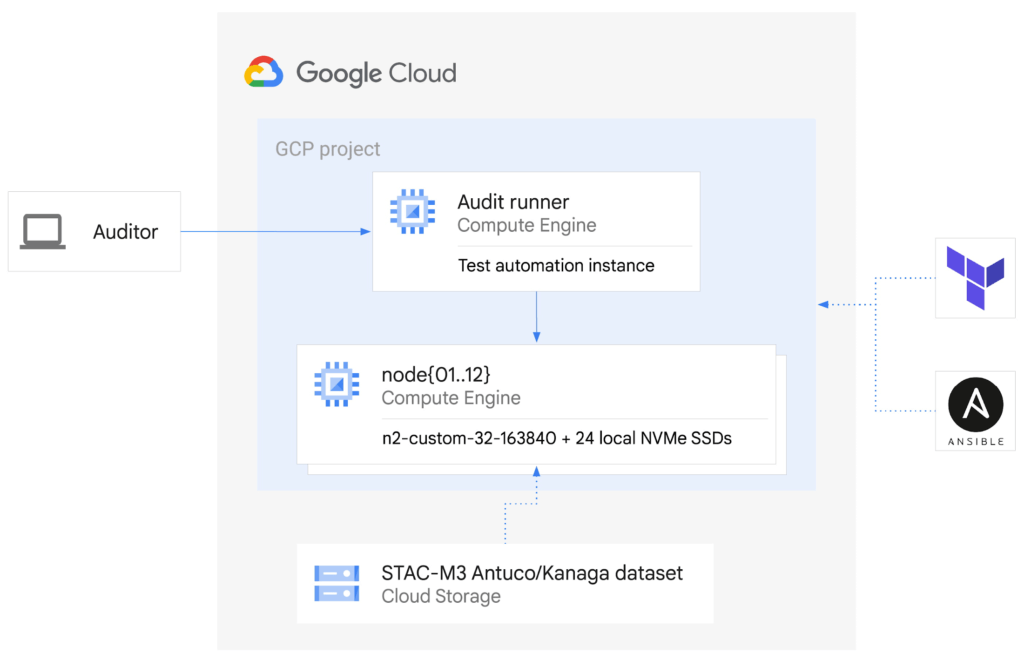
This configuration was the sweet spot for this particular workload, but this architecture does not need to be limited to 12 nodes for other workloads – the data sharding algorithm could scale to any number of nodes as required by workload demands. Since scaling out the cluster in this manner increases the total pool of available storage, this architecture can continue scaling out to petabytes of storage across hundreds of nodes.
The ability to spawn large clusters with hundreds of thousands of processors on demand at low cost, and to delete the resources when jobs complete, not only changes the economics of running computations on large financial data sets, it also opens up opportunities to explore solutions to new types of problems that were previously overlooked due to the constraints of fixed hardware on-premises. You can check the pricing of this VM configuration using the Google Cloud Pricing Calculator. The costs can be reduced even further by using preemptible VMs.
While the new cluster used a similar number of nodes, cores, and total memory as the previously-audited cluster, the redesigned architecture allowed us to harness the low latency and high throughput of Local NVMe SSDs.
Resources on demand
The cluster was created on demand using Terraform and Ansible during testing and auditing. The use of infrastructure as code (IaC) techniques ensured that the cluster, fully loaded with the STAC-M3 data set, could be created when needed and then removed when benchmarking was complete. It also meant that the cluster configuration was enforced by code on each deployment, eliminating configuration variance and drift. The full IaC definition to create the cluster can be retrieved from the report in the STAC Vault.
Each time the cluster was created, data was streamed to Local SSDs from Google Cloud Storage, our reliable and secure object storage, at up to the line rate of 32Gbps per node. The entire 57TiB STAC-M3 Antuco and Kanaga data was replicated from Cloud Storage to local storage in approximately 20 minutes.
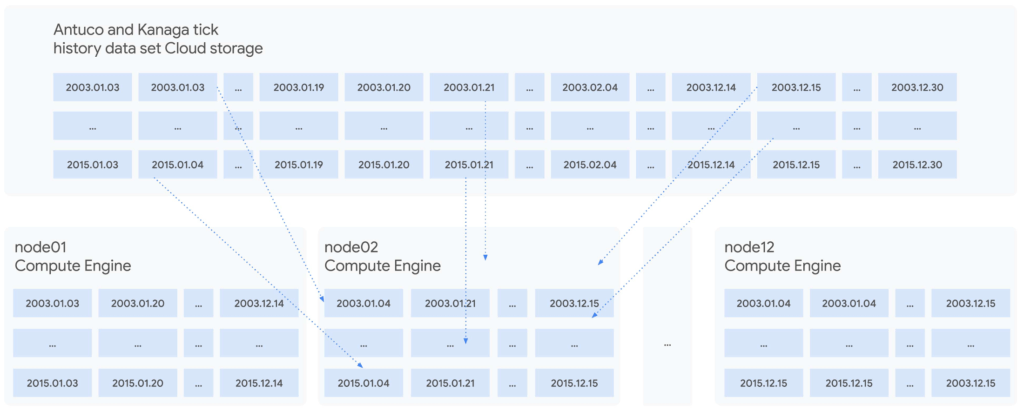
Since each node was independent and responsible for its own shard of data, doubling the cluster size would cut the synchronization time in half, or copy twice as much data in the same amount of time. Using higher bandwidth options of up to 100Gbps would triple the possible throughput for a relatively small incremental cost, trading an approximately 11%-23% price increase at current list prices for a 200% data synchronization performance increase. Taking advantage of fast networking to cache sharded data in parallel to a large cluster makes storing bulk data in Cloud Storage viable for even the largest workloads.
For quants working on vast data sets in sprawling compute clusters, the ability to fully describe infrastructure as declarative code, create elastic resources on demand, cache data quickly from cheap bulk storage, and turn resources off when computations complete is a dramatic change compared to waiting months to grow on-premises clusters – and a compelling reason to use cloud infrastructure.
To see how we designed and optimized the cluster for API-driven cloud resources, read our new whitepaper.
STAC-A2™: Calculating derivatives risk
In 2018, we showed that cloud instances can outperform bare metal when analyzing large tick history data sets in the demanding suite of STAC-M3 benchmarks. Last year, Google Cloud’s partner Appsbroker showed that the same was true for calculating derivatives risk in STAC-A2 on Google Cloud. You can read about how Appsbroker built its record-breaking STAC-A2 compute cluster on Google Cloud in its blog post, or access the STAC Report directly. Here are the highlights:
Compared to all other publicly reported solutions, this solution, based on a cluster of 10 virtual machines, had:
- The highest throughput (STAC-A2.β2.HPORTFOLIO.SPEED)
- The fastest cold time in the large problem size (STAC-A2.β2.GREEKS.10-100k-1260.TIME.COLD)
Compared to a solution involving an 8-node, on-premises cluster (SUT ID INTC181012), this 10-node, cloud-based solution:
- Had 5 times the maximum paths (STAC-A2.β2.GREEKS.MAX_PATHS)
- Had 10% greater throughput (STAC-A2.β2.HPORTFOLIO.SPEED)
- Was 18% faster in cold runs of the large problem size (STAC-A2.β2.GREEKS.10-100k-1260.TIME)
- Was 9% faster in cold runs of the baseline problem size (STAC-A2.β2.GREEKS.TIME.COLD)
Finding market advantages with Google Cloud
Across the investment management industry, every firm is seeking many of the same competitive advantages. However, finding unique opportunities and managing larger and larger data sets is becoming a major strain. Cloud is fundamentally changing how quants tackle the problem while empowering them to manage risk and generate higher returns.
Building on-premises computing clusters with tens or hundreds of thousands of cores and petabytes of storage requires huge up-front investments and lead time measured in months or years. Google Cloud makes the same scale available to its customers, provisioned on demand and paid per use. More importantly, the elasticity of cloud resources enables agility that is simply not available in a fixed data center cluster – the agility to explore, experiment, iterate, and respond to markets faster than before.
Scaling out to tens of thousands of cores in minutes and then removing the resources immediately not only changes the speed at which questions can be answered; it encourages different and more frequent questions, asked simultaneously on many independent clusters, free from the constraints of fixed on-premises hardware.
It is this flexibility and power that enables financial services firms to leverage larger data sets and get results, backtest, research, and analyze large amounts of data, faster and whenever they need it.
Download our whitepaper to learn more about our latest STAC-M3 tick history analytics benchmark results and how to optimize cloud infrastructure for high-speed market data analysis.
More Relevant Stories for Your Company

Google and AI Researchers Work towards Building Data-centric AI
AI researchers and engineers need better data to enable better AI solutions. The quality of an AI solution is determined by both the learning algorithm (such as a deep-neural network model) and the datasets used to train and evaluate that algorithm. Historically, AI research has focused much more on algorithms

ActivStat: Enhancing Live Sports Broadcast with Real-time Stats and Metrics
Millions of people annually view esports, as top players and teams compete in thrilling, fast-paced tests of reflexes, strategy, and teamwork. Fans are a diverse group, sharing a passion for action. A new, revolutionary project we’re working on with Call of Duty League just made that action a lot better.

10 Reasons that Make Google Cloud the Champion of IaaS
When you choose to run your business on Google Cloud you benefit from the same planet-scale infrastructure that powers Google’s products such as Maps, YouTube, and Workspace. We have picked 10 ways in which Google Cloud Infrastructure services outshine alternatives in the market in how they simplify your operations, save

S4 Agtech Transforms Agriculture with Google Cloud
Like countless other industries, farming is going digital and undergoing big changes—driven by access to more actionable information. The agriculture business can now gather and analyze georeferenced data from satellites, combined with data from IoT sensors in fields, crop rotation and yield histories, weather patterns, seed genotypes and soil composition to help
