





Developers and Practitioners’ Guide for Moving On-prem Data Warehouse to BigQuery
5415
Of your peers have already read this article.
3:00 Minutes
The most insightful time you'll spend today!
Data teams across companies have continuous challenges of consolidating data, processing it and making it useful. They deal with challenges such as a mixture of multiple ETL jobs, long ETL windows capacity-bound on-premise data warehouses and ever-increasing demands from users. They also need to make sure that the downstream requirements of ML, reporting and analytics are met with the data processing. And, they need to plan for the future – how will more data be handled and how new downstream teams will be supported?
Checkout how Independence Health Group is addressing their enterprise data warehouse (EDW) migration in the video above.
Why BigQuery?
On-premises data warehouses become difficult to scale so most companies’ biggest goal is to create a forward looking system to store data that is secure, scalable and cost effective. GCP’s BigQuery is serverless, highly scalable, and cost-effective and is a great technical fit for the EDW use-case. It’s a multicloud data warehouse designed for business agility. But, migrating a large, highly-integrated data warehouse from on-premise to BigQuery is not a flip-a-switch kinda migration. You need to make sure your downstream systems dont break due to inconsistent results in migrating datasets, both during and after the migration. So..you have to plan your migration.
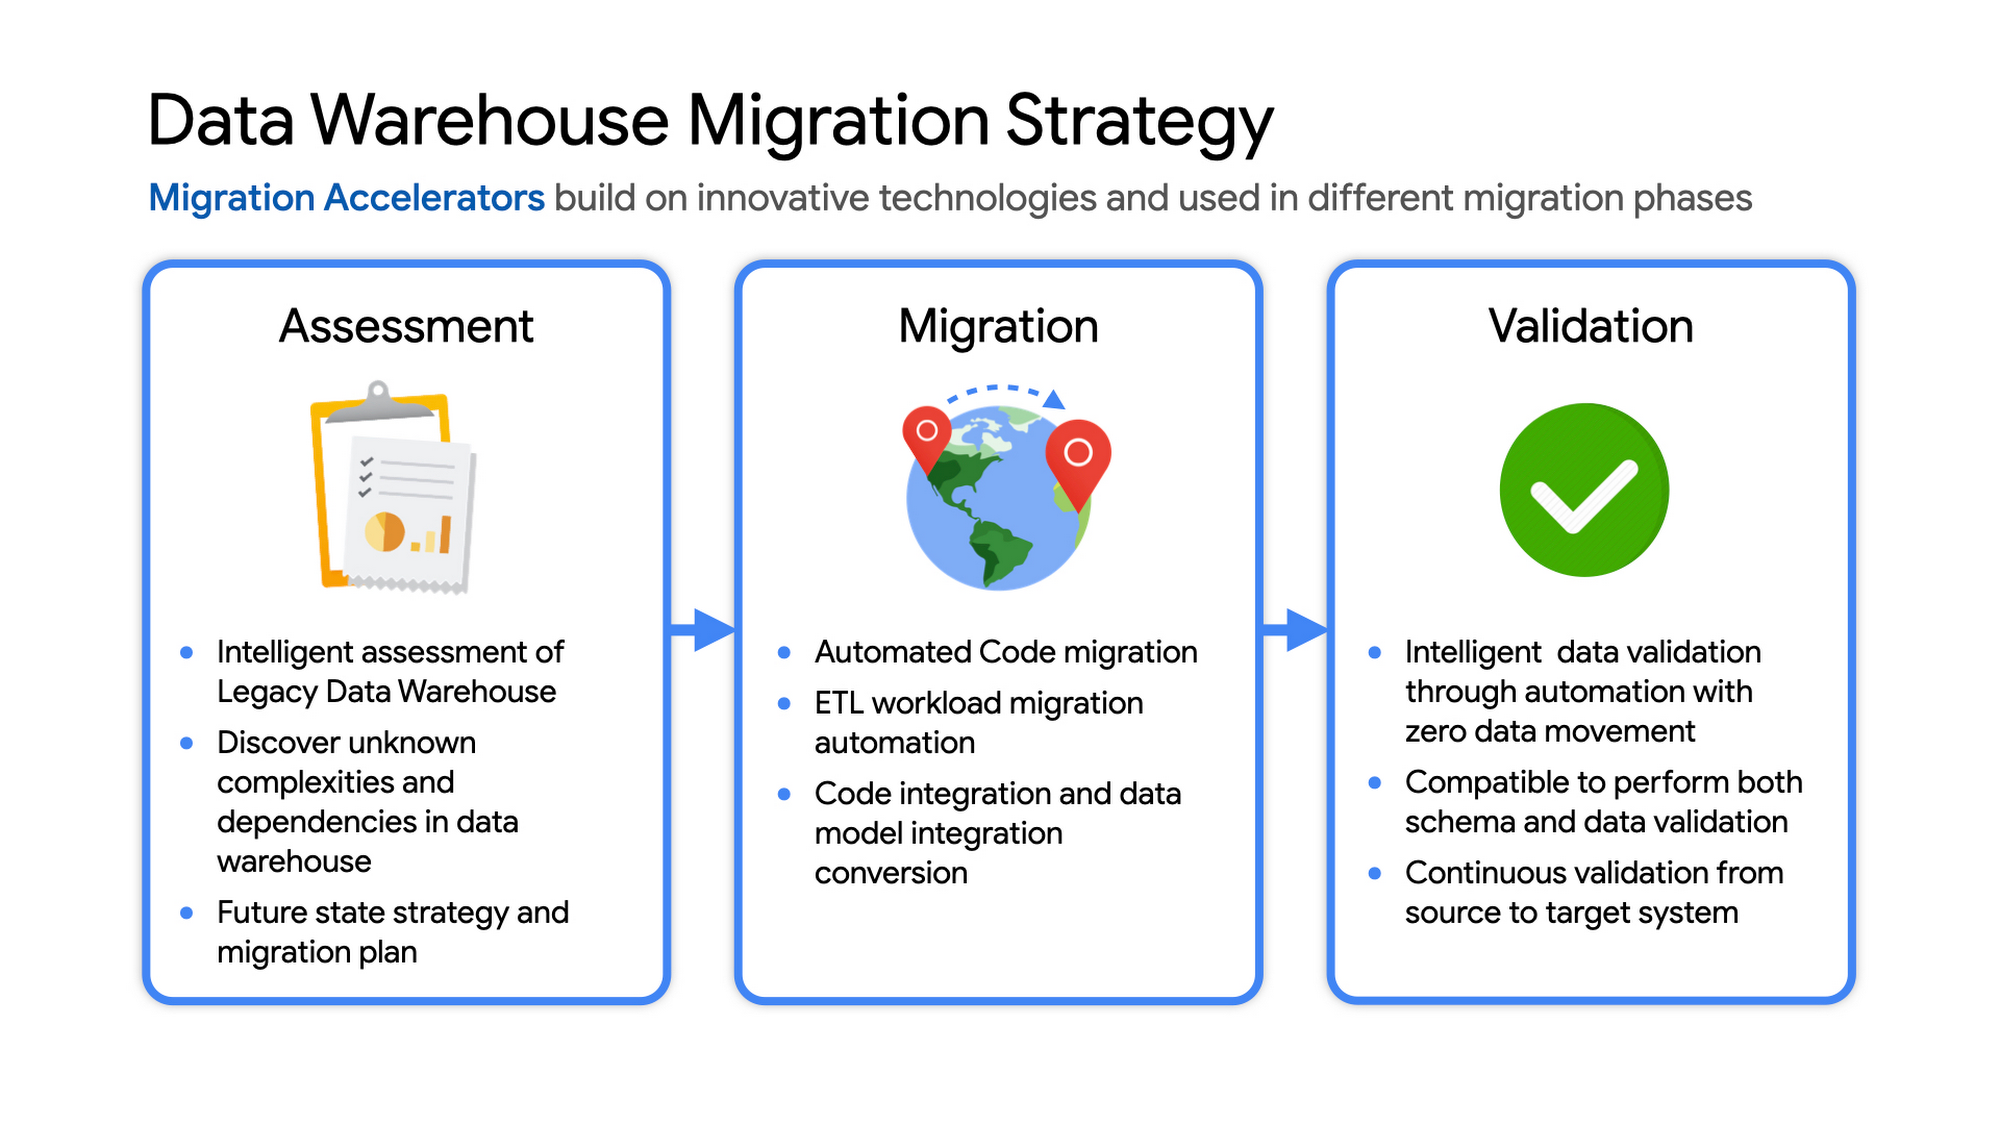
Data warehouse migration strategy
The following steps are typical for a successful migration:
- Assessment and planning: Find the scope in advance to plan the migration of the legacy data warehouse
- Identify data groupings, application access patterns and capacities
- Use tools and utilities to identify unknown complexities and dependencies
- Identify required application conversions and testing
- Determine initial processing and storage capacity for budget forecasting and capacity planning
- Consider growth and changes anticipated during the migration period
- Develop a future state strategy and vision to guide design
- Migration: Establish GCP foundation and begin migration
- As the cloud foundation is being set up, consider running focused POCs to validate data migration processes and timelines
- Look for automated utilities to help with any required code migration
- Plan to maintain data synchronization between legacy and target EDW during the duration of the migration. This becomes a critical business process to keep the project on schedule.
- Plan to integrate some enterprise tooling to help existing teams span both environments
- Consider current data access patterns among EDW user communities and how they will map to similar controls available in Big Query.
- Key scope includes code integration and data model conversions
- Expect to refine capacity forecasts and refine allocation design. In Big Query there are many options to balance cost and performance to maximize business value. For example, you can use either on-demand or flat-rate slot pricing or a combination of both.
- Validation and testing
- Look for tools to allow automated, intelligent data validation
- Scope must include both schema and data validation
- Ideally solutions will allow continuous validation from source to target system during migration
- Testing complexity and duration will be driven by number and complexity of applications consuming data from the EDW and rate of change of those applications
A key to successful migration is finding Google Cloud partners with experience migrating EDW workloads. For example, our Google Cloud partner Datametica offers services and specialized Migration Accelerators for each of these migration stages to make it more efficient to plan and execute migrations.
Data warehouse migration: Things to consider
- Financial benefits of open source: Target moving to ‘Open Source’ where none of the services have license fees. For example BigQuery uses Standard SQL; Cloud Composer is managed Apache Airflow, Dataflow is based on Apache Beam. Taking these as managed services provides the financial benefits of open source, but avoids the burden of maintaining open source platforms internally.
- Serverless: Move to “serverless” big data services. The majority of the services used in a recommended GCP data architecture scale on demand allowing more cost effective alignment with needs. Using fully managed services lets you focus engineering time on business roadmap priorities, not building and maintaining infrastructure.
- Efficiencies of a Unified platform: Any data warehouse migration involves integration with services that surround the EDW for data ingest and pre-processing and advanced analytics on the data stored in the EDW to maximize business value. A cloud provider like GCP offers a full breadth of integrated and managed ‘big data’ services with built-in machine learning. This can yield significantly reduced long-term TCO by increasing both operational and cost efficiency when compared to EDW-specific point solutions.
- Establishing a solid cloud foundation: From the beginning, take the time to design a secure foundation that will serve the business and technical needs for workloads to follow. Key features include: Scalable Resource Hierarchy, Multi-layer security, multi-tiered network and data center strategy and automation using Infrastructure-as-Code. Also allow time to integrate cloud-based services into existing enterprise systems such as CI/CD pipelines, monitoring, alerting, logging, process scheduling, and service request management.
- Unlimited expansion capacity: Moving to cloud sounds like a major step, but really look at this as adding more data centers accessible to your teams. Of course, these data centers offer many new services that are very difficult to develop in-house and provide nearly unlimited expansion capacity with minimal up-front financial commitment. .
- Patience and interim platforms: Migrating an EDW is typically a long running project. Be ready to design and operate interim platforms for data synchronization, validation and application testing. Consider the impact on up-stream and down-stream systems. It might make sense to migrate and modernize these systems concurrent with the EDW migration since they are probably data sources and sinks and may be facing similar growth challenges. Also be ready to accommodate new business requirements that develop during the migration. Take advantage of the long duration to have existing your operational teams learn new services from the partner leading the deployment so your teams are ready to take over post-migration.
- Experienced partner: An EDW migration can be a major undertaking with challenges and risks during migration, but offers tremendous opportunities to reduce costs, simplify operations and offer dramatically improved capacities to internal and external EDW users. Selecting the right partner reduces the technical and financial risks, and allows you to plan for and possibly start leveraging these long-term benefits early in the migration process.
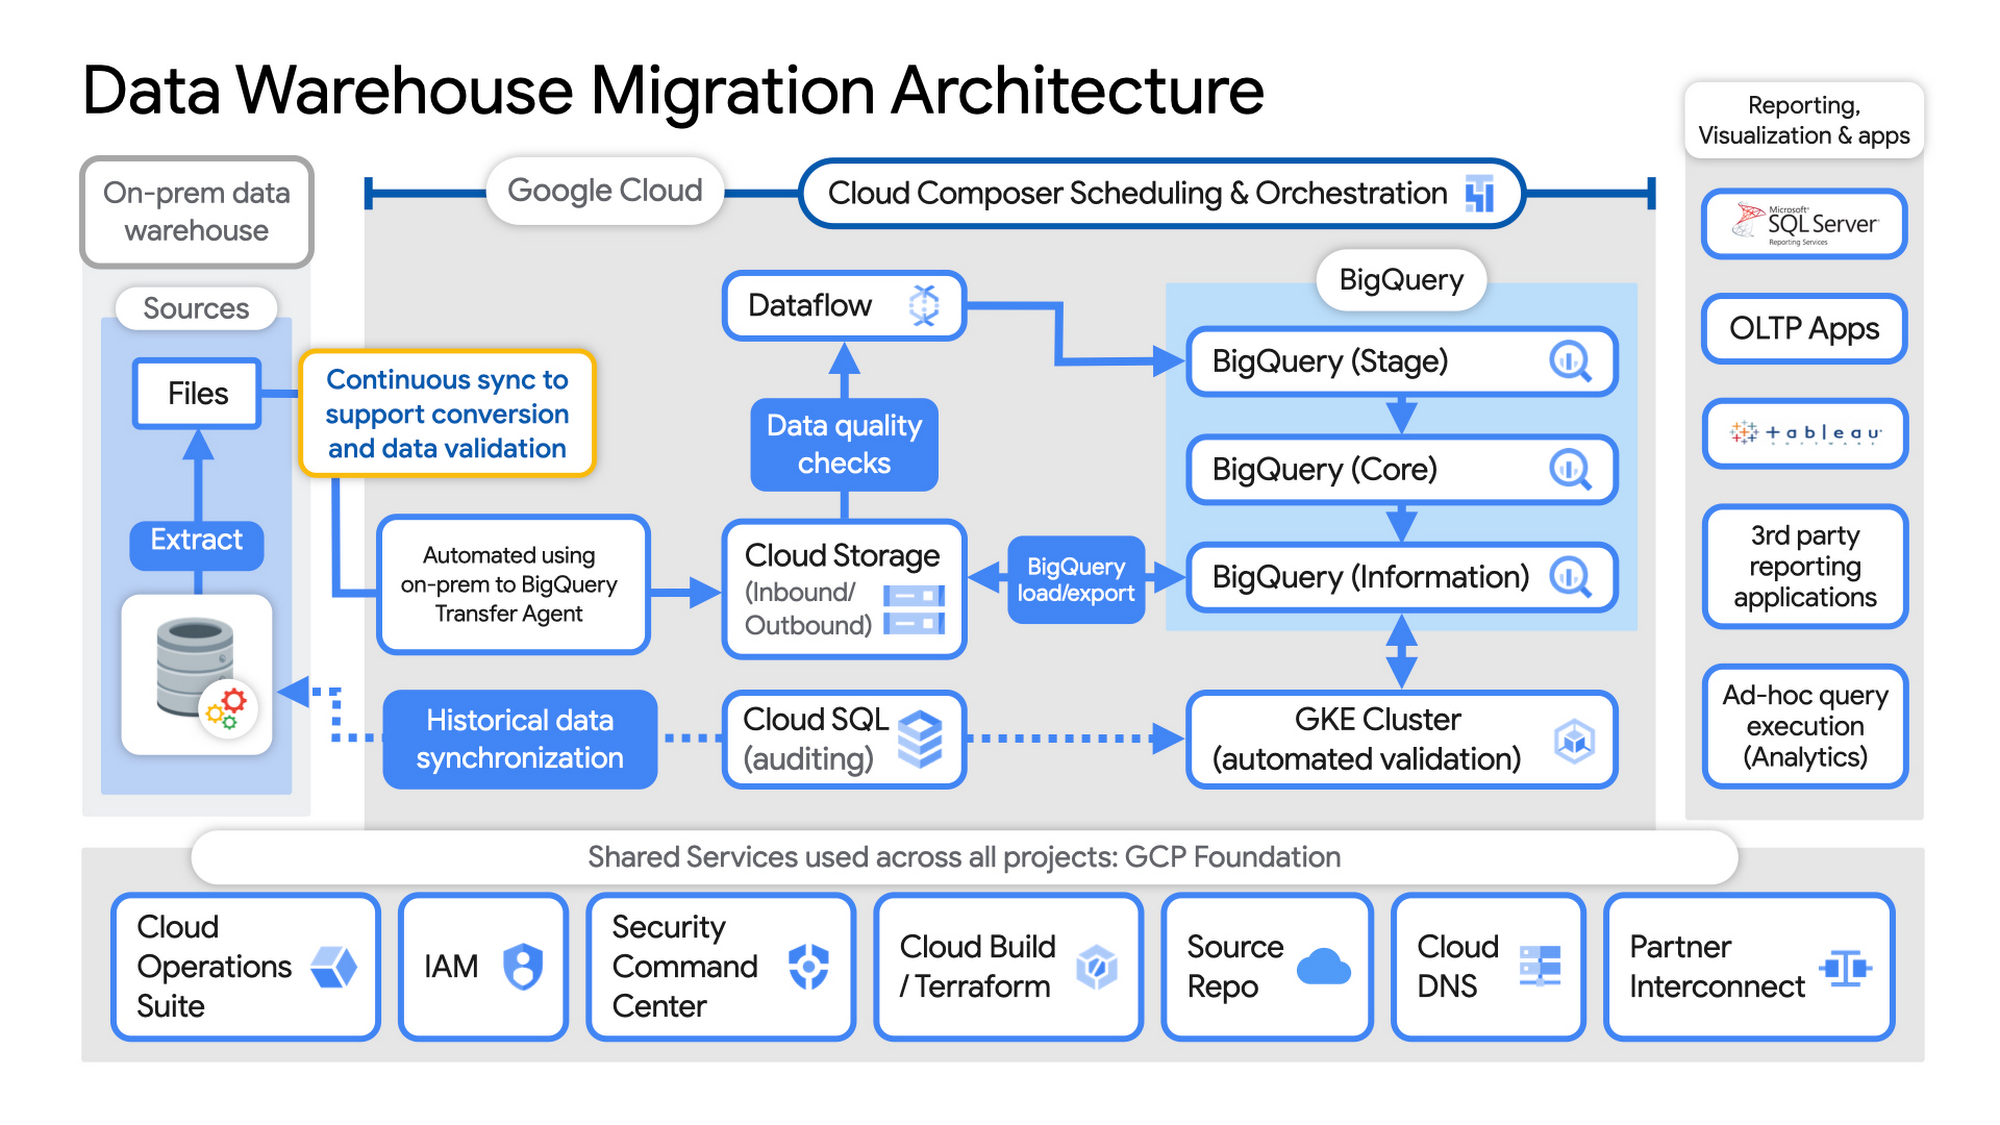
Example Data Warehouse Migration Architecture
- Setup foundational elements. In GCP these include, IAM for authorization and access, cloud resource hierarchy, billing, networking, code pipelines, Infrastructure as Code using Cloud Build with Terraform ( GCP Foundation Toolkit), Cloud DNS and a dedicated/partner Interconnect to connect to the current data centers.
- Activate monitoring and security scanning services before real user data is loaded using Cloud Operations for monitoring and logging and Security Command Center for security monitoring.
- Extract files from on-premise legacy EDW and move to Cloud Storage and establish on-going synchronization using Big Query Transfer services.
- From Cloud Storage, process the data in Dataflow and Load/Export data to BigQuery.
- Validate the export using Datametica’s validation utilities running in a GKE cluster and Cloud SQL for auditing and historical data synchronization as needed. Application teams test against the validated data sets throughout the migration process.
- Orchestrate the entire pipeline using Cloud Composer, integrated with on-prem scheduling services as needed to leverage established processes and keep legacy and new systems in sync.
- Maintain close coordination with teams/services ingesting new data into the EDW and down-streams analytics teams relying on the EDW data for on-going advanced analytics.
- Establish fine-grained access controls to data sets and start making the data in Big Query available to existing reporting, visualization and application consumption tools using BigQuery data connectors for ‘down-stream’ user access and testing.
- Incrementally increase Big Query flat-rate processing capacity to provide the most cost-effective utilization of resources during migration.
To learn more about migrating from on-premises Enterprise Data Warehouses (EDW) to Bigquery and GCP here.
Google Cloud’s Firebase Realtime Database and BigQuery AllowsCastbox to Ramp Up Customer Experience

8151
Of your peers have already read this article.
3:30 Minutes
The most insightful time you'll spend today!
Demand for spoken audio content such as podcasts remains robust despite the proliferation of video services and other entertainment options for consumers. Shibin Li, Co-founder of Castbox, credits growth of the global podcast platform to the following: speed and availability, market-leading features, the proliferation of smart devices to deliver audio content, and activities — such as driving and working around the house — that make consuming video difficult.
Founded in 2016 and headquartered in Beijing, China, Castbox enables users to locate, access, and create spoken audio content. Available on iOS and Android, Castbox supports 50 million podcasts, on-demand radio programs, and audiobooks in 70 languages from 175 countries. The platform hosts about 2 million users per day and is the largest podcast platform on Android.
Castbox includes a range of features that build on its core service to provide a high-quality user experience. These features include curated podcast recommendations and in-audio search.
A combination of services
At its inception, Castbox relied on a combination of a multinational cloud services, as well as Google Cloud Platform (GCP) services, including the Google BigQuery analytics data warehouse and Cloud APIs to provide programmatic interfaces with Google Cloud services, and a range of services from the Google mobile development platform Firebase.
However, as Castbox matured and its user base expanded, the business increased its reliance on Google Cloud Platform and Firebase.
“We needed to access stable cloud services as we could not tolerate long periods of downtime that would compromise the user experience,” says Li. “Furthermore, we had to support up to 50,000 concurrent connections, and potentially more in future, without disruption.”
“Based on our analysis of the data in Google BigQuery, we can determine what type of content users are listening to, how long they like to listen to it, and when they like to listen to it. This allows us to recommend similar podcasts to each user based on the preferences he or she expressed, encouraging activity on and return visits to our platform.”
—Shibin Li, Co-Founder, Castbox
Competitive differentiation
Castbox also found machine learning-powered Google Cloud Platform APIs could help deliver features, such as in-audio search, that differentiate the podcast platform from its competitors. In addition, Firebase SDKs and Firebase A/B Testing would enable Castbox to create and analyze new applications, as well as make adjustments based on user feedback. Firebase Realtime Database would allow the business to support tens of thousands of concurrent user connections.
The diligence of the Google Cloud team in advising Li and her team about forthcoming products and services also swayed Castbox towards Google technologies. The business gained the opportunity with Google to join several programs that offered early access to Google innovations.
Signature in-audio search service
Castbox now uses Google Cloud Platform services in the Tokyo, Japan, and U.S. East regions. Cloud Speech-to-Text API plays a key role in delivering Castbox’s signature in-audio search service. This service enables users to search transcriptions of audio content on the platform for words or phrases. The search results incorporate the title of the podcast and the search term in context (for example, within the sentence or sentence excerpt in which it appears). Each use of the word or phrase is time-stamped so it can easily be found. The API enables Castbox developers to apply neural network algorithms to achieve audio-to-text conversion accuracy rates of greater than 96%, while search queries typically experience latency of just 50 milliseconds.
In addition, the latency of comparison data, converting audio to text, is only about 250 milliseconds, contributing to the processing of about 12 minutes worth of audio to text in just 10 minutes. “We can process about 20 hours of audio files in one day,” Li says. “This enables us to transcribe and index all the new episodes of a podcast in that period.”
50,000 concurrent connections
With Firebase Realtime Database, Castbox now supports up to 50,000 concurrent connections to its platform with an average latency per connection of just 10 milliseconds. “Firebase Realtime Database also allows us to continue operating in offline mode, which is extremely helpful if we experience any network disruptions,” Li explains. “When we come back online again, any data is simply synchronized with the database.”
Google BigQuery and the analytics capabilities of Firebase SDKs also enable Castbox to monitor and analyze user behaviors. “Based on our analysis of the data in Google BigQuery, we can determine what type of content users are listening to, how long they like to listen to it, and when they like to listen to it,” Li explains. “This allows us to recommend similar podcasts to each user based on the preferences he or she expressed, encouraging activity on and return visits to our platform.”
“Given our queries may span up to 40 days of data, we may be analyzing up to 1,200 GB at one time. We have no problem doing this with Google BigQuery.”
—Shibin Li, Co-Founder, Castbox
Castbox also uses its analyses of Google BigQuery data to amend banners and summaries on its platform to encourage users to listen to additional content. Furthermore, the service is prepared to make surprise recommendations of content to users based on the preferences and reactions of users with similar tastes.
“We analyze a pool of data growing at up to 30 GB per day,” Li explains. “Given our queries may span up to 40 days of data, we may be analyzing up to 1,200 GB at one time. We have no problem doing this with Google BigQuery.” These analyses also support Castbox’s decision to start creating original content, such as finance and economic news, for its platform.
Checking weekly changes
Castbox does not rely only on analyzing user data to deliver a high-quality experience. The business aggregates user feedback from emails and Google Play reviews to make weekly changes to its platform. It then uses Firebase A/B Testing to check whether these changes are met with a positive user response.
“We are extremely pleased with Google Cloud Platform and Firebase. We have been able to differentiate ourselves from our competitors and provide an attractive option for users at a time when content and entertainment options are exploding. We have a great opportunity with Google to continue to improve the value of our offering to users and build engagement and loyalty.”
—Shibin Li, Co-Founder, Castbox
Castbox’s positive experiences with Google Cloud Platform are encouraging the business to grow its use of the product. “We are trying to move some more services to Google Cloud Platform because it is very stable and scalable,” Li says. The business is keen to explore the capabilities of Cloud Pub/Sub to provide low latency messaging between applications, Cloud Spanner to deliver a distributed relational database service, and Cloud Dataflow to transform and enrich data in stream and batch modes.
“We are extremely pleased with Google Cloud Platform and Firebase,” Li concludes. “We have been able to differentiate ourselves from our competitors and provide an attractive option for users at a time when content and entertainment options are exploding. We have a great opportunity with Google to continue to improve the value of our offering to users and build engagement and loyalty.”
BigQuery Omni: Your Solution for Multi-Cloud Geospatial Analytics

1497
Of your peers have already read this article.
6:30 Minutes
The most insightful time you'll spend today!
As we become increasingly reliant on technology to make decisions, geospatial data is becoming more critical than ever. It is a powerful resource that can be used to solve a variety of problems, from tracking the movement of goods, identifying interest areas and potential areas of disaster.
Geospatial data incorporates data with a geographic component, such as latitude and longitude coordinates, addresses, postal codes, or place names, and can be obtained from a variety of sources, including satellites, sensors, and surveys, making it an incredibly powerful tool with a broad range of applications.
One of the key features of BigQuery, Google Cloud’s serverless enterprise data warehouse, is its ability to analyze geospatial data. However, oftentimes geospatial data sits in a variety of public clouds, not just Google Cloud. To access it effectively, you need a multi-cloud analytics solution that lets you capitalize on the distinct capabilities of each cloud platform, while extracting insights and value from data sitting across multiple cloud platforms.
BigQuery Omni is a multi-cloud analytics solution that enables the analysis of data stored across public cloud environments, including Google Cloud, Amazon Web Services (AWS) and Microsoft Azure, without the need to transfer the data. With BigQuery Omni, users can employ the same SQL queries and tools used to analyze data in Google Cloud to analyze data in other clouds, making it easier to gain insights from all data, regardless of the storage location. For businesses using multiple clouds, BigQuery Omni is an excellent tool to unify analytics and optimize the value of data.
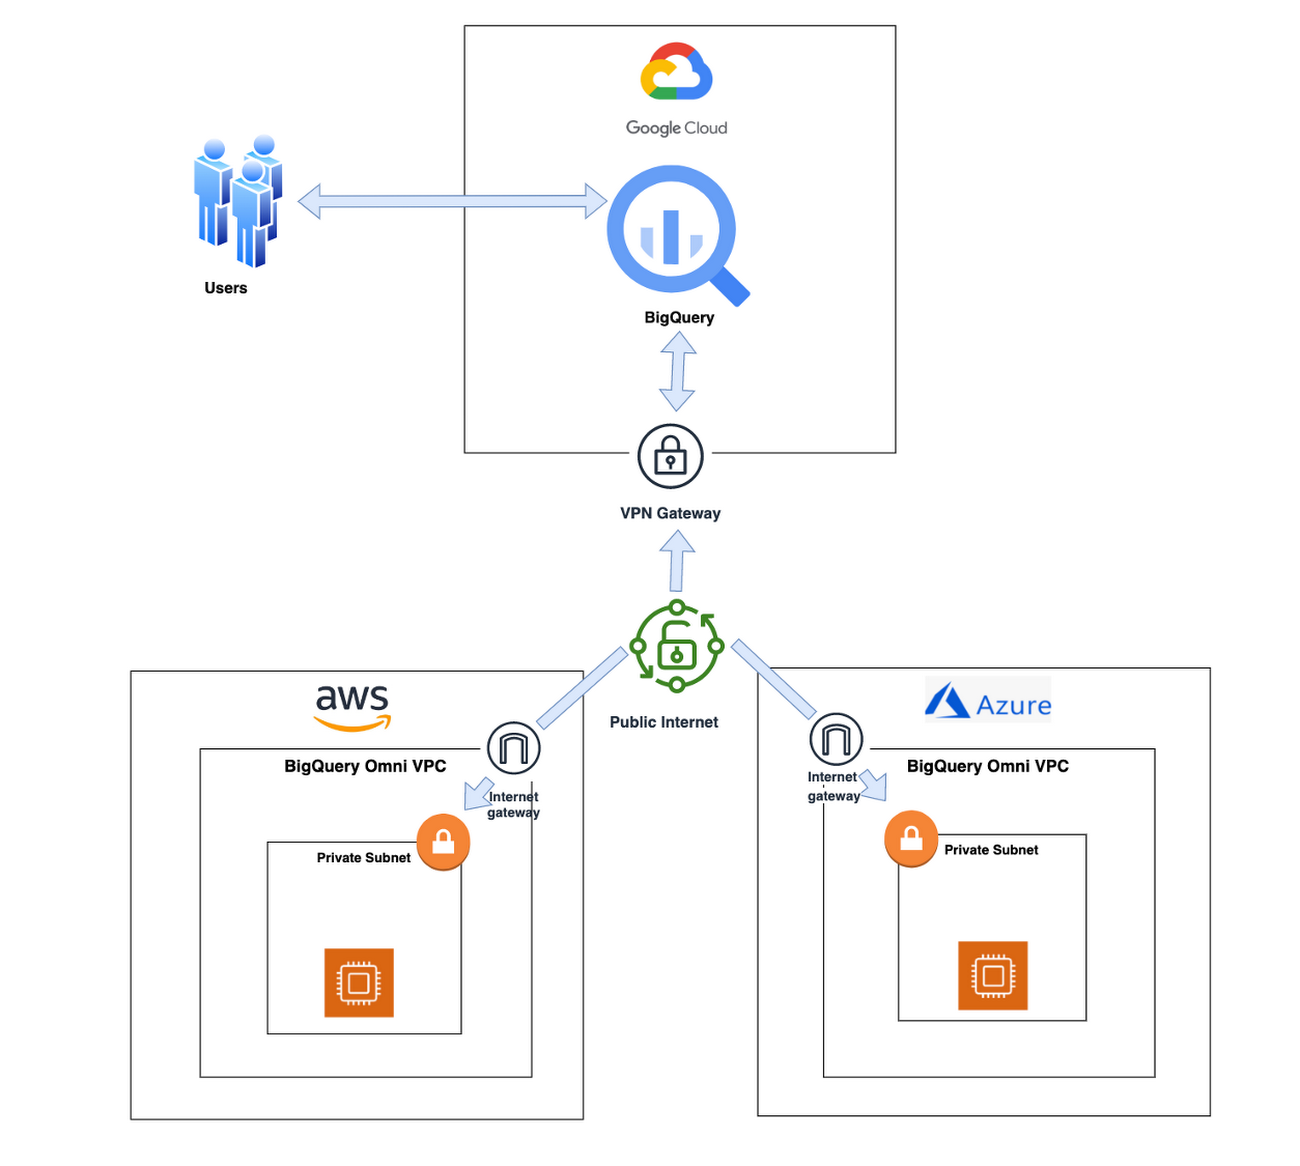
With BigQuery Omni, organizations can analyze location-based information or geographic components, such as latitude and longitude coordinates, addresses, postal codes, or place names without even copying their data to Google Cloud. For example, you could use BigQuery Omni to analyze data from a fleet of delivery vehicles to track their location and identify potential problems.
BigQuery Omni and geospatial data analysis
If you are working with geospatial data, BigQuery Omni is a powerful tool that can help you to get insights from your data. It is scalable, reliable, and secure, making it a great option for unifying your analytics and getting the most out of your data.
Here are a few examples of ways organizations might use BigQuery Omni for geospatial data:
- A transportation company could use BigQuery Omni to analyze data from GPS sensors in its vehicles to track the movement of its fleet and identify potential problems.
- A retail company could use BigQuery Omni to analyze data from its point-of-sale systems to track customer behavior and identify trends.
- A government agency could use BigQuery Omni to analyze data from its weather sensors to track the movement of storms and identify areas at risk of flooding.
BigQuery Omni and geospatial data can be used together to gain insights into a variety of business problems. Specifically, some of the advantages of using BigQuery Omni and geospatial data include:
- Access to quality geospatial data: BigQuery supports loading of newline-delimited GeoJSON files and provides built-in support for loading and querying geospatial data. Data from public data sources like BigQuery public datasets, the Earth Engine catalog, and the United States Geological Survey (USGS) can be easily integrated into your BigQuery environment. Earth Engine has an integrated data catalog with a comprehensive collection of analysis-ready datasets, including satellite imagery and climate data. This data can be combined with proprietary data sources such as SAP, Oracle, Esri ArcGIS Server, Carto, and QGIS.
- Loading and preprocessing of geospatial data: BigQuery has built-in support for loading and querying geospatial data types, and you can use partner solutions such as FME Spatial ETL to load data.
- Working with different geospatial data types and formats: BigQuery supports a variety of file types and formats including WKT, WKB, CSV and GeoJSON.
- Coordinate reference systems: BigQuery’s geography data type is globally consistent. That means that your data is registered to the WGS84 reference system and your analyses can span a city block or multiple continents.
Overall, geospatial analytics with BigQuery Omni provides a wide range of technical capabilities for processing and analyzing geospatial data, making it a powerful tool for businesses that need to work with location-based data.
Analyzing geospatial data with BigQuery Omni
Imagine a retailer who has a large chain of department stores with locations all over the country. They are looking to expand their business and want to identify areas with high sales potential. They want a way to get a better understanding of their sales volume within specific geographic boundaries. To achieve this goal, the retailer turns to the GIS (Geographic Information System) functions built into BigQuery. Here are the steps what the retailer takes to analyze this dataset:
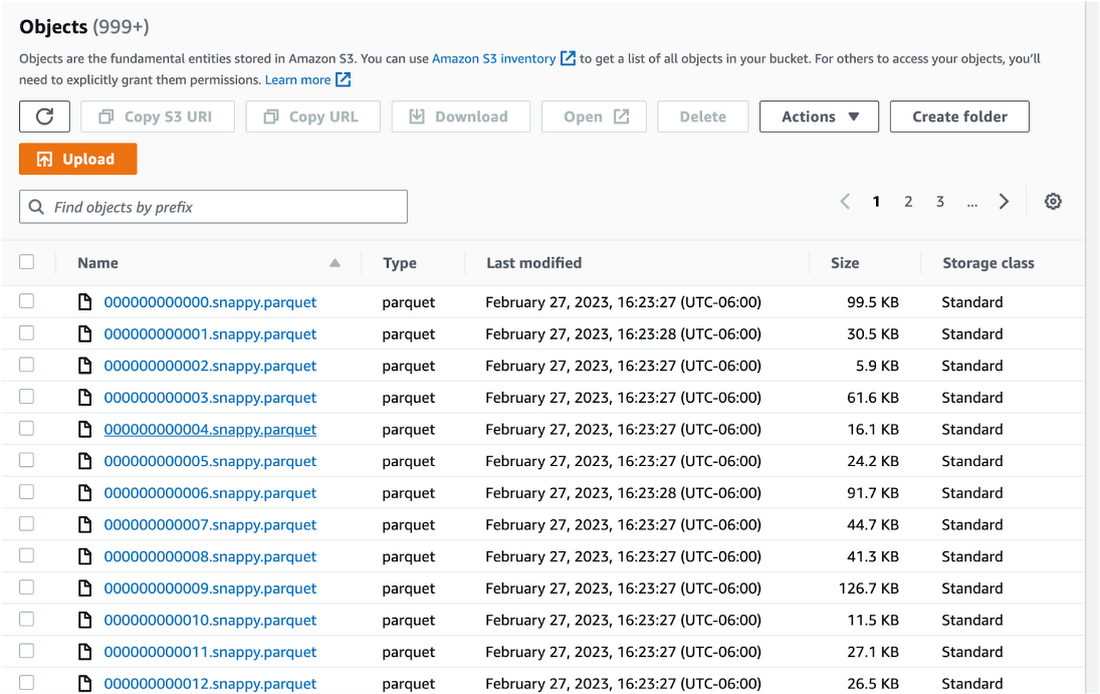
Step 1 : An initial orders dataset on AWS S3 contains 5.54 million rows, and with separate locations (300 rows) and zipcode (33144 rows) metadata files on AWS S3.
Orders Parquet files:
Location and Zipcode files:

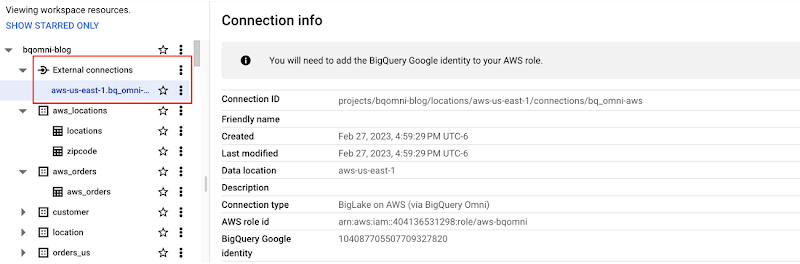
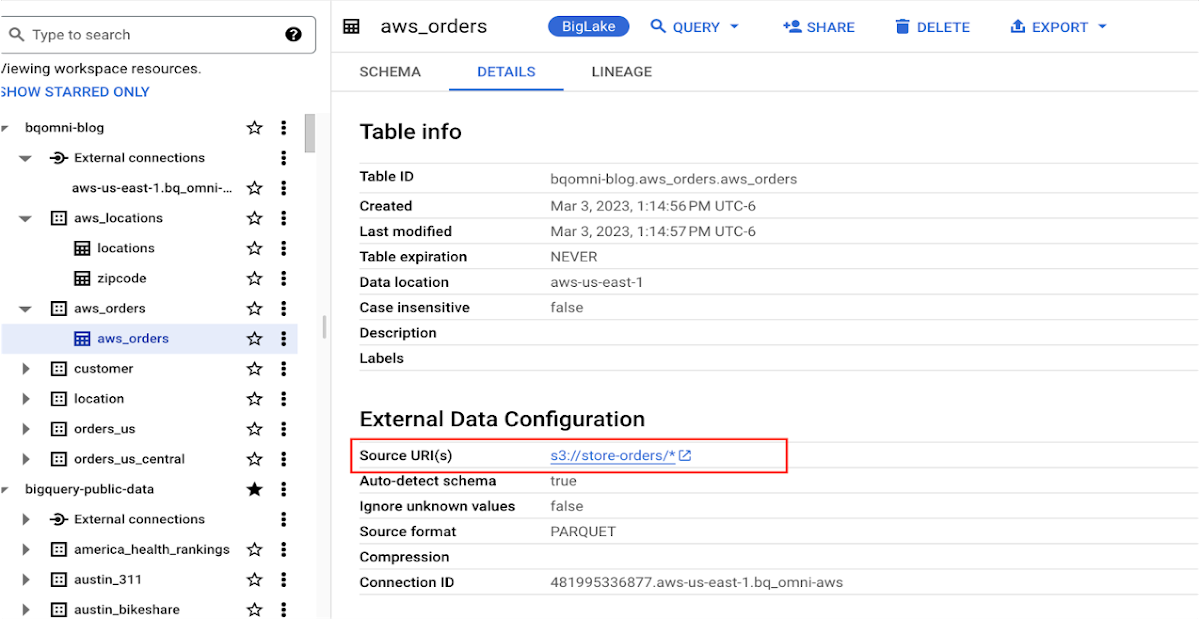
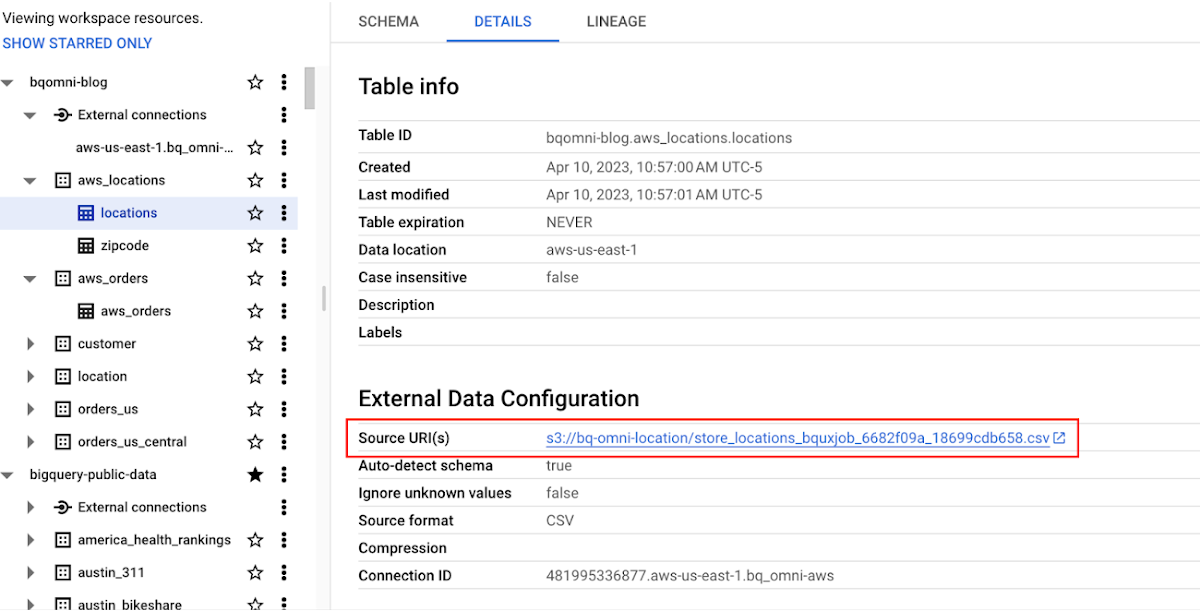
Step 2 : The retailer uses BigQuery Omni to establish a connection between the data stored in AWS and BigQuery, enabling them to access the S3 datasets externally.
External Connection for AWS
External Table for orders
External Table for locations
External Table for zipcode
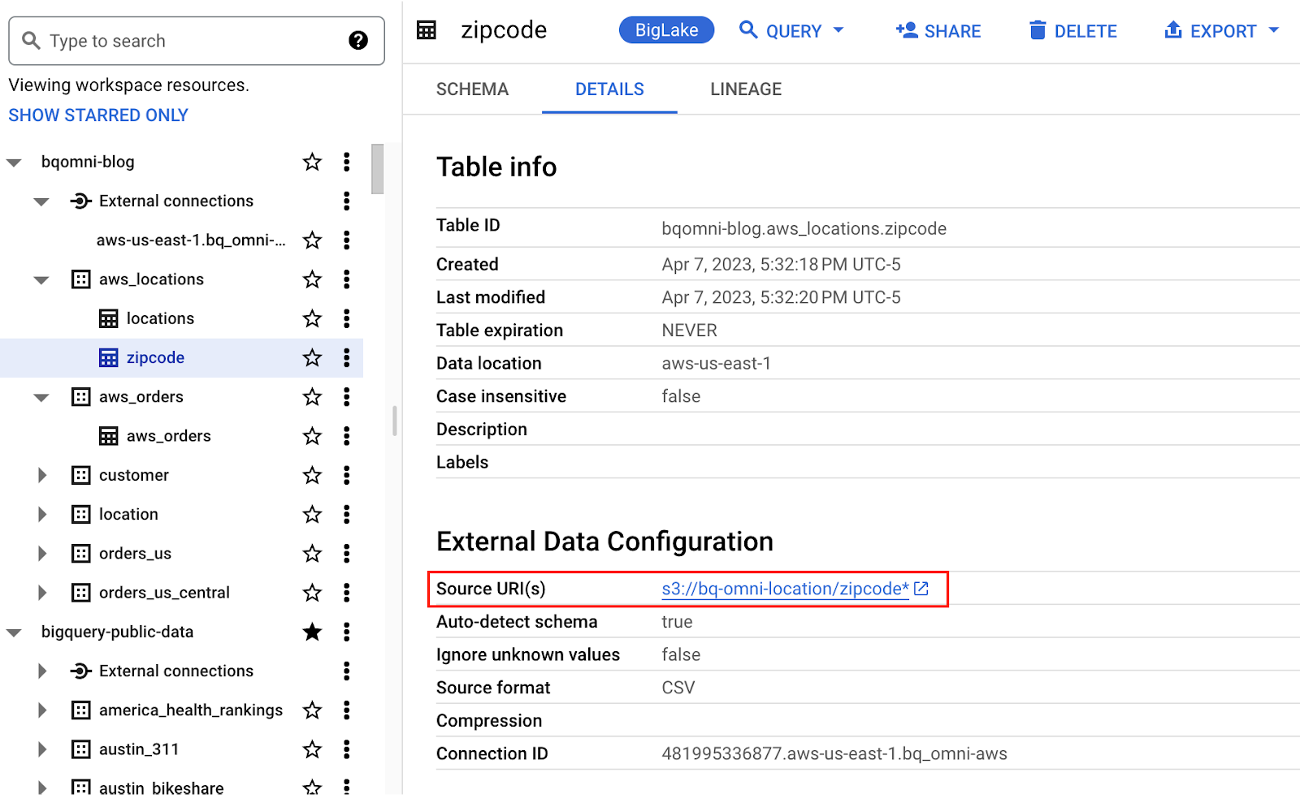
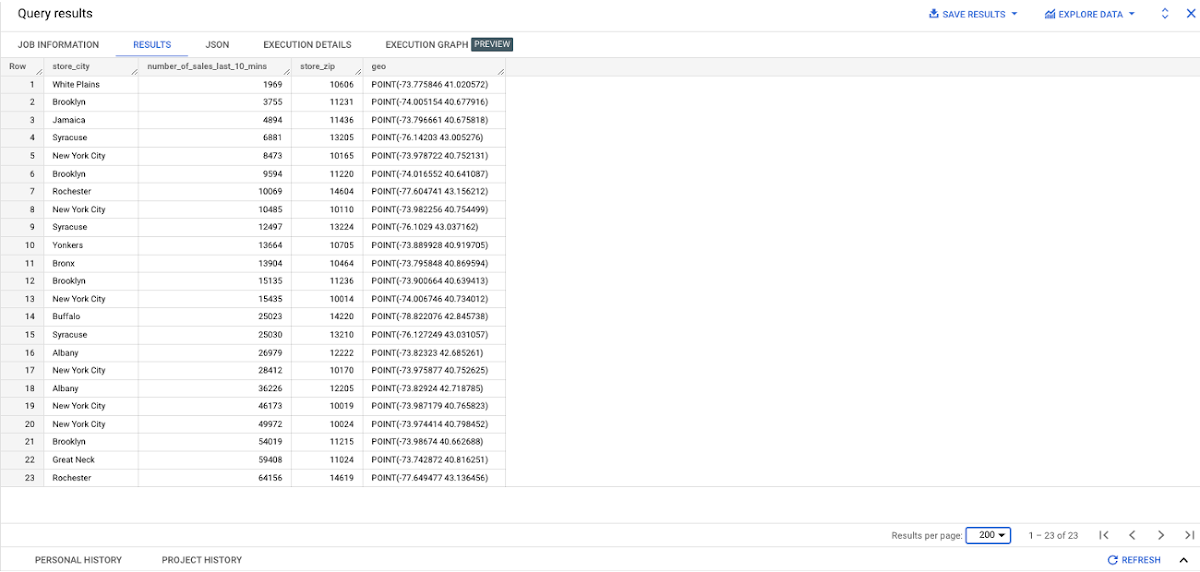
Step 3 : They combine the orders and locations datasets using BigQuery Omni, and remotely aggregate the data on AWS. Joining this dataset with geospatial datasets helps them derive geospatial coordinates.
The final aggregated dataset is reduced to 23 rows. Subsequently, they bring back the result dataset, which contains just 23 rows. This helps them reduce the extraction of millions of rows to just 23 rows for their geospatial analytics.
Select sales.store_city store_city,
sales.number_of_sales_last_10_mins number_of_sales_last_10_mins,
sales.store_zip store_zip,
 ST_GeogPoint(zip_lat_lng.longitude ,
   zip_lat_lng.latitude  ) geo
FROM (
 SELECT
   FORMAT_DATETIME("%X",
     CURRENT_DATETIME("America/Los_Angeles")) current_time,
   MAX(DATETIME(time_of_sale,
       "America/Los_Angeles")) time_of_last_sale,
   COUNT(1) number_of_sales_last_10_mins,
   locations.city store_city,
   locations.zip store_zip
 FROM
   `bqomni-blog.aws_locations.orders_small`  sales
 JOIN
   `bqomni-blog.aws_locations.locations` locations
 ON
   sales.store_id = locations.id
 GROUP BY
   locations.city,
   locations.zip ) sales
JOIN
   `bqomni-blog.aws_locations.zipcode` zip_lat_lng
ON
 cast(sales.store_zip as INT) = cast(zip_lat_lng.zipcode as INT)
 WHERE ST_WITHIN( ST_GeogPoint(zip_lat_lng.longitude , zip_lat_lng.latitude  ) ,ST_GeogFromText(zip_lat_lng.zipcode_geom ) )
 AND zip_lat_lng.state_name  = "New York"
 ORDER BY number_of_sales_last_10_mins
Aggregated Sales data by region
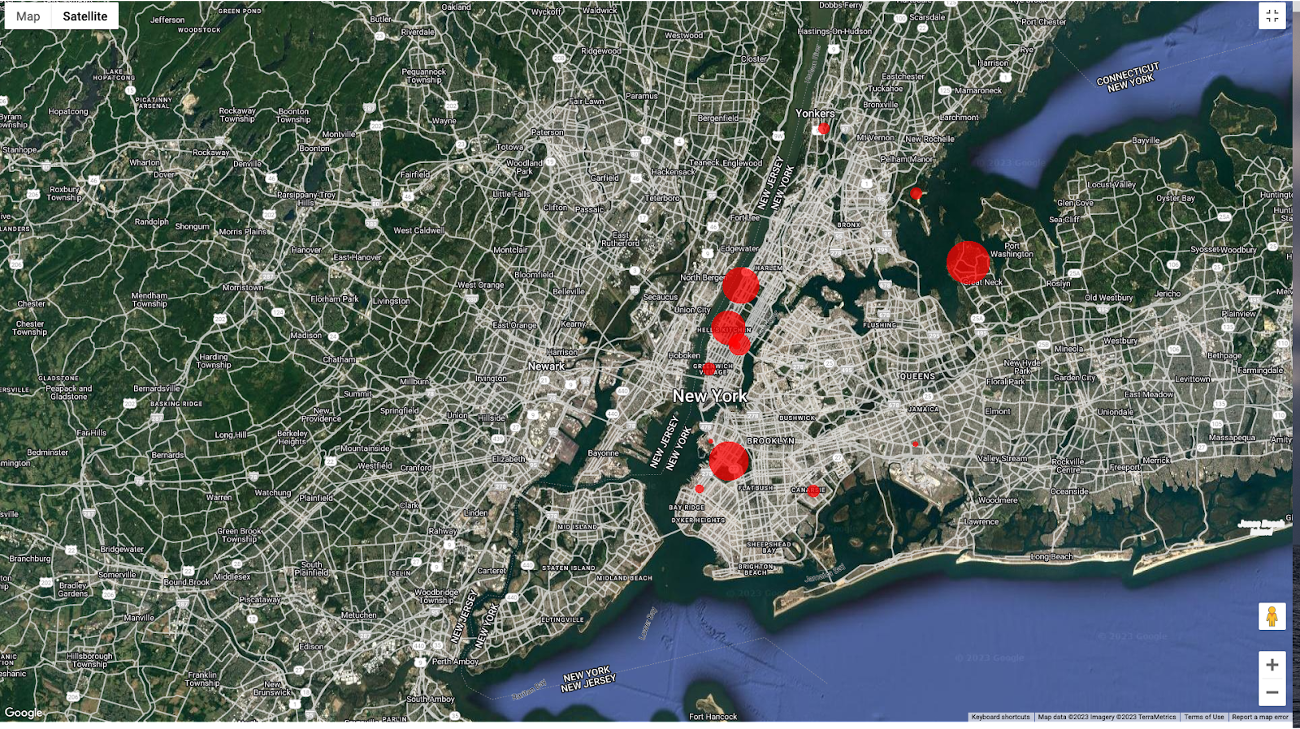
To build richer views of their sales volume data, the retailer uses BigQuery GeoViz integration, a powerful tool that allows for visualizing geographic data on maps.BigQuery Geo Viz is a web tool for visualization of geospatial data in BigQuery using Google Maps APIs. You can run a SQL query and display the results on an interactive map
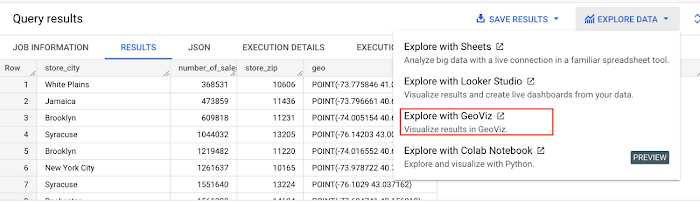
BigQuery Geo view for sales data analysis
With the geo-tagged data in place, the retailer can now see regional sales volume, sales density, distribution by department by time, and distribution within department, all powered through BigQuery.
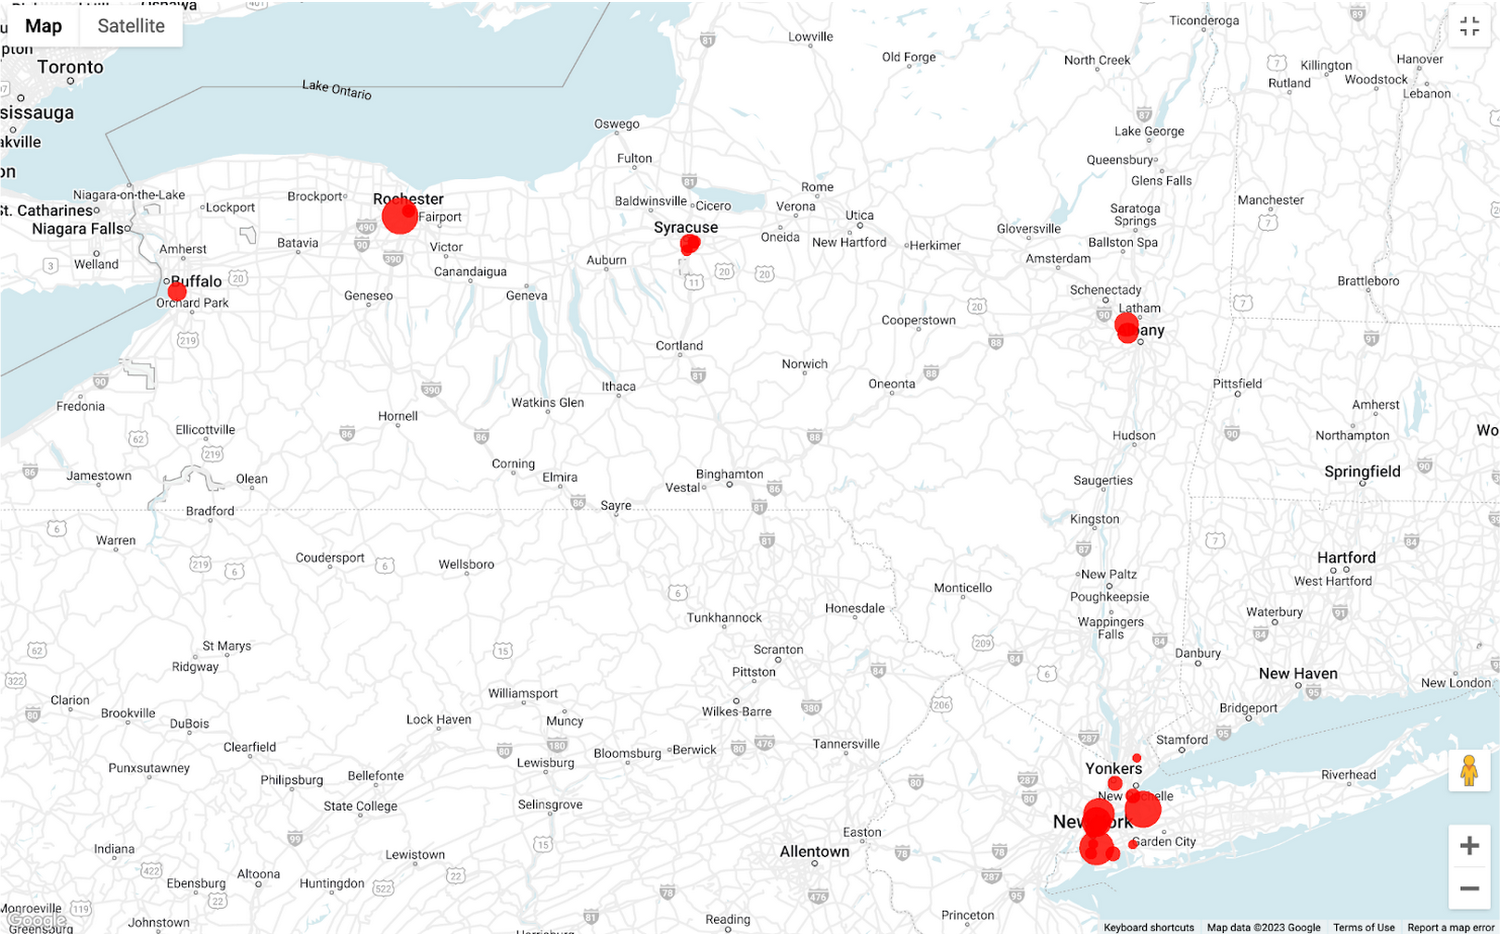
Satellite view
Benefits of using BigQuery Omni
Beyond geospatial analysis, BigQuery Omni offers a number of benefits, including:
Reduced costs: BigQuery Omni’s ability to eliminate data transfers between clouds can help organizations reduce costs and simplify data management, making it a valuable tool for multi-cloud analytics. Also, the ability to access and analyze data across multiple clouds can reduce the need for data replication and synchronization, which can further simplify the ETL process and improve data consistency.
Unified governance: BigQuery Omni uses the same security controls as BigQuery, which include features such as encryption, access controls, and audit logs, to help protect data from unauthorized access.
Single pane for analytics: BigQuery Omni provides a single interface for querying data across all three clouds, which can simplify the process of analyzing data and reduce the need for organizations to use multiple analytics tools.
Flexibility: Analyze data stored in any of the supported cloud storage services, giving organizations the flexibility to work with the data they have regardless of where it’s located.
BigQuery Omni is a valuable tool for geospatial analysis because it allows you to analyze data from multiple sources without having to move the data. This can save you time and money, and it can also help you to get more accurate insights from your data.If you are looking for a way to improve the accuracy, efficiency, and decision-making of your business, using BigQuery Omni to analyze geospatial data can be a powerful tool.
References
- Omni-introduction
- Omni-benefits
- Omni-aws-create-connection
- Omni-azure-create-connection
- BigQuery Omni Retail Demo on Looker
- Omni-pricing
- Working with Geospatial Data
- Geospatial Analytics – Intro
Learn more about how BigQuery Omni can help your organization.
ActivStat: Enhancing Live Sports Broadcast with Real-time Stats and Metrics

5092
Of your peers have already read this article.
2:00 Minutes
The most insightful time you'll spend today!
Millions of people annually view esports, as top players and teams compete in thrilling, fast-paced tests of reflexes, strategy, and teamwork. Fans are a diverse group, sharing a passion for action. A new, revolutionary project we’re working on with Call of Duty League just made that action a lot better.
ActivStat brings fans, players, and commentators the power of competitive statistics in real-time—stats that matter not only to the game at hand, but also for a full roster of competitors globally. Using ActivStat, live broadcasts will soon be enhanced with more depth and color-of-play while they’re happening, building excitement and adding to the overall experience.
Technically, ActivStat is an entirely new capability for esports. It’s a constantly updating catalog of statistics that is sourced, analyzed, updated, and delivered in an easy-to-consume way across global-scale computing systems, with a latency of milliseconds or seconds, rather than minutes or hours. By comparison, many of these stats today are available to fans after a day or more of processing.
Call of Duty League plans to begin rolling out ActivStat during the 2021 season. The initial rollout will include critical information like player and team standings and winning ratios across multiple aspects of virtual combat—including ultimately what these numbers mean for rankings. ActivStats are delivered both in raw statistics and via visualizations and graphics, providing commentators with fast access to the types of insights fans crave.
For engineers at both companies, building the service has been an epic success all its own. Due to a sponsorship with Call of Duty signed last February, our dedicated game engineering team quickly innovated a new solution incorporating high-speed networking, data pipelines from multiple cloud sources, and data warehousing to create a user-friendly dashboard. Real data was flowing into commentator dashboards by April.
Esports are more complex to cover in many ways than regular sports. Instead of a well-defined physical playing field (often a simple rectangular space), multiplayer games involve complex and sprawling virtual environments that can be the size of a large campus or airport with multiple levels and hidden locations.
Gameplay between competitors happens across many of these locations simultaneously. In addition, competitors also each choose their own configurations of equipment, known as “loadouts,” which can dramatically affect gameplay and strategy. All of this additional complexity in online gaming involves data that needs to be captured, analyzed, and communicated to the fans in insightful ways.
Two Google Cloud technology capabilities play central roles in the operations of ActivStat. BigQuery—a planet-scale data warehouse that can store and query petabytes of information in real time—is the foundation of the ActivStat platform for gathering and summarizing millisecond-level statistics. Looker, an intuitive analytic dashboard, surfaces those insights to commentators in an easy-to-use, real-time dashboard that enables the commentators to speak to compelling insights and statistics in sync with the gameplay as it is happening in the live broadcast.
While the initial release of ActivStat for this season of Call of Duty League provides compelling and powerful capabilities, it’s only the beginning of this Call of Duty League-Google Cloud co-innovation partnership. Our future vision is mapping gameplay hotspots on the field, and predicting where to place cameras with machine learning as the match evolves–enabling broadcast producers to build excitement for fans by always being in the middle of the best action. Call of Duty League and Google will also look to drive statistics and metrics directly into the broadcast feed.
The implications of the real-time statistical capabilities of ActivStat go beyond gaming and esports. Historically, gaming has been at the leading edge of what computer processing, computer graphics, wide-area networking, data analysis, and insight can do. The real-time data ingestion and output used in ActivStat could one day be useful powering live broadcasts in other types of sporting events, as well as blending live video feeds and data to support use cases in media & entertainment, healthcare, finance, manufacturing, and other verticals. We’re excited about the potential for this bold new solution and partnership between Call of Duty League and Google in esports and beyond.
To learn more about Call of Duty League-Google Cloud partnership, visit our press release.
How Connected-Stories Uses BigQuery and AI/ML to Craft Personalized Ad Experiences

4005
Of your peers have already read this article.
4:00 Minutes
The most insightful time you'll spend today!
Editor’s note: The post is part of a series highlighting our awesome partners, and their solutions, that are Built with BigQuery
In the field of producing engaging video content such as ads, many marketers ignore the power of data to improve their creative efforts to meet the consumers’ need for personalized messages. The demand for creative tech to efficiently personalize is real as marketers need personalized video Ads to reach their audience with the right message at the right time. Data, Insights and Technology are the main ingredients to deliver this value while ensuring security and privacy requirements are met. The Connected-Stories team partnered with Google Cloud to build a platform for Ad personalization. Google Data Cloud and BigQuery are at the forefront to assimilate data, leverage ML models, create personalized ads, and capitalize on real-time intelligence as the core features of the Connected-Stories NEXT platform.
Connected-Stories NEXT is an end-to-end creative management platform to develop, serve, and optimize interactive video and display ads that scale across any channel. The platform ingests first-party data to create custom ML models, measure numerous third-party data points to help brands develop unique customer journeys and create videos that their data signals can drive. An intelligent feedback loop passes real-time data back, enabling brands to make data-driven and actionable video ads that take the brand’s campaigns to the next level.
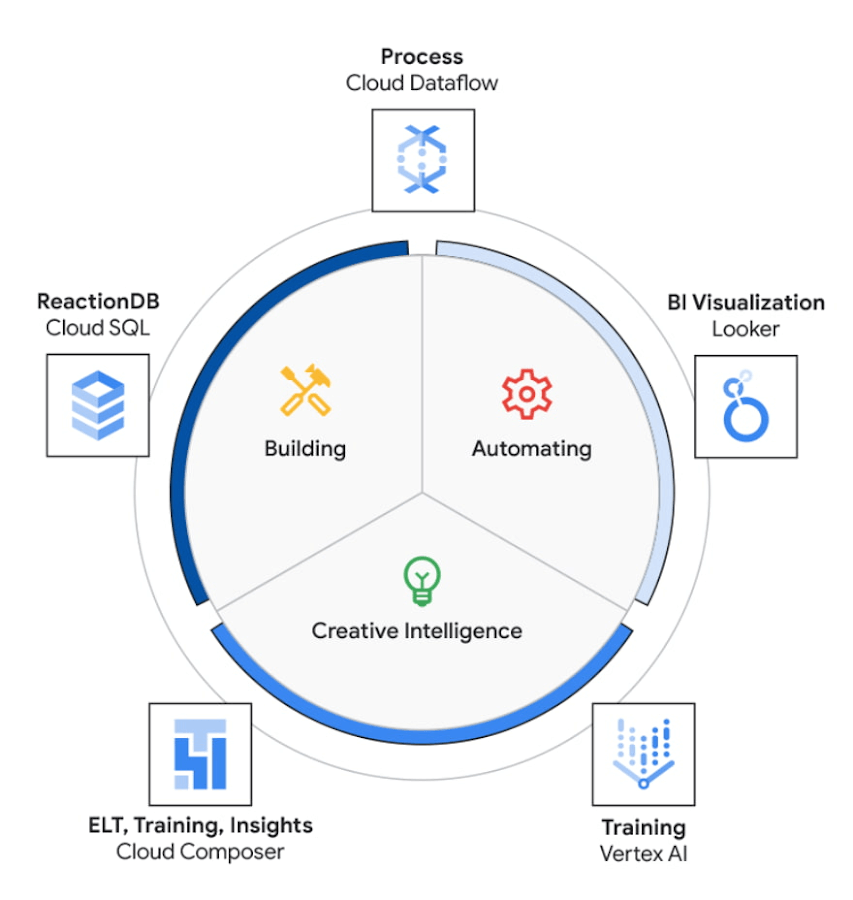
The core use case of the NEXT platform revolves around collecting user’s interaction data and optimizing for precision and speed to create an actionable Ad experience that is personalized for each user. The platform processes complex data points to create interactive data visualizations that allow for accurate analysis. The platform uses Vertex AI to access managed tools, workflows, and infrastructure to build, deploy, and scale ML models that have improved the accuracy to identify segments for further analysis.
The platform ingests 200M data events with peaks and valleys of activity. These events are processed to generate dashboards that enable users to visualize metrics based on filters in real-time. These dashboards have high performance requirements in terms of a responsive user interface under constantly changing data dimensions.
Google Cloud’s serverless stack coupled with limitless data cloud infrastructure has been the core to the NEXT platform’s data-driven innovation. The growing volume of data ingested, streamed and processed were scaled uniformly across the compute, storage and analytical layers of solution. A lean development team at Connected-Stories were able to focus all-in on the solution, while the serverless stack scaled, lowered attack service in terms of security and optimized the cost footprint through pay-as-you-go features.
BigQuery has been the backbone to support the vast amounts of data spreading over multiple geos resulting in workloads running at petabyte scale. BigQuery’s fully managed serverless architecture, real-time streaming, built-in machine learning and rich business intelligence capabilities distinguishes itself from a cloud data warehouse. It is the foundation needed to approach data and serve users in an unlimited number of ways. For an application with zero tolerance for failure, given its fully managed nature, BigQuery handles replication, recovery, data distributed optimization and management.
The platform’s requirements include the need for low maintenance, constantly ingesting and refreshing data and smart-tuning of aggregated data. These capabilities can be implemented by BigQuery’s materialized views feature. Materialized views are useful for precomputed views that regularly cache query results for better performance. These views possess the innate feature to read only the delta change from base tables and calculate the up-to-date aggregations. Materialized views impart faster outputs and consume fewer resources while reducing the cost footprint.
Some key considerations in using Google cloud and focusing on the Serverless stack include: quick onboarding to development, prototyping in short sprints and ease of preparing data in a rapidly changing environment. Typical considerations around low code / no code include data transformation, aggregation and reduced deployment time. These considerations are fulfilled through using serverless capabilities within Google Cloud such as PubSub, Cloud Storage, Cloud Run, Cloud Composer, Dataflow and BigQuery as described in the Architecture diagram below. The use of each of these components and services are described below.
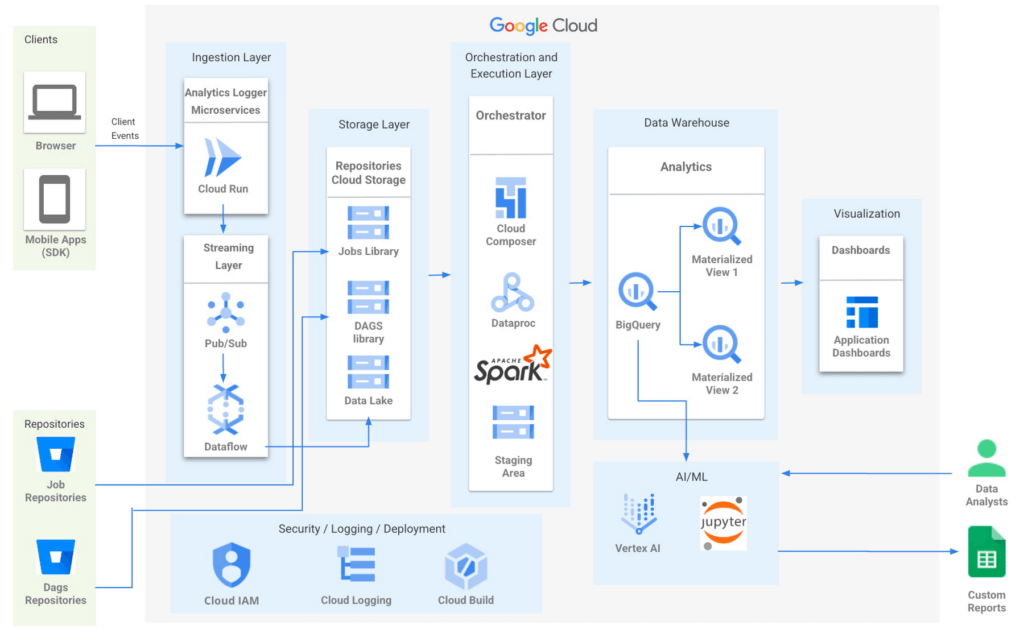
- Input/Ingest: At a high-level, microservices hosted in Cloud Run collect and aggregate incoming Ads events.
- Enrichment: The output of this stage is a Pub-Sub message enriched with more attributes based on a pre-configured campaign.
- Store: a Cloud Dataflow streaming job to create text files in Cloud Storage buckets.
- Trigger: Cloud Composer triggers the spark jobs based on text files to process and group them to produce desired output as one record per impression, a logical group of events.
- Deploy: Cloud Build is then used to automate all deployments.
Thus far, all Google cloud managed services work together to ingest, store and trigger the orchestration, all of which are scalable based on configurations including autoscaling capabilities.
- Visualization: A visualization tool reads data from BigQuery to compute pre-aggregations required for each dashboard.
- Data Model Evolution considerations: Though the solution served the purpose of creating pre-aggregations, as the data model evolved by adding a column or creating a new table, it led to recreating pre-aggregations and querying the data again. Alternatively, creating aggregate tables as an extra output of current ETLs seemed like a viable option. However, this would increase the cost and complexity of jobs. A similar situation to reprocess or update aggregated tables would occur as data is updated.
Precomputed views of data that is periodically cached are critical to reach the audience with the right message at the right time.
- Performance: In order to increase the performance of the platform, we need to have regularly precomputed views of the data, cached .
- Materialized Views: Consumers of these views needed faster response times, to consume fewer resources and output only the changes in comparison to a base table. BigQuery Materialized views were used to solve this very requirement. Materialized views have been highly leveraged to optimize the design resulting in lesser maintenance and access to fresh data with high performance with a relatively low technical investment in creating and maintaining SQL code.
- Dashboards: Application dashboards pointing to the Materialized views are highly performant and provide a view into fresh data.
- Custom Reports with Vertex AI Notebooks: Vertex AI notebooks directly read data from BigQuery to produce custom reports for a subset of customers. Vertex AI has been hugely beneficial to data analysts, where an environment with pre-installed libraries simplifies the readiness to use. Vertex AI Workbench notebooks are used to share these reports within the team allowing them to work always on the cloud without having the need to download data at any time. Besides, it increases the velocity to develop and test ML models faster.
The NEXT platform has yielded benefits such as customers having the ability to create unique consumer journeys powered by AI / ML personalization triggers, using first-party data and business intelligence tools to capitalize on real-time creative intelligence, which is a dashboard to measure campaign performance for cross-functional teams to analyze the impact of Ad content experience at a granular level. All of these while ensuring controlled access to data to enrich data without moving across clouds. The NEXT platform can keep up with increased demands for agility, scalability and reliability through the underlying usage of Google Cloud.
Partnering with Google, in the context of the Google Built with BigQuery program has surfaced the differentiated value in areas of creating interactive personalized Ads by using real-time data. In addition, by sharing this data across organizations as assets, ML models have fueled higher levels of innovation. Connected-Stories plan to deepen the penetration into the entire spectrum of services offered in the AI/ML area to enhance core functionality and provide newer capabilities to the platform.
Click here to learn more about Connected-Stories NEXT Platform capabilities.
The Built with BigQuery Advantage for ISVs
Through Built with BigQuery, launched in April ‘22 as part of Google Data Cloud Summit, Google is helping tech companies like Connected-Stories co-innovate in building applications that leverage Google’s data cloud with simplified access to technology, helpful and dedicated engineering support, and joint go-to-market programs. Participating companies can:
- Get started fast with a Google-funded, pre-configured sandbox.
- Accelerate product design and architecture through access to designated technical experts from the ISV Center of Excellence who can share insights from key use cases, architectural patterns, and best practices encountered in the field.
- Amplify success with joint marketing programs to drive awareness, generate demand, and increase adoption.
The Google Data Cloud spectrum of products and specifically BigQuery give ISVs the advantage of a powerful, highly scalable data warehouse that’s integrated with Google Cloud’s open, secure, sustainable platform. And with a huge and expanding partner ecosystem and support for multi-cloud, open source tools and APIs, Google provides technology companies the portability and extensibility they need to avoid data lock-in and exercise choice.
We thank the Google Cloud and Connected-Stories team members who co-authored the blog: Connected-Stories: Luna Catini, Marketing Director, Google: Sujit Khasnis, Cloud Partner Engineering
DR for Cloud: Architecting Microsoft SQL Server with Google Cloud

3761
Of your peers have already read this article.
2:45 Minutes
The most insightful time you'll spend today!
Database disaster recovery (DR) planning is an important component of a bigger DR plan, and for enterprises using Microsoft SQL Server on Compute Engine, it often involves critical data.
When you’re architecting a disaster recovery solution with Microsoft SQL Server running on Google Cloud Platform (GCP), you have some decisions to make to build an effective, comprehensive plan.
Microsoft SQL Server includes a variety of disaster recovery strategies and features, such as Always On availability groups or Failover Cluster Instances.
And Google Cloud is designed from the start for resilience and availability. There are several types of data centers available within GCP where you can map SQL Server’s availability features based on your specific requirements: zones and regions. Zones are autonomous data centers co-located within a GCP region. These regions are available in different geographies such as North America or APAC.
However, there is no single disaster recovery strategy to map Microsoft SQL Server DR features to Google Cloud’s data center topology that satisfies every possible combination of disaster recovery requirements.
As a database architect, you have to design a custom disaster recovery strategy based on your specific use cases and requirements.
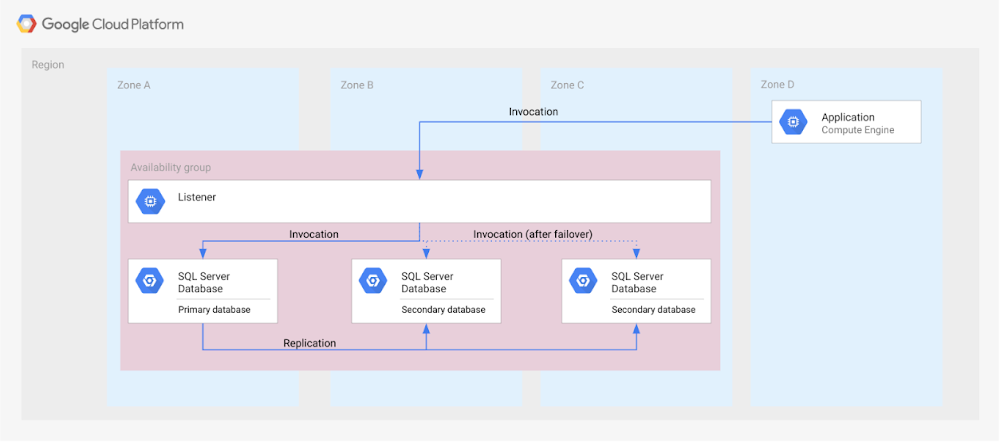
Our new Disaster Recovery for Microsoft SQL Server solution provides information on Microsoft’s SQL Server disaster recovery strategies, and shows how you can map them to zones and regions in GCP based on your business’s particular criteria and requirements. One example is deploying an availability group within a region across three zones (shown in the diagram below).
For successful DR planning, you should have a clear conceptual model and established terminology in place. In this solution, you’ll find a base set of concepts and terms in context of Google Cloud DR. This includes defining terms like primary database, secondary database, failover, switchover, and fallback.
You’ll also find details on recovery point objective, recovery time objective and single point of failure domain, since those are key drivers for developing a specific disaster recovery solution.
Building a DR solution with Microsoft SQL Server in GCP regions
To get started with implementing the availability features of Microsoft SQL Server in the context of Google Cloud, take a look at this diagram, which shows the implementation of an Always On availability group in a GCP region, using several zones:
In the new solution, you’ll see other availability features, like log shipping, along with how they map to GCP. In addition, features in Microsoft SQL Server that are not deemed availability features—like server replication and backup file shipping—can actually be used for disaster recovery, so those are included as well.
Disaster recovery features of Microsoft SQL Server do not have to be used in isolation and can be combined for more complex and demanding use cases. For example, you can set up availability groups in two regions with log shipping as the transfer mechanism between the regions.
Disaster Recovery for Microsoft SQL Server also describes the disaster recovery process itself, how to test and verify a defined disaster recovery solution, and outlines a basic approach, step-by-step.
More Relevant Stories for Your Company

Google Migration and BigQuery Brings PedidosYa Closer towards its Goal of Becoming Data-driven
Editor’s note: PedidosYa is the market leader for online food ordering in Latin America, serving 15 markets and over 400 cities. It’s also one of the largest brands within the German multinational company Delivery Hero SE. With over 20 million app downloads, PedidosYa provides the best online delivery experience through

PaGaLGuY Turns to Google Cloud Platform to Power Leading India Education Network
Founded in 2006, PaGaLGuY started as a forum that enabled students, typically aged between 20 and 30 to discuss and seek advice on academic issues. By 2011, PaGaLGuY had increased its traffic to about 250,000 page views per month. The business is now one of India’s largest education networks and

The Right Datawarehouse Helps Fight Climate Change, While Improving Customer Experience
When you think about climate change, you might not consider a daily commute to work or a drive around town as big contributing factors. And yet, transport is the fastest growing source of CO2 emissions from fossil fuel, which in turn is the largest contributor to climate change. This is the key insight

Optimizing Terabyte-scale PostgreSQL Migrations to Cloud SQL Using Searce
Google Cloud allows you to move your PostgreSQL databases to Cloud SQL with Database Migration Service (DMS). DMS gives you the ability to replicate data continuously to the destination database, while the source is live in production, enabling you to migrate with minimum downtime. However, terabyte-scale migrations can be complex.
