





Google Cloud Helps Northwell Health to Boost Caregiver Productivity and Access to Right Care Using AI

7950
Of your peers have already read this article.
2:00 Minutes
The most insightful time you'll spend today!
Lung cancer is the leading cause of cancer death in the United States and like any cancer, early detection is crucial to survival. Screening at-risk populations is an important part of reducing mortality, and if concerning nodules are found on imaging, further testing may be required. Today, we’ll share how Northwell Health uses Google Cloud products such as Cloud Healthcare APIs and BigQuery to increase caregiver productivity and deliver better care for patients with findings that indicate potential development of lung cancer.
Northwell is New York’s largest healthcare provider
Northwell Health is New York’s largest healthcare provider with 23 hospitals and nearly 800 outpatient facilities. Northwell’s nearly 4,000 doctors care for millions of patients each year, and at this scale, there is an immense amount of healthcare data to manage. To better manage and leverage this data, Northwell Health partnered with Google Cloud starting in 2018.
Enabling caregivers to spend more time with patients
Nic Lorenzen, the lead developer of Northwell Emerging Technology and Innovation team, has a mission to put together data for caregivers in a way that makes sense. It is no secret that inefficient electronic health records systems have a negative impact on a physician’s ability to deliver quality care. Traditional EHRs have information distributed across many tabs, which forces caregivers to spend considerable time at the computer trying to find information. Moreover, speed of care matters. If care is delayed, patients may have to spend more time in the hospital and may suffer worse health outcomes.
To solve this problem, Nic’s team focused on giving caregivers the most relevant pieces of data at the right time by developing an intelligent clinician rounding app. The data needed to derive these insights can depend on the caregiver’s role–a nurse cares about different things than a cardiologist. This system aggregates multiple data sources, and provides patient-specific insights to caregivers.
This system would not have been possible before with traditional EHRs and data warehouses that have proprietary data models and rarely sync data in real time. Now with data easily accessible through Google Cloud’s Healthcare solutions, Nic’s team can deliver the right clinical information to the right people instantly. These days, Nic says, “instead of spending 75% of our time dealing with architecting the underlying platforms, we spend 75% of our time focused on higher value use cases for clinicians and patients. Google Cloud’s Healthcare solutions have greatly improved our developer productivity and time to value.”
Caregivers have found this new system to be a game changer.Before the implementation of this system, caregivers would spend, on average, seven to nine minutes finding the data needed to make medical decisions for one patient. Now, that aggregated information is delivered to a caregiver’s mobile device in less than a second.
Ensuring patients get the right care with the power of AI
There are a number of reasons why patients might not get the care that they need. For example, patients today can go to multiple hospitals and clinics settings, and coordinating care across multiple facilities is complex. Regional hospitals and clinics have their own siloed view of their data, so pertinent information gathered by one clinic might not be seen by another. These gaps in clinical data lead to gaps in patient care.
When a patient gets radiologic imaging, they may have findings unrelated to the reason they initially got the imaging. For example, a chest CT for a car accident might reveal an incidental lung nodule that could be cancerous. Unfortunately, research shows that a large portion of patients do not get follow up for these incidental findings because it isn’t the primary reason why the patient is seeing a doctor. Moreover, social determinants of health are a factor that affects which patients receive follow-up care. Identifying these patients and providing the necessary follow up care prevents adverse events related to delayed detection of cancer.

With Cloud Healthcare solutions, Northwell built an AI model to identify these patients so that oncologists can appropriately follow up with patients who have findings suspicious for lung cancer. The AI model detects incidental pulmonary nodules in radiology reports so that doctors can then contact the patients that need follow-up care. Nic says his team was able to build this system in a week: “Google Cloud did a lot of heavy-lifting for us and allowed us to get to the AI applications much faster. It allowed us to build a platform that just works.”
Healthcare systems can now rapidly generate healthcare insights with one end-to-end solution, Google Cloud Healthcare Data Engine. It builds on and extends the core capabilities of the Google Cloud Healthcare API to make healthcare data more immediately useful by enabling an interoperable, longitudinal record of patient data. Northwell Health uses Google Cloud as the core of their platform, enabling their developers to create solutions to the most pressing healthcare problems.
Special thanks to Kalyan Pamarthy, Product Management Lead on Cloud Healthcare and Natural Language APIs for contributing to this blog post.
Principles to Make Organizations Data Engineering Driven

4838
Of your peers have already read this article.
4:00 Minutes
The most insightful time you'll spend today!
In the “What type of data processing organisation” paper, we examined that you can build a data culture whether your organization consists mostly of data analysts, or data engineers, or data scientists. However, the path and technologies to become a data-driven innovator are different and success comes from implementing the right tech in a way that matches a company’s culture. In this blog we will expand the data engineering driven organizations and provide how it can be built from the first principles.
Not all organizations are alike. All companies have similar functions (sales, engineering, marketing), but not all functions have the same influence on the overall business decisions. Some companies are more engineering-driven, others are sales-driven, others are marketing-driven. In practice, all companies are a mixture of all these functions. In the same way, the data strategy can be more focused on data analysts, and others on data engineering. Culture is a combination of several factors, business requirements, organizational culture, and skills within the organization.
Traditionally organizations that focused on engineering mainly came from technology driven digital backgrounds. They built their own frameworks or used programming frameworks to build repeatable data pipelines. Some of this is due to the way the data is received, the shape the data is received and the speed of the data arrival as well. If your data allows it, your organization can be more focused on data analysis, and not so much on data engineering. If you can apply an Extract-Load-Transform approach (ELT) rather than the classic Extract-Transform-Load (ETL), then you can focus on data analysis and might not need extensive data engineering capability. For example, data that can be loaded directly into the data warehouse allows data analysts to also do data engineering work and apply transformations to the data.
This does not happen so often though. Sometimes your data is messy, inconsistent, bulky, and encoded in legacy file formats or as part of legacy databases or systems, with a little potential to be actionable by data analysts.
Or maybe you need to process data in streaming, applying complex event processing to obtain competitive insights in near real time. The value of data decays exponentially with time. Most companies can process data by the next day in batch mode. However, not so many are probably obtaining such knowledge the next second data is produced.
In these situations, you need the talent to unveil the insights hidden in that amalgam of data, either messy or fast changing (or both!). And almost as importantly, you need the right tools and systems to enable that talent too.
What are those right tools? Cloud provides the scalability and flexibility for data workloads that are required in such complex situations. Long gone are the times when data teams had to beg for the resources that were required to have an impact in the business. Data processing systems are no longer scarce, so your data strategy should not generate that scarcity artificially.
In this article, we explain how to leverage Google Cloud to enable data teams to do complex processing of data, in batch and streaming. By doing so, your data engineering and science teams can have an impact when (in seconds) after the input data is generated.
Data engineering driven organizations
When the complexity of your data transformation needs is high, data engineers have a central role in the data strategy of your company, leading to data engineering driven organization. In this type of organization, data architectures are organized in three layers: business data owners, data engineers, and data consumers.
Data engineers are at the crossroads between data owners and data consumers, with clear responsibilities:
- Transporting data, enriching data whilst building integrations between analytical systems and operational systems ( as in the real time use cases)
- Parsing and transforming messy data coming from business units into meaningful and clean data, with documented metadata
- Applying DataOps, that is, functional knowledge of the business plus software engineering methodologies applied to the data lifecycle
- Deployment of models and other artifacts analyzing or consuming data
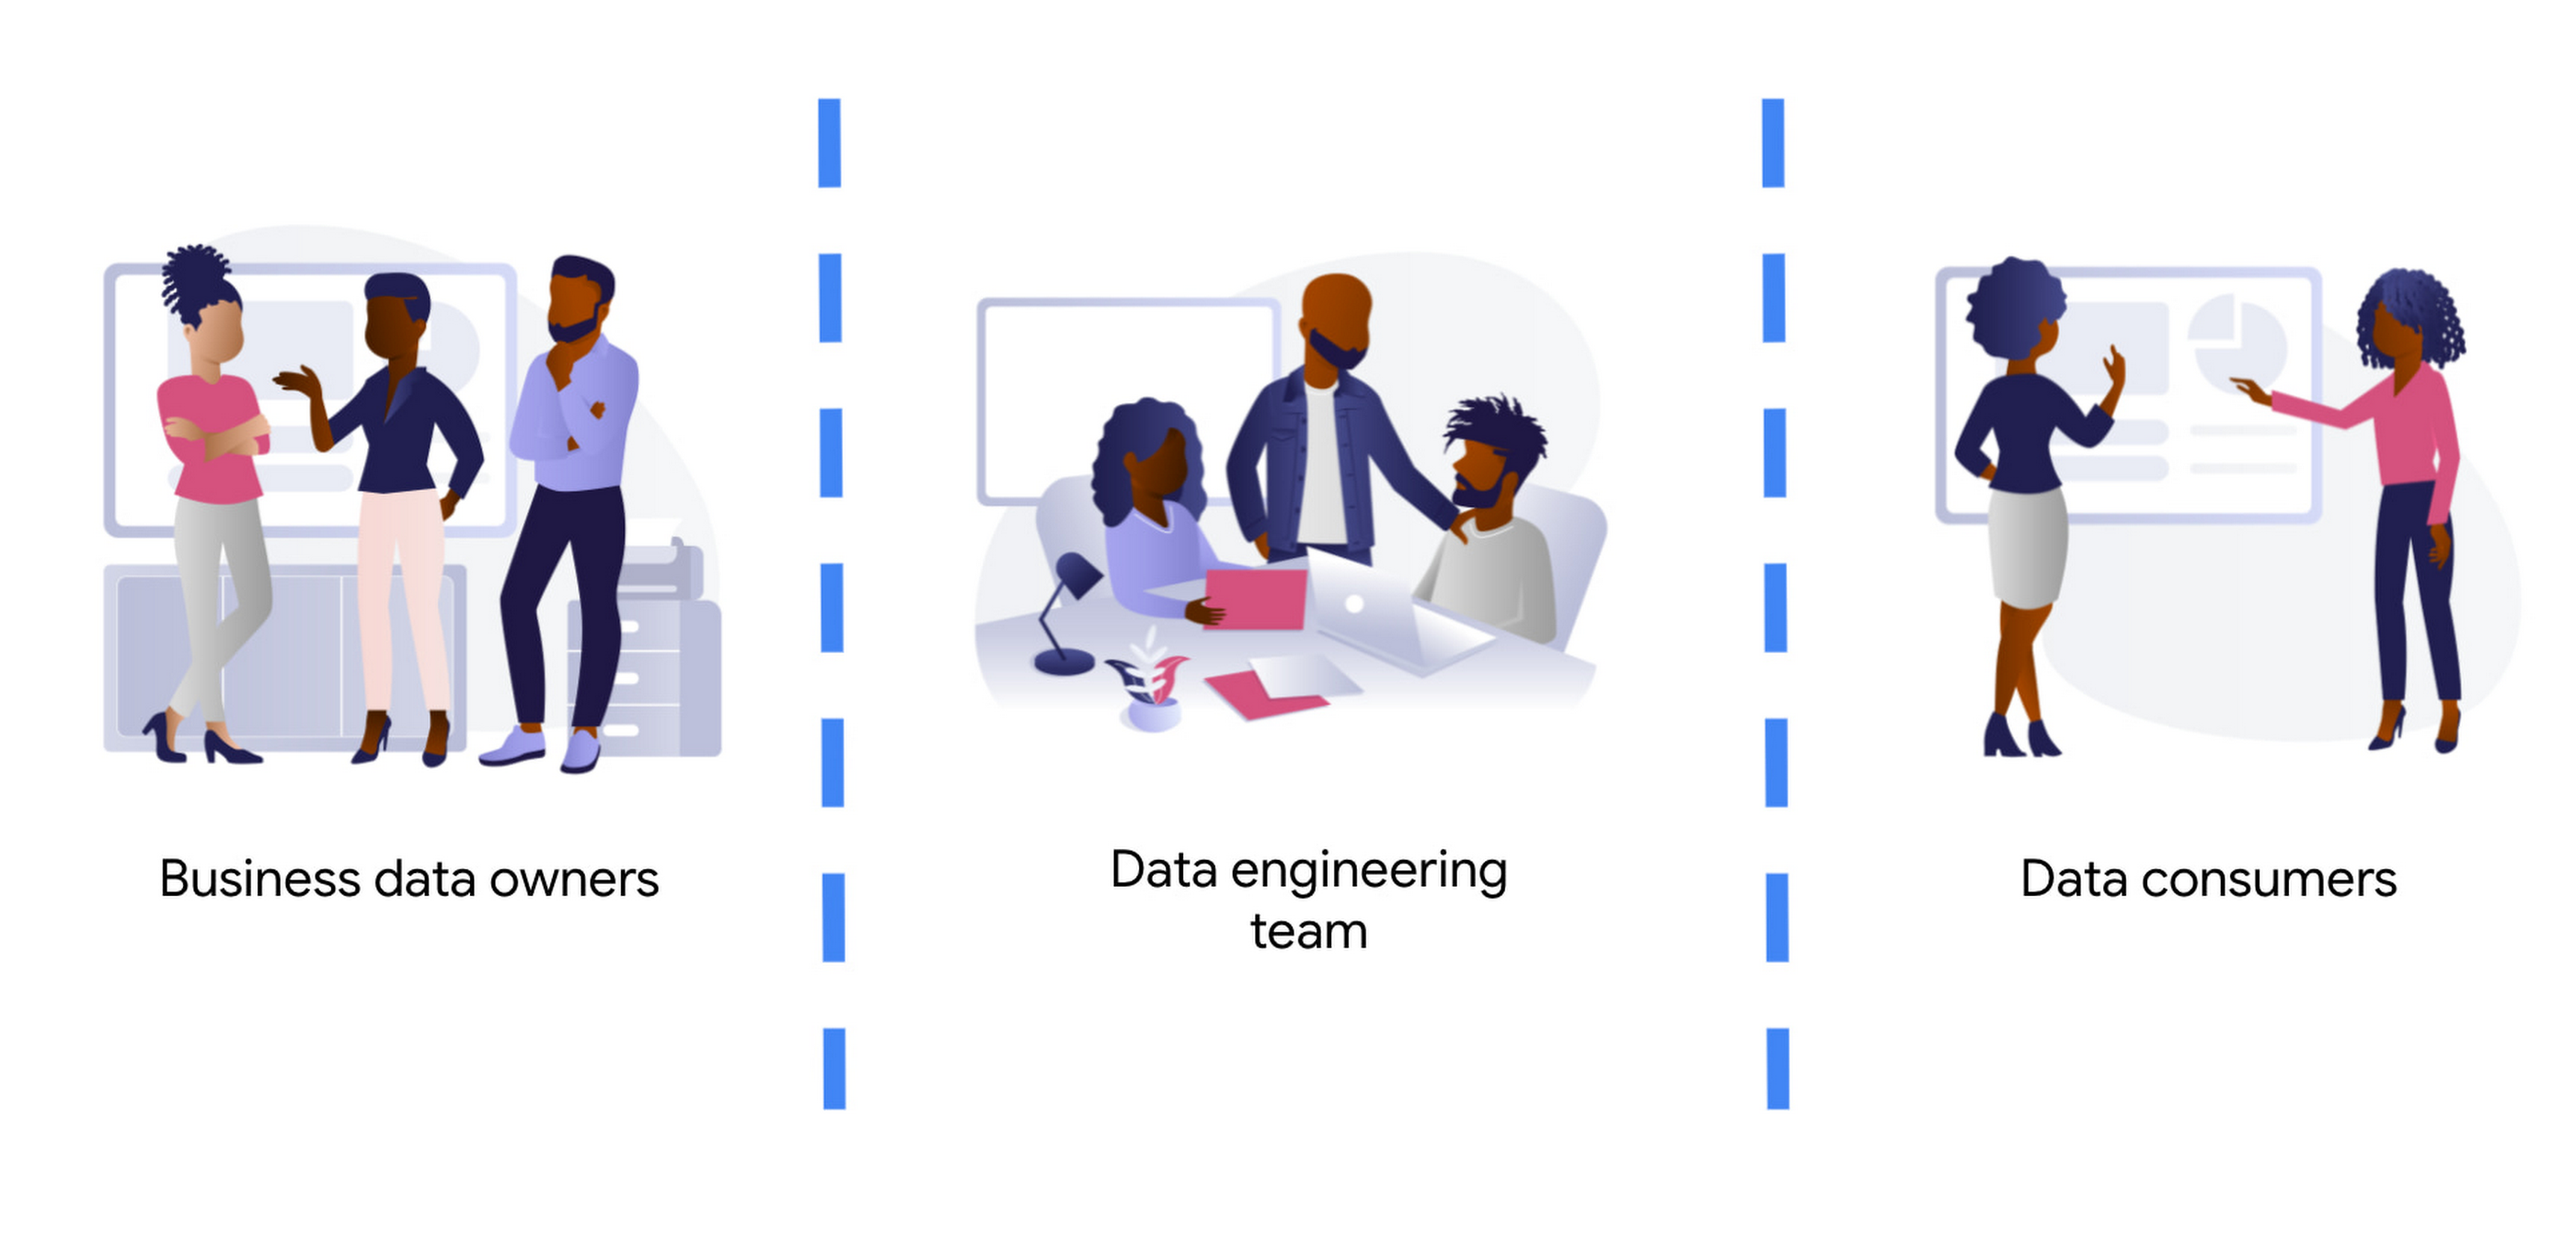
Business data owners are cross-functional domain-oriented teams. These teams know the business in detail, and are the source of data that feeds the data architecture. Sometimes these business units may also have some data-specific roles, such as data analysts, data engineers, or data scientists, to work as interfaces with the rest of the layers. For instance, these teams may design a business data owner, that is the point of contact of a business unit in everything that is related to the data produced by the unit.
At the other end of the architecture, we find the data consumers. Again, also cross-functional, but more focused on extracting insights from the different data available in the architecture. Here we typically find data science teams, data analysts, business intelligence teams, etc. These groups sometimes combine data from different business units, and produce artifacts (machine learning models, interactive dashboards, reports, and so on). For deployment, they require the help of the data engineering team so that data is consistent and trusted.
At the center of these crossroads, we find the data engineering team. Data engineers are responsible for making sure that the data generated and needed by different business units gets ingested into the architecture. This job requires two disparate skills: functional knowledge and data engineering/software development skills. This is often coined under the term DataOps (which evolved from DevOps methodologies developed within the past decades but applied to data engineering practices).
Data engineers have another responsibility too. They must help in the deployment of artifacts produced by the data consumers. Typically, the data consumers do not have the deep technical skills and knowledge to take the sole responsibility for deployment of their artifacts.This is also true for highly sophisticated data science teams. So data engineers must add other skills under their belt: machine learning and business intelligence platform knowledge. Let’s clarify this point, we don’t expect data engineers to become machine learning engineers. Data engineers need to understand ML to ensure that the data delivered to the first layer of a model ( the input ) is correct. They will also become key when delivering that first layer of data in the inference path, as here the data engineering skills around scale / HA etc really need to shine.
By taking the responsibility of parsing and transforming messy data from various business units, or for ingesting in real time, data engineers allow the data consumers to focus on creating value. Data science and other types of data consumers are abstracted away from data encodings, large files, legacy systems, complex message queue configurations for streaming. The benefits of concentrating that knowledge in a highly skilled data engineering team are clear, notwithstanding that other teams (business units and consumers) may also have their data engineers to work as interfaces with other teams. More recently, we even see squads created with members of the business units (data product owners), data engineers, data scientists, and other roles. Effectively creating complete teams with autonomy and full responsibility over a data stream, from the incoming data down to the data driven decision with impact in the business.
Reference architecture – Serverless
The number of skills required for the data engineering team is vast and diverse. We should not make it harder by expecting the team to maintain the infrastructure where they run data pipelines. They should be focusing on how to cleanse, transform, enrich, and prepare the data rather than how much memory or how many cores their solution may require.
The reference architectures presented here are based on the following principles:
- Serverless no-ops technologies
- Streaming-enabled for low time-to-insight
We present different alternatives, based on different products available in Google Cloud:
- Dataflow, the built-in streaming analytics platform in Google Cloud
- Dataproc, the Google Cloud’s managed platform for Hadoop and Spark.
- Data Fusion, a codeless environment for creating and running data pipelines
Let’s dig into these principles.
By using serverless technology we eliminate the maintenance burden from the data engineering team, and we provide the necessary flexibility and scalability for executing complex and/or large jobs. For example, scalability is essential when planning for traffic spikes during mega Friday for retailers. Using serverless solutions allows retailers to look into how they are performing during the day. They no longer need to worry about resources needed to process massive data generated during the day.
The team needs to have full control and write their own code for the data pipelines because of the type of pipelines that the team develops. This is true either for batch or streaming pipelines. In batch, the parsing requirements can be complex and no off the shelf solution works. In streaming, if the team wants to fully leverage the capabilities of the platform, they should implement all the complex business logic that is required, without artificially simplifying the complexity in exchange for some better latency. They can develop a pipeline that achieves a low latency with highly complex business logic. This again requires the team to start writing code from first principles.
However, that the team needs to write code should not imply that they need to rewrite any existing piece of code. For many input/output systems, we can probably reuse code from patterns, snippets, and similar examples. Moreover, a logical pipeline developed by a data engineering team does not necessarily need to map to a physical pipeline. Some parts of the logic can be easily reused by using technologies like Dataflow templates, and use those templates in orchestration with other custom developed pipelines. This brings the best of both worlds (reuse and rewrite), while saving precious time that can be dedicated to higher impact code rather than common I/O tasks. The reference architecture presented has another important feature: the possibility to transform existing batch pipelines to streaming.
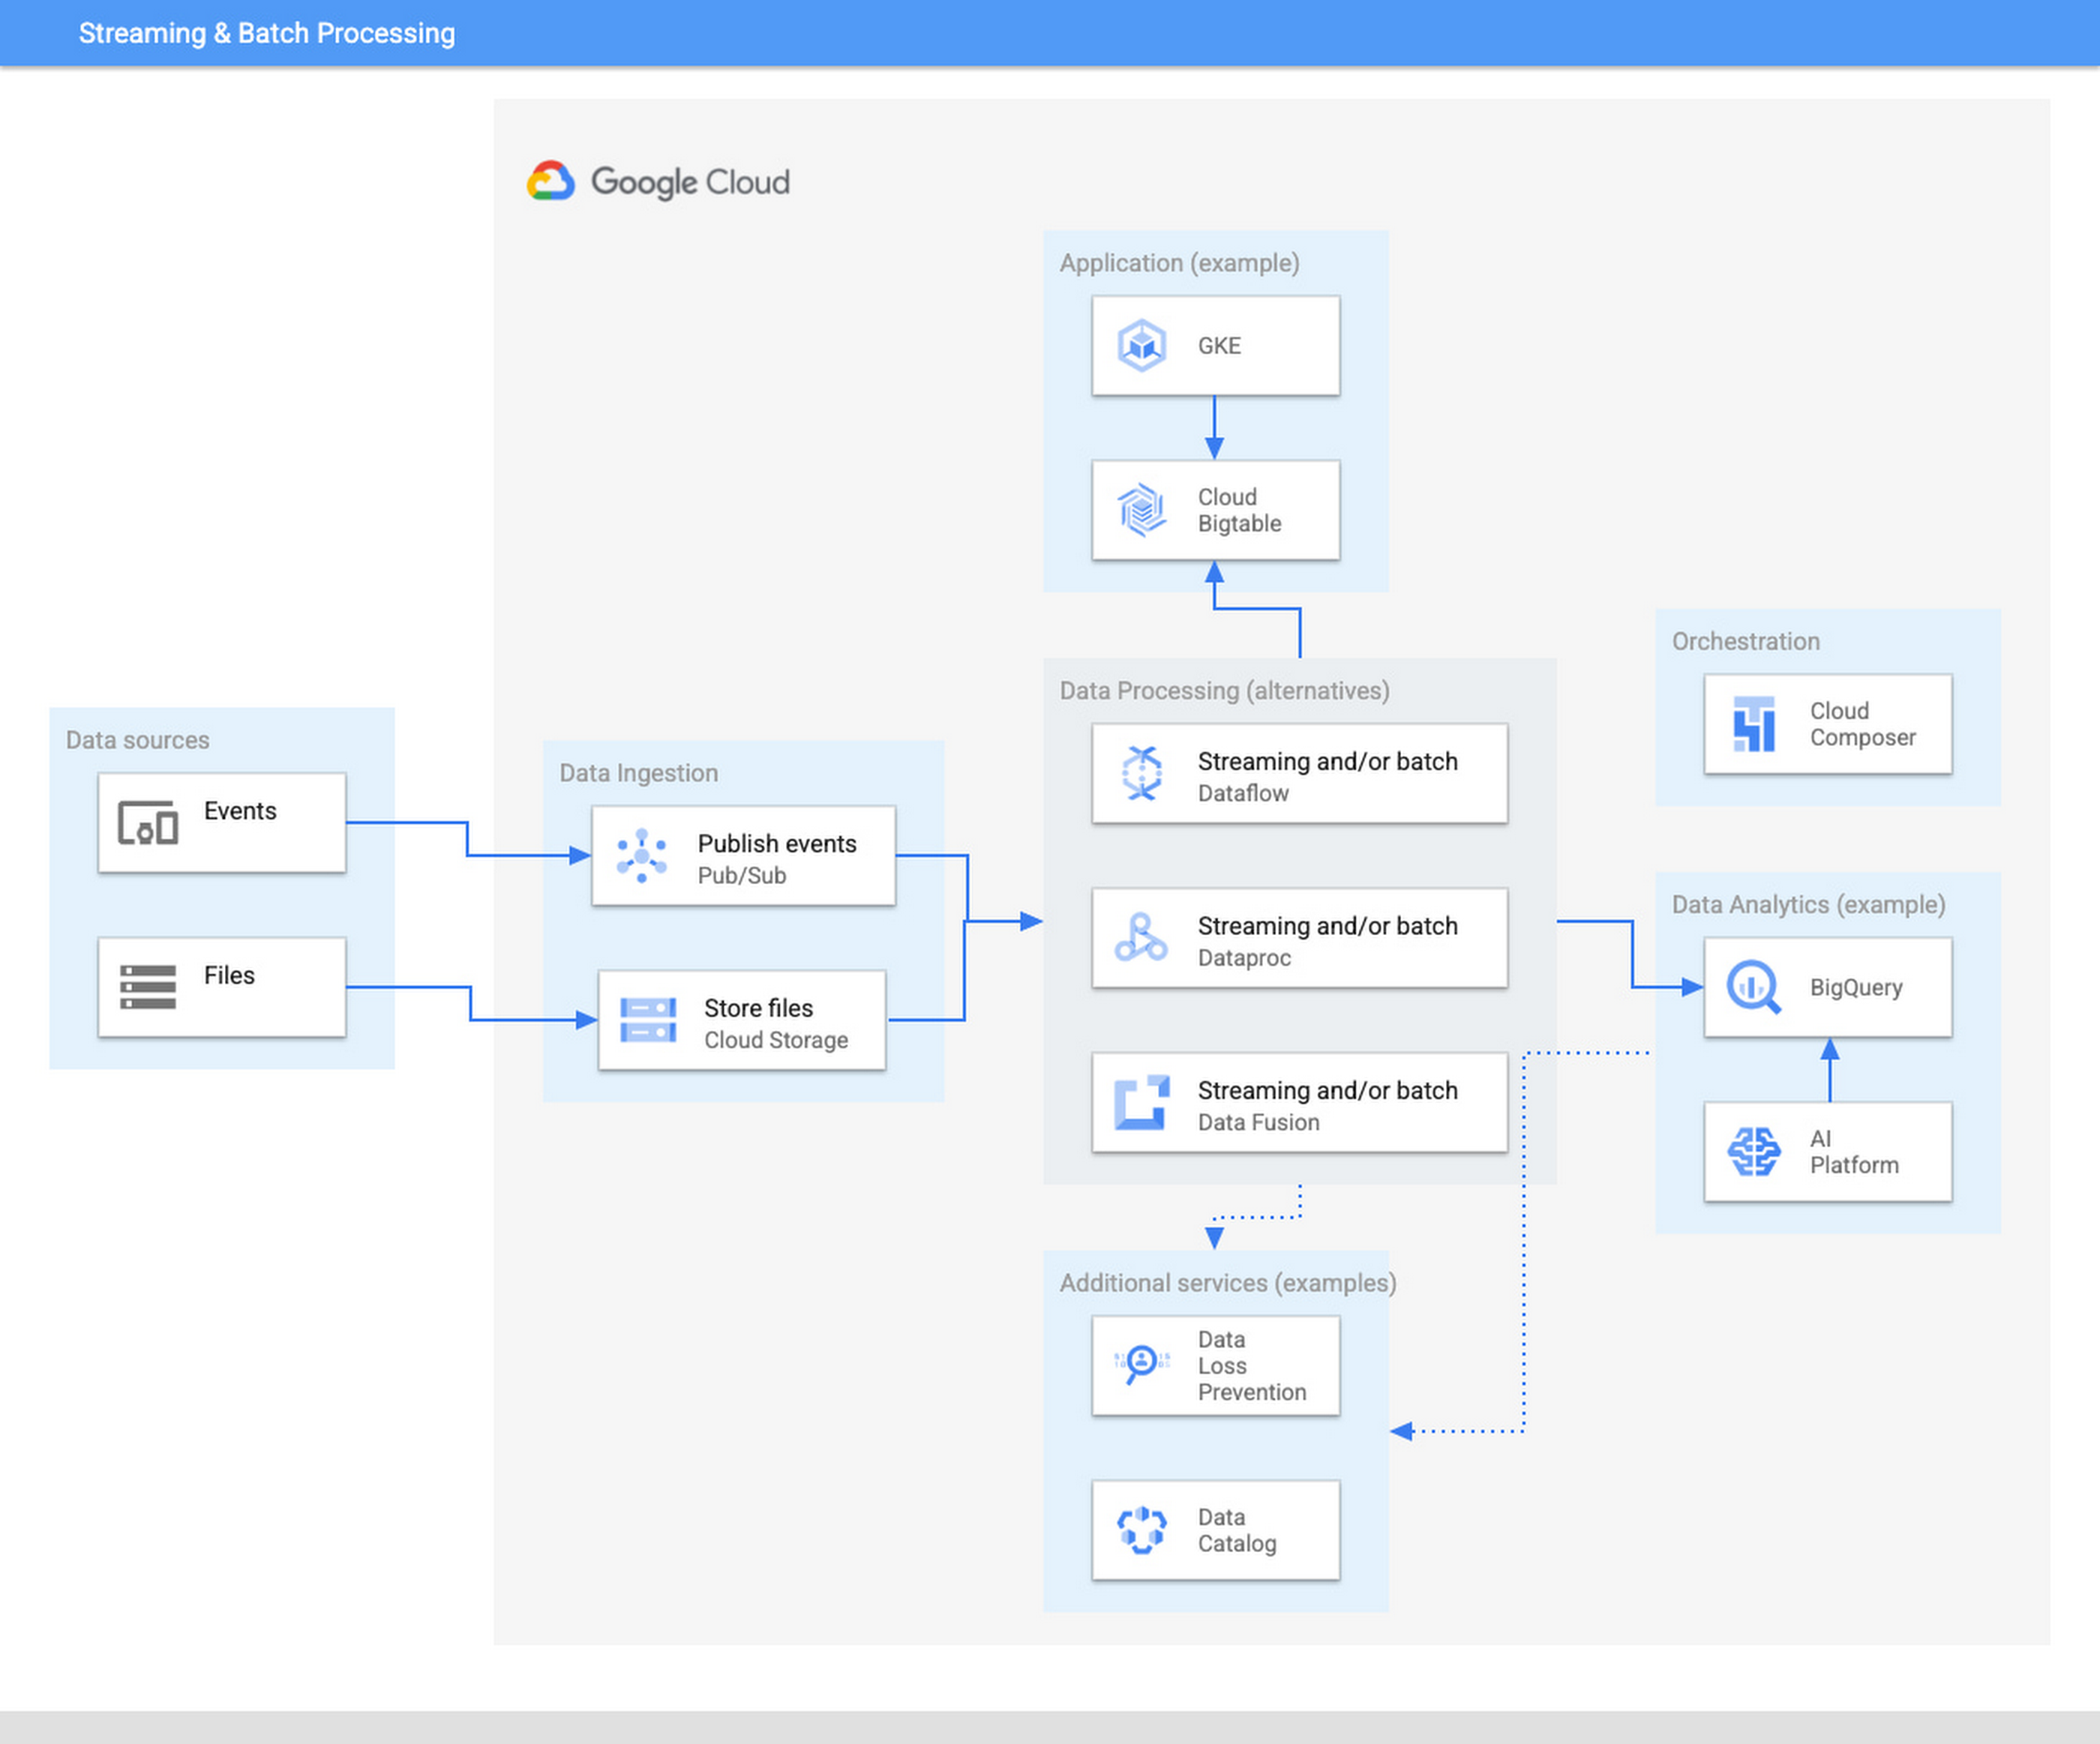
The ingestion layer consists of Pub/Sub for real time and Cloud Storage for batch and does not require any preallocated infrastructure. Both Pub/Sub and Cloud Storage can be used for a range of cases as it can automatically scale up with the input workload.
Once the data has been ingested, our proposed architecture follows the classical division in three stages: Extract, Transform, and Load (ETL). For some types of files, direct ingestion into BigQuery (following an ELT approach) is also possible.
In the transform layer, we primarily recommend Dataflow as the data process component. Dataflow uses Apache Beam as SDK. The main advantage of Apache Beam is the unified model for batch and streaming processing. As mentioned before, the same code can be adapted to run in batch or streaming by adapting input and output. For instance, switching the input from files in Cloud Storage to messages published in a topic in Pub/Sub.
One of the alternatives to Dataflow in this architecture is Dataproc, Google Cloud’s solution for managed Hadoop and Spark clusters. The main use case is for those teams that are migrating to Google Cloud but have large amounts of inherited code in Spark or Hadoop. Dataproc enables a direct path to the cloud, without having to review all those pipelines.
Finally, we also present the alternative of Data Fusion, a codeless environment for creating data pipelines using a drag-and-drop interface. Data Fusion actually uses Dataproc as its Compute Engine, so everything we have mentioned earlier applies also to the case of Data Fusion. If your team prefers to create data pipelines without having to write any code, Data Fusion is the right tool.
So in summary, these are the three recommended components for the transform layer:
- Dataflow, powerful and versatile with a unified model for batch and streaming processing. Straightforward path to move from batch processing to streaming
- Dataproc, for those teams that want to reuse existing code from Hadoop or Spark environments.
- Data Fusion, if your team does not want to write any code.
Challenges and opportunities
Data platforms are complex. Having on top of that data responsibility the duty to maintain infrastructure is a wasteful use of valuable skills and talent. Often data teams end up managing infrastructure rather than focusing on analyzing the data. The architecture presented in this article liberates the data engineering team from having to allocate infrastructure and tweak clusters but instead to focus on providing value through data processing pipelines.
For data engineers to focus on what they do best, you need to fully leverage the cloud. A lift & shift approach from any on-premise installation is not going to provide that flexibility and liberation. You need to leverage serverless technologies. As an added advantage, serverless lets you also scale your data processing capabilities with your needs, and be able to respond to peaks of activity, however large these are.
Serverless technologies sometimes face the doubts of practitioners: will I be locked in with my provider if I fully leverage serverless? This is actually a question that you should be asking when deciding whether to set up your architecture on top of a provider.
The components presented here for data processing are based on open source technologies, and fully interoperable with other open source equivalent components. Dataflow uses Apache Beam, which not only unifies batch and streaming, but also offers a widely compatible runner. You can take your code elsewhere to any other runner. For instance, Apache Flink or Apache Spark. Dataproc is a fully managed Hadoop and Spark based on the vanilla open source components of this ecosystem. Data Fusion is actually the Google Cloud version of CDAP, an open source project.
On the other hand, for the serving layer, BigQuery is based on standard Ansi SQL. Whereas in the case of Bigtable and Google Kubernetes Engine, Bigtable is compatible at API level with HBase, and Kubernetes is an open source component.
In summary, when your components are based on open source, like the ones included in this architecture, serverless does not lock you in. The skills required to encode business logic in the form of data processing pipelines are based on engineering principles that remain stable across time. The same principles apply if you are using Hadoop, Spark, or Dataflow or UI driven ETL tooling. In addition, there are now new capabilities, such as low-latency streaming, that were not available before. A team of data engineers that learn the fundamental principles of data engineering will be able to quickly leverage those additional capabilities.
Our recommended architecture separates the logical level, the code of your applications, from the infrastructure where they run. This enables data engineers to focus on what they do best and on where they provide the highest added value. Let your Dataflow and your engineers impact your business, by adopting the technologies that liberate them and allow them to focus on adding business value. To learn more about building an unified data analytics platform, take a look at our recently published Unified Data Analytics Platform paper and Converging Architectures paper.
Google’s Diversity Annual Report public dataset & BigQuery

3250
Of your peers have already read this article.
3:30 Minutes
The most insightful time you'll spend today!
Since 2014, tech companies have relied on metrics to identify trouble spots, establish baselines, and measure meaningful progress in diversity, including publishing DEI data directly through diversity annual reports. However, as our understanding of DEI has evolved over time each company’s report has diverged, creating a fragmented landscape of industry-wide data. This separation is problematic as no single company’s diversity dataset can solve tech’s DEI challenges. Instead, we need to build industry-wide systemic solutions to create sustainable change, and those start with establishing a common language for DEI data and standardizing and sharing DEI data across tech companies.
The challenge is most companies publish diversity data in a way that makes it difficult to analyze, such as using bar graphs and pie charts. Researchers, as a result, are unable to easily pull the real, detailed data or aggregate and analyze it for their unique needs (e.g. hiring trends for tech vs. nontechnical roles, representation of Asian women in leadership, and more). As we shared in our most recent Diversity Annual Report, external research shows that sustainable change will only come from solutions that encompass the entire tech industry and data transparency is a critical step in this work.
Google’s Diversity Annual Report public dataset & BigQuery
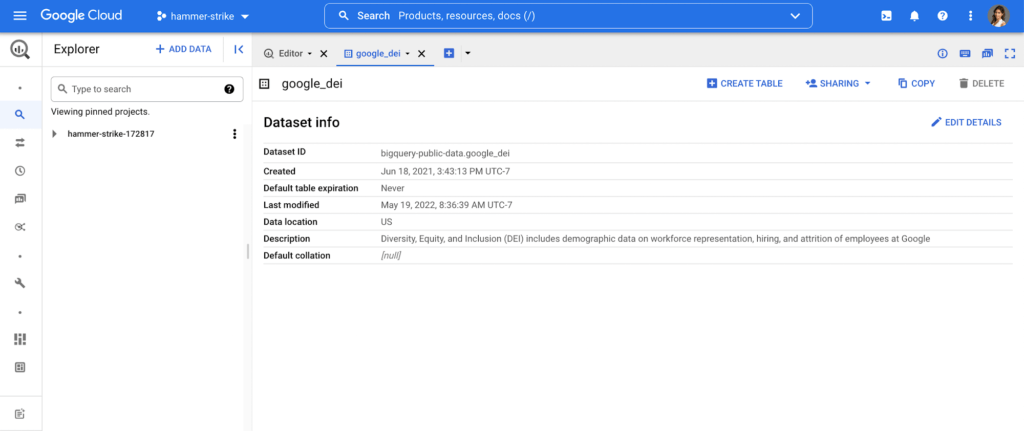
In May, we released our 2022 Diversity Annual Report, which includes demographic data on workforce representation, hiring, and attrition of employees at Google, including leadership. You can see our hiring data by race/ethnicity, gender, and intersectional hiring over time, by region, and more. In an effort to make this data more transparent and accessible for analysis, we have added it as a public dataset in BigQuery, Google Cloud’s powerful data warehousing tool. Our data is now even easier for researchers, community organizations, and industry groups to leverage and compare against external benchmarks to help contextualize our progress.
As one of the first in the industry, we are proud to have published our diversity data on BigQuery for the second year in a row. Our dataset, among others, is public, stored and paid for by Google so those who are interested can use BigQuery’s advanced analytic capabilities through the Google Cloud Public Dataset Program for free*.
Contextualizing diversity data is necessary to make meaningful conclusions
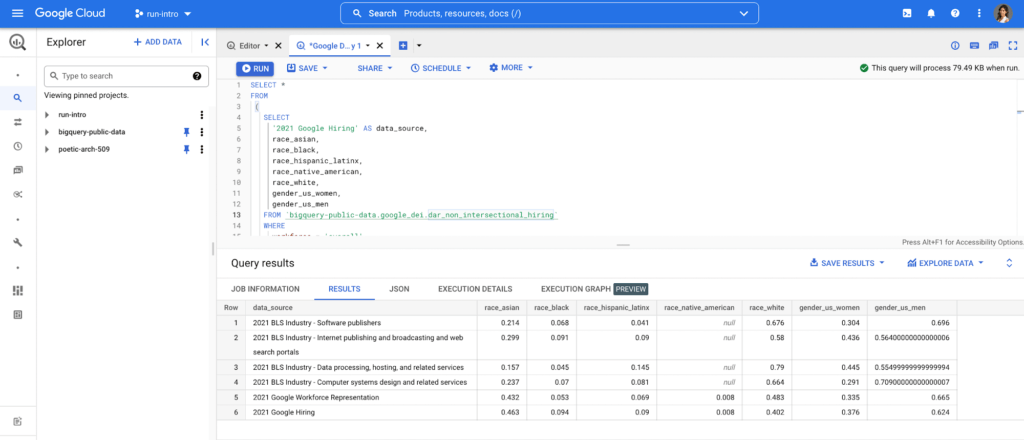
While Google’s diversity dataset can help users compare their own datasets to Google’s current and historical trends, DEI data is only useful when analyzed in the context of other relevant datasets. For example, concluding that Black+ hiring has increased from 8.8% to 9.4% has little meaning unless there is a point of reference, like US general census data, labor force participation rates or graduation rates. It’s why Google also includes other public datasets in BigQuery such as related industry DEI data, talent and graduation pools. By doing so, users can run a sample query that then compares Google’s hiring and representation to related industries (software publishers, data process services, etc.). Users can then better understand and contextualize areas of progress and opportunity, and they can more objectively identify where organizations can take a proactive role in addressing not only DEI in their companies, but also in the communities in which they call home.
Intersectional data and disaggregated baseline metrics
In the workplace, intersectional data is key to understanding the layers of exclusion and inequity that may exist for certain groups. This includes those with social identity overlap, like race, gender, and LGBTQ+, that create multiple levels of inequality or discrimination. It’s critical for DEI data to be disaggregated in a meaningful way to diagnose the true health of a system and to better understand how intersectionality contributes to the greater DEI landscape .
Google’s Diversity Annual Report public dataset includes Google’s intersectional hiring and representation data also broken down by tech, non-tech, and leadership roles. BigQuery’s friendly interface makes it easy to select the relevant parameters and join this data with other public or private datasets to help meaningfully contextualize Google’s data against the broader industry. Anyone from data scientists to DEI stewards can launch public datasets from the Google Cloud Marketplace and start querying them right away. Findings can be visualized through tools like Looker, Data Studio, or Tableau.
This is just the beginning
As DEI work continues to evolve into an industry-wide approach, we must encourage a standard of practice for collecting and reporting data across the board. At scale, data has the power to enable the tech industry to make real improvements collectively, in addition to inside our individual companies. We hope our dataset and sample queries give researchers and individuals a launchpad to become DEI practitioners of the tech industry, and ensure we have the right data to solve the right problems.
Footnote:
*The only time anyone would need to pay is for queries performed on the data after BigQuery’s 1TB/mo of free tier processing. This means that each user receives 1TB of free BigQuery processing every month, which can be used to run queries on this public dataset.

Le Figaro Uses Google Firebase to Personalize Experiences and Generates 3X Revenue Results
DOWNLOAD CASE STUDY8292
Of your peers have already downloaded this article
1:45 Minutes
The most insightful time you'll spend today!
Le Figaro, established in 1826, is France’s oldest and largest daily morning newspaper. The company’s mission is to provide timely, digestible and engaging news to their readers. As one of the first in the industry to offer digital content, Le Figaro engages their subscribers across 11 Android, iOS and web apps that cover news, sports, lifestyle and games. Le Figaro has about 22M monthly active users on their mobile and web apps and 120K paid digital subscribers.
The Challenge
In a saturated news app market, Le Figaro was looking to increase paying customers and to retain existing paid subscribers. To do this, Le Figaro’s development team needed to engage readers with personalized content at the right price point, but how could they pull it off with limited time and resources?
The Solution
Le Figaro used a number of Firebase products to retain existing users and increase paid subscriptions. They sent targeted notifications through Firebase Cloud Messaging reminding customers to follow topics and journalists they found interesting. This helped reduce churn by keeping subscribers engaged in content they valued. They also tested different subscription amounts using Firebase A/B testing, which helped Le Figaro identify the price points that led to the highest number of conversions among both Android and iOS users.
“Using Firebase has completely transformed Le Figaro’s digital business by making it easy to rapidly innovate and personalize content for our readers. With Firebase we have seen continuous increases in retention, downloads and screen time in our apps!”
Valentin Paquot, Mobile CTO, Le Figaro
Le Figaro found their biggest increase in paid subscriptions came from embedding real time interactive infographics into their mobile and web app articles. When a user added information into the infographic, it triggered a Cloud Function that accessed data stored in Cloud Firestore and returned a personalized infographic to the user in real time.
For example, in the article “Are you rich?” readers could input their income into the infographic and compare it against different income groups in Paris instantaneously. The infographics was behind a paywall and users had to subscribe to gain access.
According to Le Figaro, this infographic saw 3X the rate of paid subscription sign-ups compared to their other infographics. The team built this interactive infographic system in 3 days instead of their average time of 2-3 weeks using a traditional backend service. Using Cloud Functions and Cloud Firestore, they estimate they were able to reduce development time by 86%.
Data to Business Outcomes with Google’s Data Analytics Design Pattern

6731
Of your peers have already read this article.
1:30 Minutes
The most insightful time you'll spend today!
Companies today are inundated with vast amounts of data from various sources. This overwhelming amount of data is meant to benefit the company, but often leaves data teams feeling overwhelmed, which can create data bottlenecks and result in a slow time to value. In fact, only twenty seven percent of companies agree that data and analytics projects produce insights and recommendations that are highly actionable (Accenture). This means that nearly 3 in 4 companies are not unlocking value in their data, which poses a huge challenge for organizations trying to move the needle and drive real business results. We at Google Cloud, however, saw opportunity in this challenge, which is why we created Data Analytics Design Patterns: cross-product technical solutions designed to accelerate a customer’s path to value realization with their data. These industry solutions bring together product capabilities alongside design methodology, open source deployable code, data models, and reference architectures to accelerate your business outcomes.

With Data Analytics Design Patterns, you get access to more than 30 ready-to-deploy data analytics solutions. Design patterns leverage the best of Google and our rich partner ecosystem, including Technology Partners & System Integrators. In this blog, we will cover 3 examples on how a design pattern can be applied to unlock the value of data:
- Improve mobile app experience with Unified App Analytics
- Maximize digital shop’s revenue with Price Optimization
- Protect internal systems from security and malware threat with Anomaly Detection
Unified App Analytics
If mobile apps are part of your go-to-market strategy, you have several data sources that can provide invaluable customer insights. In addition to tools such as CRM (e.g. Salesforce) and customer care (e.g. Zendesk), you likely use Google Analytics to log app events and Firebase Crashlytics to gather data about app errors. But can you easily combine back-end server data with app front-end data to unlock customer insights?
The Unified App Analytics design pattern makes it easy to plug all the disparate data sources into a single warehouse (BigQuery) and start analyzing it with a Business Intelligence tool (Looker). Once you have a complete and real time view of your customer experience with your app, you can take action. For example, if you notice an increase in app errors, you can quickly combine your Crashlytics data with your CRM data to narrow down the crashes with the highest revenue impact and prioritize their resolution. Further, you can automate your issue resolution workflow by creating a rule for any future crash that impacts a subset of VIP customers.

With the Unified App Analytics design pattern, you’ll gain access to valuable insights about your user experience with your app so you can inform your future app strategy. For example, NPR, an American media company, increased user engagement by showing content that better mapped to listener interests and behaviors.
Price Optimization
In a competitive and hectic global marketplace, strategic pricing matters more than ever, but often projects are consumed by the tedium of standardizing, cleaning, and preparing data—from transactions, inventory, demand, among other sources.
Price Optimization solution allows retailers to build a data driven pricing model. The solution consists of three main components:
- Dataprep by Trifacta: integrates different data sources into a single Common Data Model (CDM). Dataprep is an intelligent data service for visually exploring, cleaning, and preparing structured and unstructured data for analysis, reporting, and machine learning.
- BigQuery: allows you to create and store pricing models in a consistent and scalable way as a serverless Cloud Data Warehouse service
- Looker dashboards: surface insights and enable business teams to take action with enterprise ready BI platform
With the Price Optimization design pattern from Google Cloud and our partner Trifacta, you’ll be able to rapidly unify multiple data sources and create a real-time and ML-powered analysis, leveraging predictive models to estimate future sales. For example, PDPAOLA, an online jewelry company, doubled sales with dynamic pricing adjustments enabled by a single data view.

Anomaly Detection
Organizations need to anticipate and act on risks and opportunities to stay competitive in a digitally transforming society. Anomaly detection helps organizations identify and respond to data points and data trends in high velocity, high volume data sets that deviate from historical standards and expected behaviors, allowing them to take action on changing user needs, mitigate malicious actors and behaviors, and prevent unnecessary costs and monetary losses.
The Anomaly Detection design pattern uses Google Pub/Sub, BigQuery, Dataflow, and Looker to:
- Stream events in real time
- Process the events, extract useful data points, train the detection algorithm of choice
- Apply the detection algorithm in near-real time to the events to detect anomalies
- Update dashboards and/or send alerts
The challenge of finding the important insights and anomalies in vast amounts of data applies to organizations across all industries and lines of business, but is especially important to protecting the security of an organization. For example, TELUS, a national communications company, modernized their security analytics platform leveraging this pattern, allowing them to detect anomalies in near real time to detect and mitigate suspicious activity.
Get started
Turn your data into business outcomes with Google Cloud and our broad partner ecosystem by deploying Data Analytics Design Patterns at your organization. There are more than 30 Data Analytics Design Patterns ready for you to use. We have more than 200+ more ideas in the pipeline, so be sure to check in regularly as new patterns will be added soon.
To dive deeper and find out more about how Data Analytics Design Patterns can help your organization accelerate use cases and create faster time to value, check out this video.
3684
Of your peers have already watched this video.
61:30 Minutes
The most insightful time you'll spend today!
How to Move From Redshift to BigQuery Easily
Enterprise data warehouses are getting more expensive to maintain. Traditional data warehouses are hard to scale and often involve lots of data silos. Business teams need data insights quickly, but technology teams have to grapple with managing and providing that data using old tools that aren’t keeping up with demand. Increasingly, enterprises are migrating their data warehouses to the cloud to take advantage of the speed, scalability, and access to advanced analytics it offers.
With this in mind, we introduced the BigQuery Data Transfer Service to automate data movement to BigQuery, so you can lay the foundation for a cloud data warehouse without writing a single line of code. Earlier this year, we added the capability to move data and schema from Teradata and S3 to BigQuery via the BigQuery Data Transfer Service. To help you take advantage of the scalability of BigQuery, we’ve now added a service to transfer data from Amazon Redshift, in beta, to that list.
Data and schema migration from Redshift to BigQuery is provided by a combination of the BigQuery Data Transfer Service and a special migration agent running on Google Kubernetes Engine (GKE), and can be performed via UI, CLI or API. In the UI, Redshift to BigQuery migration can be initiated from BigQuery Data Transfer Service by choosing Redshift as a source.
The migration process has three steps:
- UNLOAD from Redshift to S3—The GKE agent initiates an UNLOAD operation from Redshift to S3. The agent extracts Redshift data as a compressed file, which helps customers minimize the egress costs.
- Transfer from S3 to Cloud Storage—The agent then moves data from Amazon S3 to a Cloud Storage bucket using Cloud Storage Transfer Service.
- Load from Cloud Storage to BigQuery—Cloud Storage data is loaded into BigQuery (up to 10 million files).
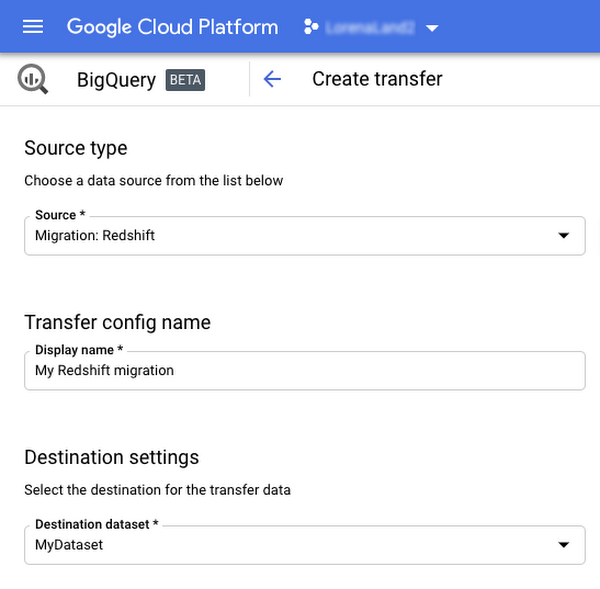
Watch the video to learn more!
More Relevant Stories for Your Company

Daffodil Software Saves Hundreds of Hours Managing Databases with Google Cloud SQL
Daffodil Software is an India-based information technology services company with 180 employees and satellite offices in the US, Singapore, and the United Arab Emirates. Its product: A suite of web-based applications, including a business customer relationship management (CRM) program and an enterprise resource planning (ERP) app for schools. Daffodil’s Challenge

Firestore Cheatsheet to Unlock Application Innovation
Your product teams might ask - “Why does it take so long to build a feature or application?” Building applications is a heavy lift due to the technical complexity, which includes the complexity of backend services that are used to manage and store data. Every moment focused on this technical

MerPay Platform Scales its Reach to Millions of Users using Cloud Spanner
Editor’s note: To launch a new mobile payment platform, Mercari needed a database solution strong on scalability, availability, and performance. Here’s how Cloud Spanner delivered those results. E-commerce companies need to connect customers to their services securely, reliably, with zero downtime. When Mercari, Inc. launched a new mobile payment platform, we chose Cloud


Business Modernization with Oracle Workloads in Google Cloud
With today's ever-changing business dynamics, business continuity is a key focus for all of us, and enterprise databases like Oracle play a critical role. We’ll explore how running Oracle workloads in Google Cloud creates a variety of solutions, from a Bare Metal Solution to open source and cloud-native databases, to
