





A Breakdown of Cloud-based Data Ingestion Practices

8814
Of your peers have already read this article.
3:00 Minutes
The most insightful time you'll spend today!
Businesses around the globe are realizing the benefits of replacing legacy data silos with cloud-based enterprise data warehouses, including easier collaboration across business units and access to insights within their data that were previously unseen. However, bringing data from numerous disparate data sources into a single data warehouse requires you to develop pipelines that ingest data from these various sources into your enterprise data warehouse. Historically, this has meant that data engineering teams across the organization procure and implement various tools to do so. But this adds significant complexity to managing and maintaining all these pipelines and makes it much harder to effectively scale these efforts across the organization. Developing enterprise-grade, cloud-native pipelines to bring data into your data warehouse can alleviate many of these challenges. But, if done incorrectly, these pipelines can present new challenges that your teams will have to spend their time and energy addressing.
Developing cloud-based data ingestion pipelines that replicate data from various sources into your cloud data warehouse can be a massive undertaking that requires significant investment of staffing resources. Such a large project can seem overwhelming and it can be difficult to identify where to begin planning such a project. We have defined the following principles for data pipeline planning to begin the process. These principles are intended to help you answer key business questions about your effort and begin to build data pipelines that address your business and technical needs. Each section below details a principle of data pipelines and certain factors your teams should consider as they begin developing their pipelines.
Principle 1: Clarify your objectives
The first principle to consider for pipeline development is clarify your objectives. This can be broadly defined as taking a holistic approach to pipeline development that encompasses requirements from several perspectives: technical teams, regulatory or policy requirements, desired outcomes, business goals, key timelines, available teams and their skill sets, and downstream data users. Clarifying your objectives clearly identifies and defines requirements from each key stakeholder at the beginning of the process and continually checks development against these requirements to ensure the pipelines built will meet these requirements.This is done by first clearly defining the desired end state for each project in a way that addresses a demonstrated business need of downstream data users. Remember that data pipelines are almost always the means to accomplish your end state, rather than the end state itself. An example of an effectively defined end-state is “enabling teams to gain a better understanding of our customers by providing access to our CRM data within our cloud data warehouse” rather than “move data from our CRM to our cloud data warehouse”. This may seem like a merely semantic difference, but framing the problem in terms of business needs helps your teams make technical decisions that will best meet these needs.
After clearly defining the business problem you are trying to solve, you should facilitate requirement gathering from each stakeholder and use these requirements to guide the technical development and implementation of your ingestion pipelines. We recommend gathering stakeholders from each team, including downstream data users, prior to development to gather requirements for the technical implementation of the data pipeline. These will include critical timelines, uptime requirements, data update frequency, data transformation, DevOps needs, and security, policy, or regulatory requirements by which a data pipeline must meet.
Principle 2: Build your team
The second principle to consider for pipeline development is build your team. This means ensuring you have the right people with the right skills available in the right places to develop, deploy, and maintain your data pipelines. After you have gathered your pipeline requirements, you can begin to develop a summary architecture that will be used to build and deploy your data pipelines. This will help you identify the human talent you will need to successfully build, deploy, and manage these data pipelines and identify any potential shortfalls that would require additional support from either third-party partners or new team members.
Not only do you need to ensure you have the right people and skill sets available in aggregate, but these individuals need to be effectively structured to empower them to maximize their abilities. This means developing team structures that are optimized for each team’s responsibilities and their ability to support adjacent teams as needed.
This also means developing processes that prevent blockers to technical development whenever possible, such as ensuring that teams have all of the appropriate permissions they need to move data from the original source to your cloud data warehouse without violating the concept of least privilege. Developers need access to the original data source (depending on your requirements and architecture) in addition to the destination data warehouse. Examples of this are ensuring that developers have access to develop and/or connect to a Salesforce Connected App or read access to specific Search Ads 360 data fields.
Principle 3: Minimize time to value
The third principle to consider for pipeline development is minimize time to value. This means considering the long-term maintenance burden of a data pipeline prior to developing and deploying it in addition to being able to deploy a minimum viable pipeline as quickly as possible. Generally speaking, we recommend the following approach to building data pipelines to minimize their maintenance burden: Write as little code as possible. Functionally, this can be implemented by:
1. Leveraging interface-based data ingestion products whenever possible. These products minimize the amount of code that requires ongoing maintenance and empower users who aren’t software developers to build data pipelines. They can also reduce development time for data pipelines, allowing them to be deployed and updated more quickly.
- Products like Google Data Transfer Service and Fivetran allow for managed data ingestion pipelines by any user to centralize data from SaaS applications, databases, file systems, and other tooling. With little to no code required, these managed services enable you to connect your data warehouse to your sources quickly and easily.
- For workloads managed by ETL developers and data engineers, tools like Google Cloud’s Data Fusion provide an easy-to-use visual interface for designing, managing and monitoring advanced pipelines with complex transformations.
2. Whenever interface-based products or data connectors are insufficient, use pre-existing code templates. Examples of this include templates available for Dataflow that allow users to define variables and run pipelines for common data ingestion use cases, and the Public Datasets pipeline architecture that our Datasets team uses for onboarding.
3. If neither of these options are sufficient, utilize managed services to deploy code for your pipelines. Managed services, such as Dataflow or Dataproc, eliminate the operational overhead of managing pipeline configuration by automatically scaling pipeline instances within predefined parameters.
Principle 4: Increase data trust and transparency
The fourth principle to consider for pipeline development is increase data trust and transparency. For the purposes of this document, we define this as the process of overseeing and managing data pipelines across all tools. Numerous data ingestion pipelines that each leverage different tools or are not developed under a coordinated management plan can result in “tech sprawl”, which significantly increases the management overhead of data ingestion pipelines as the quantity of data pipelines increases. This becomes especially cumbersome if you are subject to service-level agreements, or legal, regulatory, or policy requirements for overseeing data pipelines. Preventing tech sprawl is, by far, the best strategy for dealing with it by developing streamlined pipeline management processes that automate reporting. Although this can theoretically be achieved by building all of your data pipelines using a single cloud-based product, we do not recommend doing so because it prevents you from taking advantage of features and cost optimizations that come with choosing the best product for your use case.
A monitoring service such as Google Cloud Monitoring Service or Splunk that automates metrics, events, and metadata collection from various products, including those hosted in on-premise and hybrid computing environments, can help you centralize reporting and monitoring of your data pipelines. A metadata management tool such as Google Cloud’s Data Catalog or Informatica’s Enterprise Data Catalog can help you better communicate the nuances of your data so users better understand which data resources are best fit for a given use case. This significantly reduces your pipeline’s governance burden by eliminating manual reporting processes that often result in inaccuracies or lagging updates.
Principle 5: Manage costs
The fifth principle to consider for pipeline development is manage costs. This encompasses both the cost of cloud resources and the staffing costs necessary to design, develop, deploy, and maintain your cloud resources. We believe that your goal should not necessarily be to minimize cost, but rather maximizing the value of your investment. This means maximizing the impact of every dollar spent by minimizing waste in cloud resource utilization and human time. There are several factors to consider when it comes to managing costs:
- Use the right tool for the job – Different data ingestion pipelines will have different requirements for latency, uptime, transformations, etc. Similarly, different data pipeline tools have different strengths and weaknesses. Choosing the right tool for each data pipeline can help your pipelines operate significantly more efficiently. This can reduce your overall cost, free up staffing time to focus on the most impactful projects, and make your pipelines much more efficient.
- Standardize resource labeling – Implement and utilize a consistent labeling schema across all tools and platforms to have the most comprehensive view of your organization’s spending. One example is requiring all resources to be labeled by the cost center or team at time of creation. Consistent labeling allows you to monitor your spend across different teams and calculate the overall value of your cloud spending.
- Implement cost controls – If available, leverage cost controls to prevent errors that result in unexpectedly large bills.
- Capture cloud spend – Capture your spend on all cloud resource utilization for internal analysis using a cloud data warehouse and a data visualization tool. Without it, you won’t understand the context of changes in cloud spend and how they correlate with changes in business.
- Make cost management everyone’s job – Managing costs should be part of the responsibilities of everyone who can create or utilize cloud resources. To do this well, we recommend making cloud spend reporting more transparent internally and/or implementing chargebacks to internal cost centers based on utilization.
Long-term, the increased granularity in cost reporting available within Google Cloud can help you better measure your key performance indicators. You can shift from cost-based reporting (i.e. – “We spent $X on BigQuery storage last month”) to value-based reporting (i.e. – “It costs $X to serve customers who bring in $Y revenue”).
To learn more about managing costs, check out Google Cloud’s “Understanding the principles of cost optimization” white paper.
Principle 6: Leverage continually improving services
The sixth principle is leverage continually improving services. Cloud services are consistently improving their performance and stability, even if some of these improvements are not obvious to users. These improvements can help your pipelines run faster, cheaper, and more consistently over time. You can take advantage of the benefits of these improvements by:
- Automating both your pipelines and pipeline management: Not only should data pipelines be automated, but almost all aspects of managing your pipelines can also be automated. This includes pipeline/data lineage tracking, monitoring, cost management, scheduling, access management and more. This helps reduce long-term operational costs of each data pipeline that can significantly alter your value proposition and prevent any manual configurations from negating the benefits of later product improvements.
- Minimizing pipeline complexity whenever possible: While ingestion pipelines are relatively easy to develop using UI-based or managed services, they also require continued maintenance as long as they are in use. The most easily maintained data ingestion pipelines are typically the ones that minimize complexity and leverage automatic optimization capabilities. Any transformation in a data ingestion pipeline is a manual optimization of the pipeline that may struggle to adapt or scale as the underlying services improve. You can minimize the need for such transformations by building ELT (extract, load, transform) pipelines rather than ETL (extract, transform, load) pipelines. This pushes transformations down to the data warehouse that is use a specifically optimized query engine to transform your data rather than manually configured pipelines.
Next steps
If you’re looking for more information about developing your cloud-based data platform, check out our Build a modern, unified analytics data platform whitepaper. You can also visit our data integration site to learn more and find ways to get started with your data integration journey.
Once you’re ready to begin building your data ingestion pipelines, learn more about how Cloud Data Fusion and Fivetran can help you make sure your pipelines address these principles.
How Kinguin Notched Up Shopping Experience with Google Recommendations AI

6446
Of your peers have already read this article.
3:00 Minutes
The most insightful time you'll spend today!
Over 2.14 billion people worldwide are expected to buy online this year, according to Statista. Online retail sales will account for 22% of all purchases by 2023. But in a competitive retail landscape, positive interactions can mean the difference between a sale and an abandoned shopping cart.
One of the leading global marketplaces – Kinguin.net is a haven for gamers. Their bustling ecommerce business conducts over 500,000 new transactions monthly. Users will encounter over 50,000 unique digital products, from video games, gift cards, in-game items to computer software and services. With over 10 million registered users, Kinguin improved their experience by helping users find items quickly and deliver service at scale.
Helping customers find what they want, fast
Because of Kinguin’s high volume of users—both buyers and sellers—and breadth of digital products, browsing and shopping can be challenging. “Customers shop online for choice and convenience, but it can sometimes be overwhelming. We want anyone who shops at Kinguin to find what they are looking for quickly and easily,” says Viktor Romaniuk Wanli, Kinguin CEO and Founder.
Today’s retailers know that creating personalized shopping experiences is crucial for establishing and maintaining customer loyalty. Kinguin discovered their users were getting a rather standard retail experience. They wondered how they could offer them a more tailored, personalized experience.
They knew product recommendations were a great way to personalize experiences because they help customers discover products that match their tastes and preferences. But it’s not that easy to recommend products. Various shifting factors make recommendations much more complex:
- Customer behavior. Understanding customers is tough. How do you recommend something to a cold start user who’s never been to your site before? What happens when their behavior changes?
- Omnichannel context. According to Harvard Business Review, 73% of all customers use many channels when they buy. What happens when they go from desktop to mobile or from social media shopping to a proprietary app?
- Product data challenges. How do you recommend new products within a large catalog of items? What if your product data has sparse labeling or unstructured metadata?
Data wasn’t a problem for Kinguin. They had data orders, history, wishlists, and could collect events based on their platform interactions. It was the machine learning model expertise they lacked. So rather than building their own solution, they determined it was more cost effective for them to find a reliable partner. It was also essential that the solution integrated easily with Kubernetes, which enabled their global network.
With these considerations in mind, they applied for the Google Recommendations AI beta program. Kinguin became the first gaming e-commerce platform in Europe to use Recommendations AI when it launched in 2020.
Pro gamer move: using a fully managed AI service
Google Recommendations AI uses algorithms to deliver highly personalized suggestions tailored to a customer’s preferences. Google Cloud based these algorithms on the same research that powers models by YouTube search and Google Shopping. Algorithms are always being tuned and adjusted to focus on individuals themselves—not just items.
Many shopping AIs rely on manually provisioning infrastructure and training machine learning models. Instead, Recommendations AI’s deep learning models use item and user metadata to gain insights. It processes Kinguin’s thousands of products at scale, iterating in real time. First, Kinguin pieces together a customer’s history and shopping journey. Then, using Recommendations AI, they can serve up personalized products—even for long-tail products and cold-start users.
By leveraging internal tools, Kinguin didn’t need to start implementation from scratch. After a few trial sessions with Google Cloud engineers, they got started right away. Due to the fast-paced nature of a marketplace—i.e., price changes, out-of-stock items—Kinguin needed their recommendations to be as close to real time as possible. They used internal event buses to stream events and their product catalog directly to the recommendations API.
Kinguin rolled out in high-traffic areas, including their home page, product page, and category pages. They analyzed heat maps and scroll maps to figure out where to test placements. They also experimented with different recommendation models such as “recently bought together” and “you may like.” Engineers also factored in where they were implementing the models. For example, the “others you might like” model would fit best on the homepage, while “frequently bought together” made sense at checkout.
Understanding how product recommendations influence financials is critical for demonstrating the impact of personalization. Using BigQuery, Kinguin could analyze different cost projection models. BigQuery helped them dig into specific financial data to understand their margins and revenue gains.
Playing to win: enhanced customer experience
Since adopting Recommendations AI, Kinguin has improved both customer experience and satisfaction. Search times have shortened by 20 seconds. Additionally, their average cart value has increased by 5 EUR. Conversion rates have quadrupled since the outset. Click-thru rates have doubled, increasing by 2.16 on product pages and 2.8 times on recommendations pages.
“Google Recommendations AI has helped us evolve our service, increase customer loyalty and satisfaction. It has also contributed to a significant rise in sales,” says Wanli. Kinguin is already thinking about other ways of enhancing user experiences with recommendations. Ideas include their checkout process, other landing pages, and email marketing.
Kinguin’s journey with Google Cloud shows how companies can leverage AI to optimize sales and deliver high-performing, low-latency recommendations to any customer touchpoint.
Learn more about Recommendations AI and Google Cloud AI and machine learning solutions.
Data Culture Integral for Building Data Platforms in EdTech Firms

5019
Of your peers have already read this article.
2:00 Minutes
The most insightful time you'll spend today!
With a data strategy and data warehouse in place, EdTechs are building a data culture that helps everyone – from educators and administrators, to employees in marketing and accounting – make more informed decisions with their data.
So how do you build a data culture in your organization? It starts by asking these questions:
- Are users able to find answers to their data questions from available data?
- Can they act based on available metrics?
- Can they tell a compelling story with the data at hand?
How well is your company using analytics? The matrix from Looker’s Analytical Maturity eBook, shows ranges from “vanity” (nice to see) metrics to “optimization.”

Adopting and rolling out your organization’s new data platform
As outlined in the previous blog in this series, From data chaos to data-driven: How dedicated data teams can help EdTechs influence the future of education, a comprehensive data team is essential for building a data warehouse. That data team should include a core education intelligence team. This team can align with analytically savvy members of each department they support. It’s critical that the Education Intelligence team understand each department’s reporting needs and can make adjustments based on user feedback.
Include these key components to ensure smooth adoption for internal teams:
- Share a roadmap: An effective rollout team always knows what’s next on their roadmap and communicates that to the entire organization. Launching analytics across an entire company at once usually leads to slow movement, miscommunication, and lack of adoption. A roadmap will ease this transition.
- Train everyone: This approach makes sure everyone is consistent during the data rollout. Show users how to make the most of the platform your data team has created, and be sure they know where they can go for help.
- Monitor and optimize: Monitor your organization’s analytics usage. Understand which individuals are using your education intelligence system to drive their day-to-day operations. These individuals can provide further insight into what is working. Identifying those who may need more guidance and support ensures they don’t miss out on benefits.
Guild Education: Creating a data culture
Guild Education started working with Google Cloud to build a data culture and implemented Looker as their data platform.
The company transformed their student success program—in which coaches work directly with connected employees throughout their educational journey—with Looker. “As enrollments increased, even spreadsheets were not able to accurately keep track of caseloads,” Sean McKeever, Senior Business Intelligence Analyst, recalls. “We needed a singular source of truth that could be updated in almost real-time.” In response, they created “Student Rosters” to manage a coach’s student outreach.
Users were thrilled with the new tools, and when the coaching team grew from 20 to 90, Sean created ambassador groups consisting of data specialists to support each department. This sparked Guild Education’s “data-driven evolution.”
“Unexpectedly, the Student Success task force also became an engine for new BI work,” Sean says. “They blew my highest expectations out of the water and started owning virtually the entire process: building requirements, prototyping, testing, and deploying new dashboards and panels—with hardly any help from the BI team.”
These successes have set Guild Education on its way to becoming a fully data-driven company. Unexpectedly, the Student Success task force also became an engine for new BI work…they blew my highest expectations out of the water and started owning virtually the entire process…with hardly any help from the BI team.
Sean McKeever
Senior Business Intelligence Analyst, Guild Education
Start your journey from data chaos to data-driven
We hope this three-part series has shown how data analytics has an important role to play in transforming the future of education. EdTech companies are unlocking the power of big data to serve their customers. “The education landscape is changing rapidly, and EdTech has a major role to play as institutions adapt to the massive shift in learners’ preferences and expectations,” says Jesus Trujillo Gomez, Strategic Business Executive, Education & Research, Google Cloud.
Feeling inspired? Let’s meet your EdTech challenges together and transform your data culture. Visit Google Cloud for education technology.
Google Cloud Data Heroes Series: Honoring Data Practitioner’s Journey and Learning with GCP

4961
Of your peers have already read this article.
4:00 Minutes
The most insightful time you'll spend today!
Google Cloud Data Heroes is a series where we share stories of the everyday heroes who use our data analytics tools to do amazing things. Like any good superhero tale, we explore our Google Cloud Data Heroes’ origin stories, how they moved from data chaos to a data-driven environment, what projects and challenges they are overcoming now, and how they give back to the community.
For our first issue, we couldn’t be more excited to introduce Google Cloud Data Heroine Lynn Langit. Lynn is a seasoned business woman in Minnesota beginning her eleventh year as the Founder of her own consulting business, Lynn Langit Consulting LLC. Lynn wears many data professional hats including Cloud Architect, Developer, and Educator. If that wasn’t already a handful, she also loves riding her bike at any given season of the year (pictured on the right), which you might imagine gets a bit challenging when you have to invest in bike studded snow tires!

Tell us how you got to be a data practitioner. What was that experience like and how did this journey bring you to GCP?
I worked on the business side of tech for many years. While I enjoyed my work, I found I was intrigued by the nuanced questions practitioners could ask – and the sophisticated decisions they could make – once they unlocked value from their data. This initial intrigue developed into a strong curiosity and I ultimately made the switch from business worker to data practitioner over 15 years ago. This was a huge change in career considering I got my bachelor’s degree in Linguistics and German. And so I started small. I taught myself most everything both at the beginning and even now through online resources, courses, and materials. I began with database and data warehousing, specifically building and tuning many enterprise databases. It wasn’t until Hadoop/NoSQL became available that I pivoted to Big Data…
Back then, I supplemented my self-paced learning with Microsoft technologies, even earning all Microsoft certifications in just one year. When I noticed the industry shifting from on premise to cloud, I shifted my learning from programming to cloud, too. I have been working in the public cloud for over ten years already!
“I started with AWS, but recently I have been doing most everything in GCP. I particularly love implementing data pipelining, data ops, and machine learning.”
How did you supplement your self teachings with Google Cloud data upskilling opportunities like product deep dives and documentation, courses, skills, and certificates?
One of the first Google Cloud data analytics products I fell in love with was BigQuery. BigQuery was my gateway product into a much larger open, intelligent, and unified data platform full of products that combined data analytics, databases, AI/ML, and business intelligence.
I’ve achieved Skills Badges in BigQuery, Data Analysis, and more. I’ve also achieved Google’s Professional Data Engineer Certification, and have been a Google Developer Expert since 2012.
Most recently, I was named one of few Data Analysis Innovator Champions within the Google Cloud Innovators Program, which I’m particularly excited about because I’ve heard it’s a coveted spot for data practitioners and necessitates a Googler nomination to move from the Innovator membership to Champion title!
You’re undoubtedly a data analytics thought leader in the community. When did you know you moved from data student to data master and what data project are you most excited about?
I knew I had graduated, if you will, to the data architect realm once I was able to confidently do data work that matters, even if that work was outside of my usual domains: adTech and finTech..
For example, my work over the past few years has been around human health outcomes, including combatting the COVID-19 pandemic. I do this by supporting scientists and bioinformatic researchers with genomic-scale data pipelines. Did I know anything about genomics before I started? Not at all! I self-studied bioinformatics and recorded my learnings on GitHub. Along the way I adopted my learnings into an open source GCP course on GitHub aimed at researchers who are new to working with GCP. What’s cool about the course is that I begin from the true basics of how to set up a GCP account. Then I gradually work up to mapping out genomic-scale data workflows, pipelines, analyses, batch jobs, and more using BigQuery and a host of other Google Cloud data products.
Now, I’ve received feedback that this repository has made a positive impact on researchers’ ability to process and synthesize enormous amounts of data quickly. Plus, it achieves the greater goal of broadening accessibility to a public cloud like GCP.
In what ways do you think you uniquely bring value back to the data community? Why is it important to you to give back to the data community?
I stay busy always sharing my learnings back to the community. I record Cloud and Big data technical screencasts (demos) on Youtube, I’ve authored 25 data and cloud courses on LinkedIn Learning, and I occasionally write Medium articles on cloud technology and random thoughts I have about everyday life. I’m also the cofounder of Teaching Kids Programming, with a mission to help equip middle and high school teachers with a great programming curriculum on Java.
Begin your own hero’s journey
Ready to embark on your Google Cloud data adventure? Begin your own hero’s journey with GCP’s recommended learning path where you can achieve badges and certifications along the way. Join the Cloud Innovators program today to stay up to date on more data practitioner tips, tricks, and events.
Connect with Google’s data community at our upcoming virtual event “Latest Google Cloud data analytics innovations”. Register and save your spot now to get your data questions answered live by GCP’s top data leaders and watch demos from our latest products and features including BigQuery, Dataproc, Dataplex, Dataflow, and more. Lynn will take the main stage as an emcee for this event – you won’t want to miss!
Finally, if you think you have a good Data Hero story worth sharing, please let us know! We’d love to feature you in our series as well.

3501
Of your peers have already downloaded this article
19:30 Minutes
The most insightful time you'll spend today!
While data has influenced major business decisions throughout the ages, the term “data warehouse” isn’t even half a century old. But it’s an important concept; by centralizing data from many disparate sources, analysts can make more informed decisions. Traditionally, this has meant collecting data in on-premises infrastructure. But as data volumes have grown, these legacy systems have not been able to keep up with changing demands: They are difficult to scale, offer no support for machine learning and artificial intelligence initiatives, and are simply too expensive to maintain.
With increased advances in technology, the introduction of more cost-effective compute and storage options have changed the data warehouse landscape. Now more than ever, businesses need an agile and efficient analytics infrastructure that allows them to derive insights at a fraction of the cost of legacy systems. Modern data warehouses can give organizations the competitive edge, offering customers fast and easy access to business intelligence while seamlessly scaling to meet increased demands.
In this ebook, based on the keynote presentation featuring Forrester Analyst Michele Goetz at the 2019 Future of Your Data Warehouse digital conference, we’ll look at the evolution of data warehousing and how a cloud infrastructure can offer immense benefits for the future.
Google Cloud Next 21 for Data Analytics Unplugged

4943
Of your peers have already read this article.
4:30 Minutes
The most insightful time you'll spend today!
October 23rd (this past Saturday!) was my 4th Googlevarsery and we are wrapping an incredible Google Next 2021!
When I started in 2017, we had a dream of making BigQuery Intelligent Data Warehouse that would power every organization’s data driven digital transformation.
This year at Next, It was amazing to see Google Cloud’s CEO, Thomas Kurian, kick off his keynote with CTO of WalMart, Suresh Kumar , talking about how his organization is giving its data the “BigQuery treatment”.
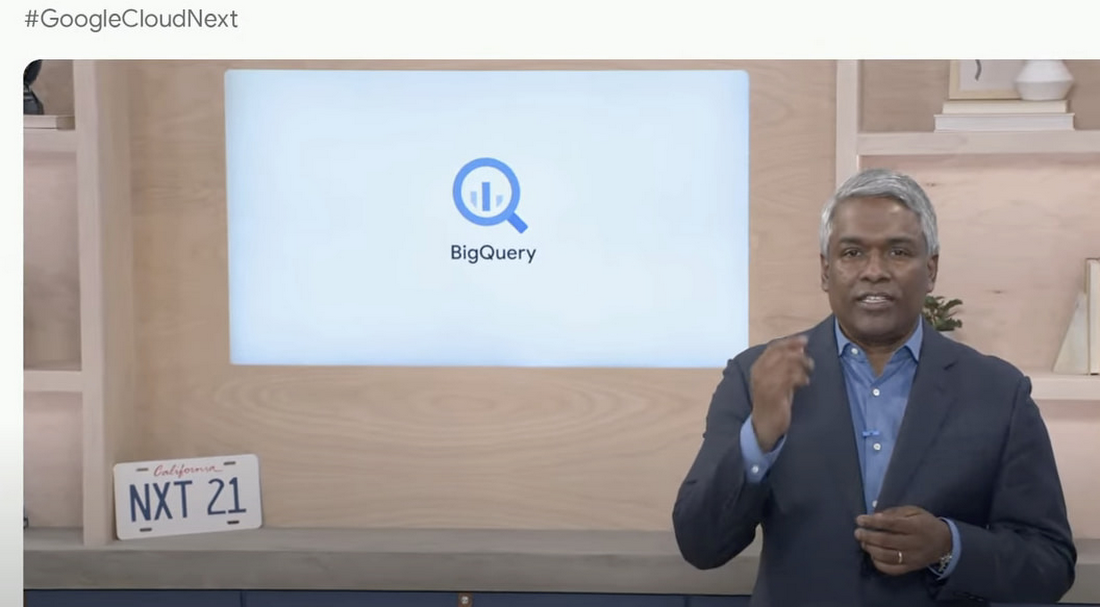
AS I recap Next 2021 and reflect on our amazing journey over the past 4 years, I’m so proud of the opportunity I’ve had to work with some of the world’s most innovative companies from Twitter to Walmart to Home Depot, Snap, Paypal and many others.
So much of what we announced at Next is the result of years of hard work, persistence and commitment to delivering the best analytics experience for customers.
I believe that one of the reasons why customers choose Google for data is because we have shown a strong alignment between our strategy and theirs and because we’ve been relentlessly delivering innovation at the speed they require.
Unified Smart Analytics Platform
Over the past 4 years our focus has been to build industries leading unified smart analytics platforms. BigQuery is at the heart of this vision and seamlessly integrates with all our other services. Customers can use BigQuery to query data in BigQuery Storage, Google Cloud Storage, AWS S3, Azure Blobstore, various databases like BigTable, Spanner, Cloud SQL etc. They can also use any engine like Spark, Dataflow, Vertex AI with BigQuery. BigQuery automatically syncs all its metadata with Data Catalog and users can then run a Data Loss Prevention service to identify sensitive data and tag it. These tags can then be used to create access policies.
In addition to Google services, all our partner products also integrate with BigQuery seamlessly. Some of the key partners highlighted at Next 21 included Data Ingestion (Fivetran, Informatica & Confluent), Data preparation (Trifacta, DBT), Data Governance (Colibra), Data Science (Databricks, Dataiku) and BI (Tableau, PowerBI, Qlik etc).
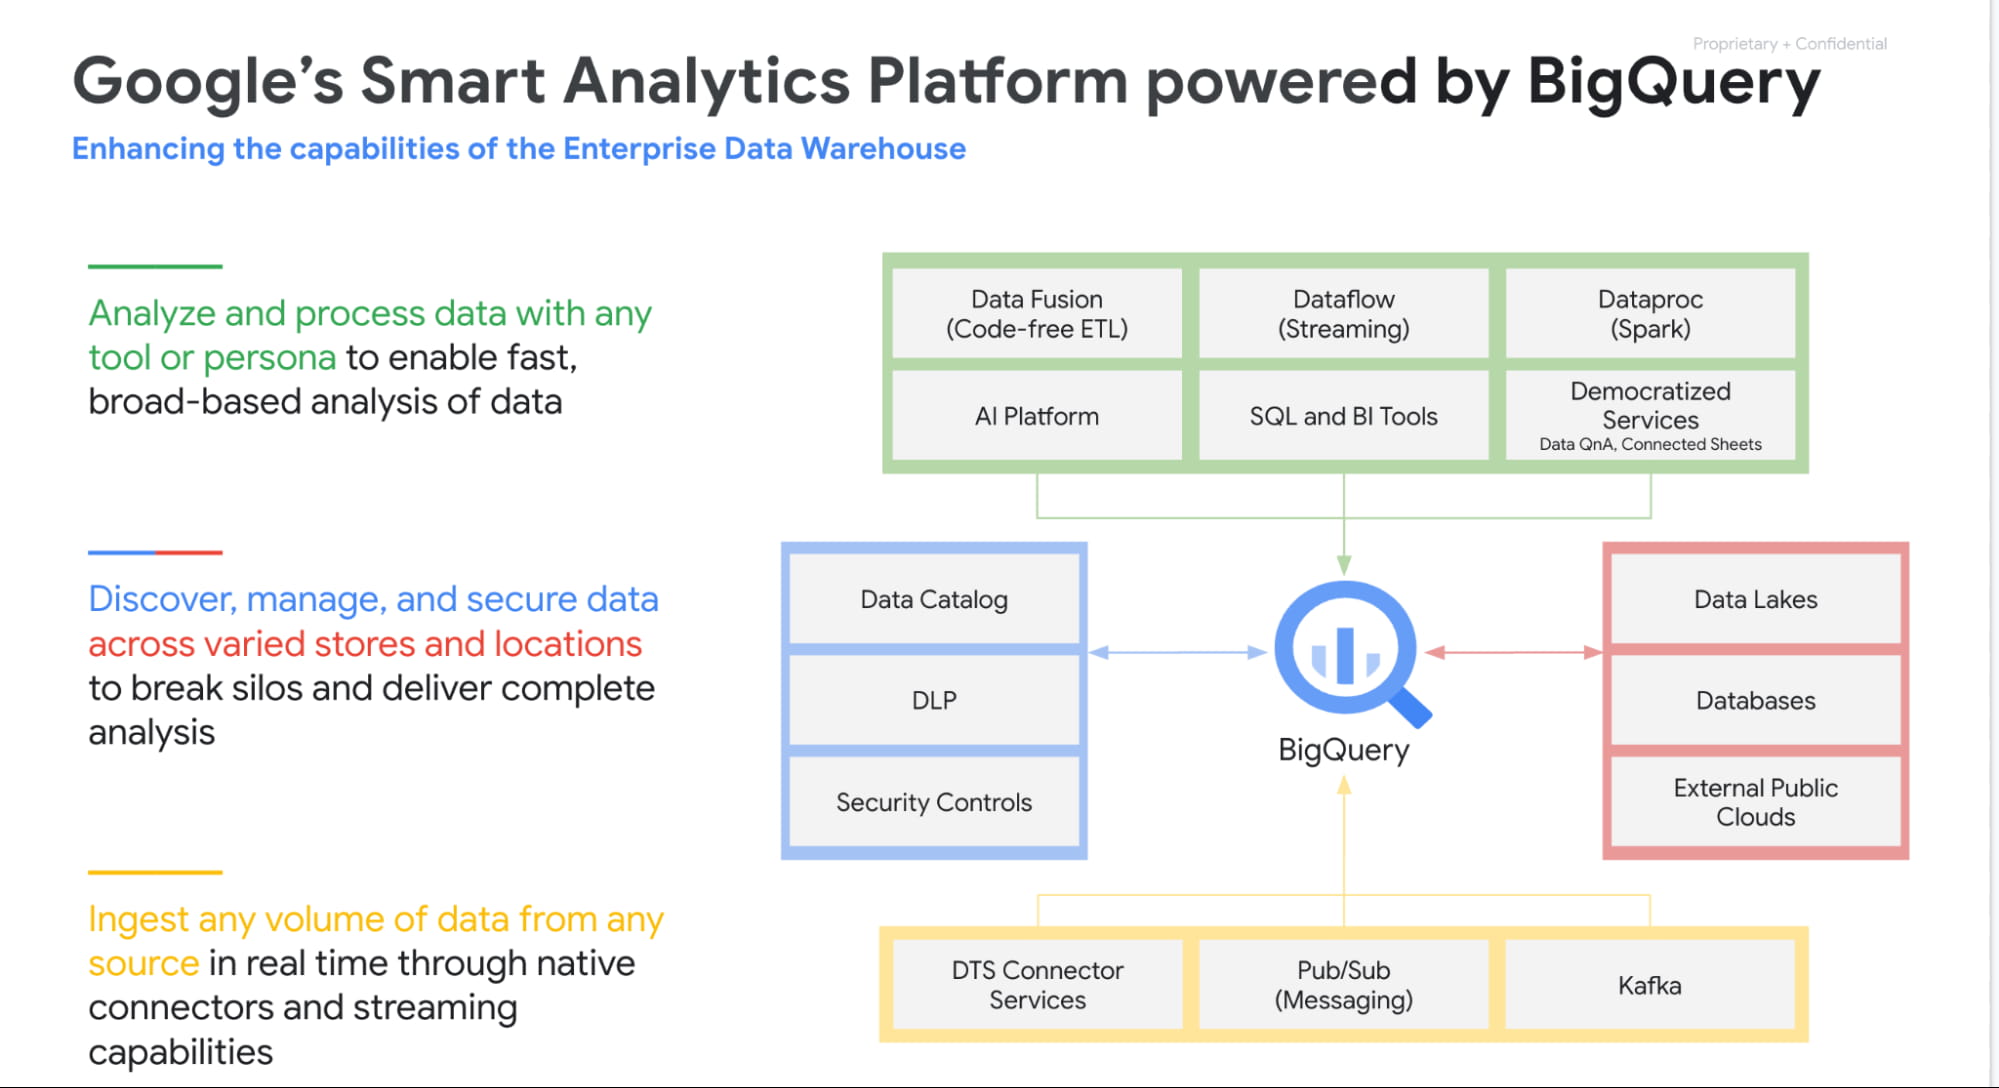
Planet Scale analytics with BigQuery
BigQuery is an amazing platform and over the past 11 years we have continued to innovate in various aspects. Scalability has always been a huge differentiator for BigQuery. BigQuery has many customers with more than 100 petabytes of data and our largest customer is now approaching an exabyte of data. Our large customers have run queries over trillions of rows.
But scale for us is not just about storing or processing a lot of data. Scale is also how we can reach every organization in the world. This is the reason we launched BigQuery Sandbox which enables organizations to get started with BigQuery without a credit card. This has enabled us to reach tens of thousands of customers. Additionally to make it easy to get started with BigQuery we have built integrations with various Google tools like Firebase, Google Ads, Google Analytics 360, etc.
Finally, to simplify adoption we now provide options for customers to choose whether they would like to pay per query, buy flat rate subscriptions or buy per second capacity. With our autoscaling capabilities we can provide customers best value by mixing flat rate subscription discounts with auto scaling with flex slots.
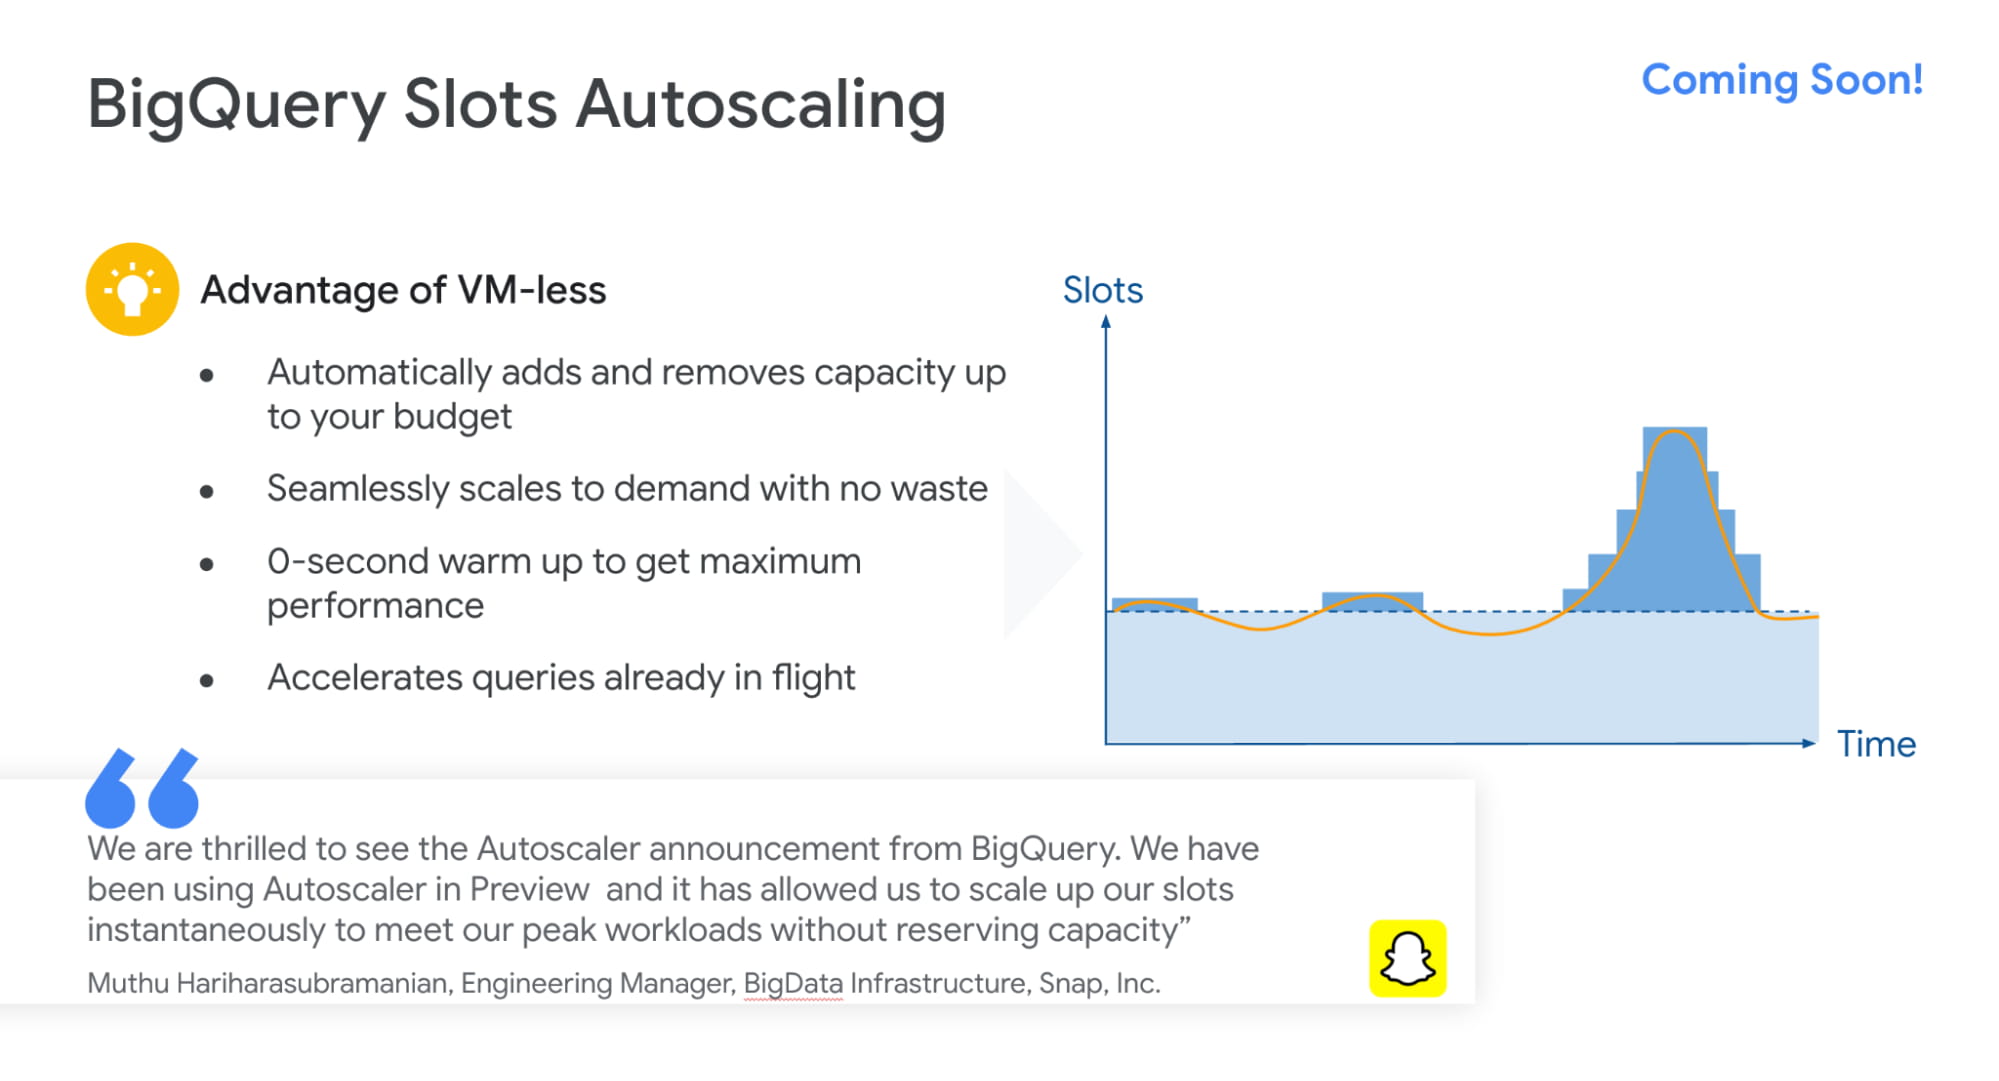
Intelligent Data Warehouse to empower every data analyst to become a data scientist
BigQuery ML is one of the biggest innovations that we have brought to market over the past few years. Our vision is to make every data analyst a data scientist by democratizing Machine learning. 80% of time is spent in moving, prepping and transforming data for the ML platform. This also causes a huge data governance problem as now every data scientist has a copy of your most valuable data. Our approach was very simple. We asked:”what if we could bring ML to data rather than taking data to an ML engine?”
That is how BigQuery ML was born. Simply write 2 lines of SQL code and create ML models.
Over the past 4 years we have launched many models like regression, matrix factorization, anomaly detection, time series, XGboost, DNN etc. These models are used by customers to solve complex business problems simply from segmentation, recommendations, time series forecasting, package delivery estimation etc. The service is very popular: 80%+ of our top customers are using BigQueryML today. When you consider that the average adoption rate of ML/AI is in the low 30%, 80% is a pretty good result!

We announced tighter integration of BQML with Vertex AI. Model explainability will provide the ability to explain the results of predictive ML classification and regression models by understanding how each feature contributes to the predicted result. Also users will be able to manage, compare and deploy BigQuery ML models in Vertex; leverage Vertex Pipelines to train and predict BigQuery ML models.
Real-time streaming analytics with BigQuery
Customer expectations are changing and everyone wants everything in an instant: according to Gartner, by the end of 2024, 75% of enterprises will shift from piloting to operationalizing AI, driving a 5X increase in streaming data and analytics infrastructures.
The BigQuery’s storage engine is optimized for real-time streaming. BigQuery supports streaming ingestion of 10s of millions of events in real-time and there is no impact on query performance. Additionally customers can use materialized views and BI Engine (which is now GA) on top of streaming data. We guarantee always fast, always fresh data. Our system automatically updates MVs and BI Engine.
Many customers also use our PubSub service to collect real-time events and process these through Dataflow prior to ingesting into BigQuery. This is a streaming ETL pattern which is very popular. Last year,we announced PubSub Lite to provide customers with a 90% lower price point and aTCO that is lower than any DIY Kafka deployment.
We also announced Dataflow Prime, it is our next generation platform for Dataflow. Big Data processing platforms have only focused on horizontal scaling to optimize workloads. But we have seen new patterns and use cases like streaming AI where you may have a few steps in pipelines that perform data prep and then customers have to run a GPU based model. Customers want to use different sizes and shapes of machines to run these pipelines in the most optimum manner. This is exactly what Dataflow Prime does. It delivers vertical auto scaling with the right fitting for your pipelines. We believe this should lower costs for pipelines significantly.
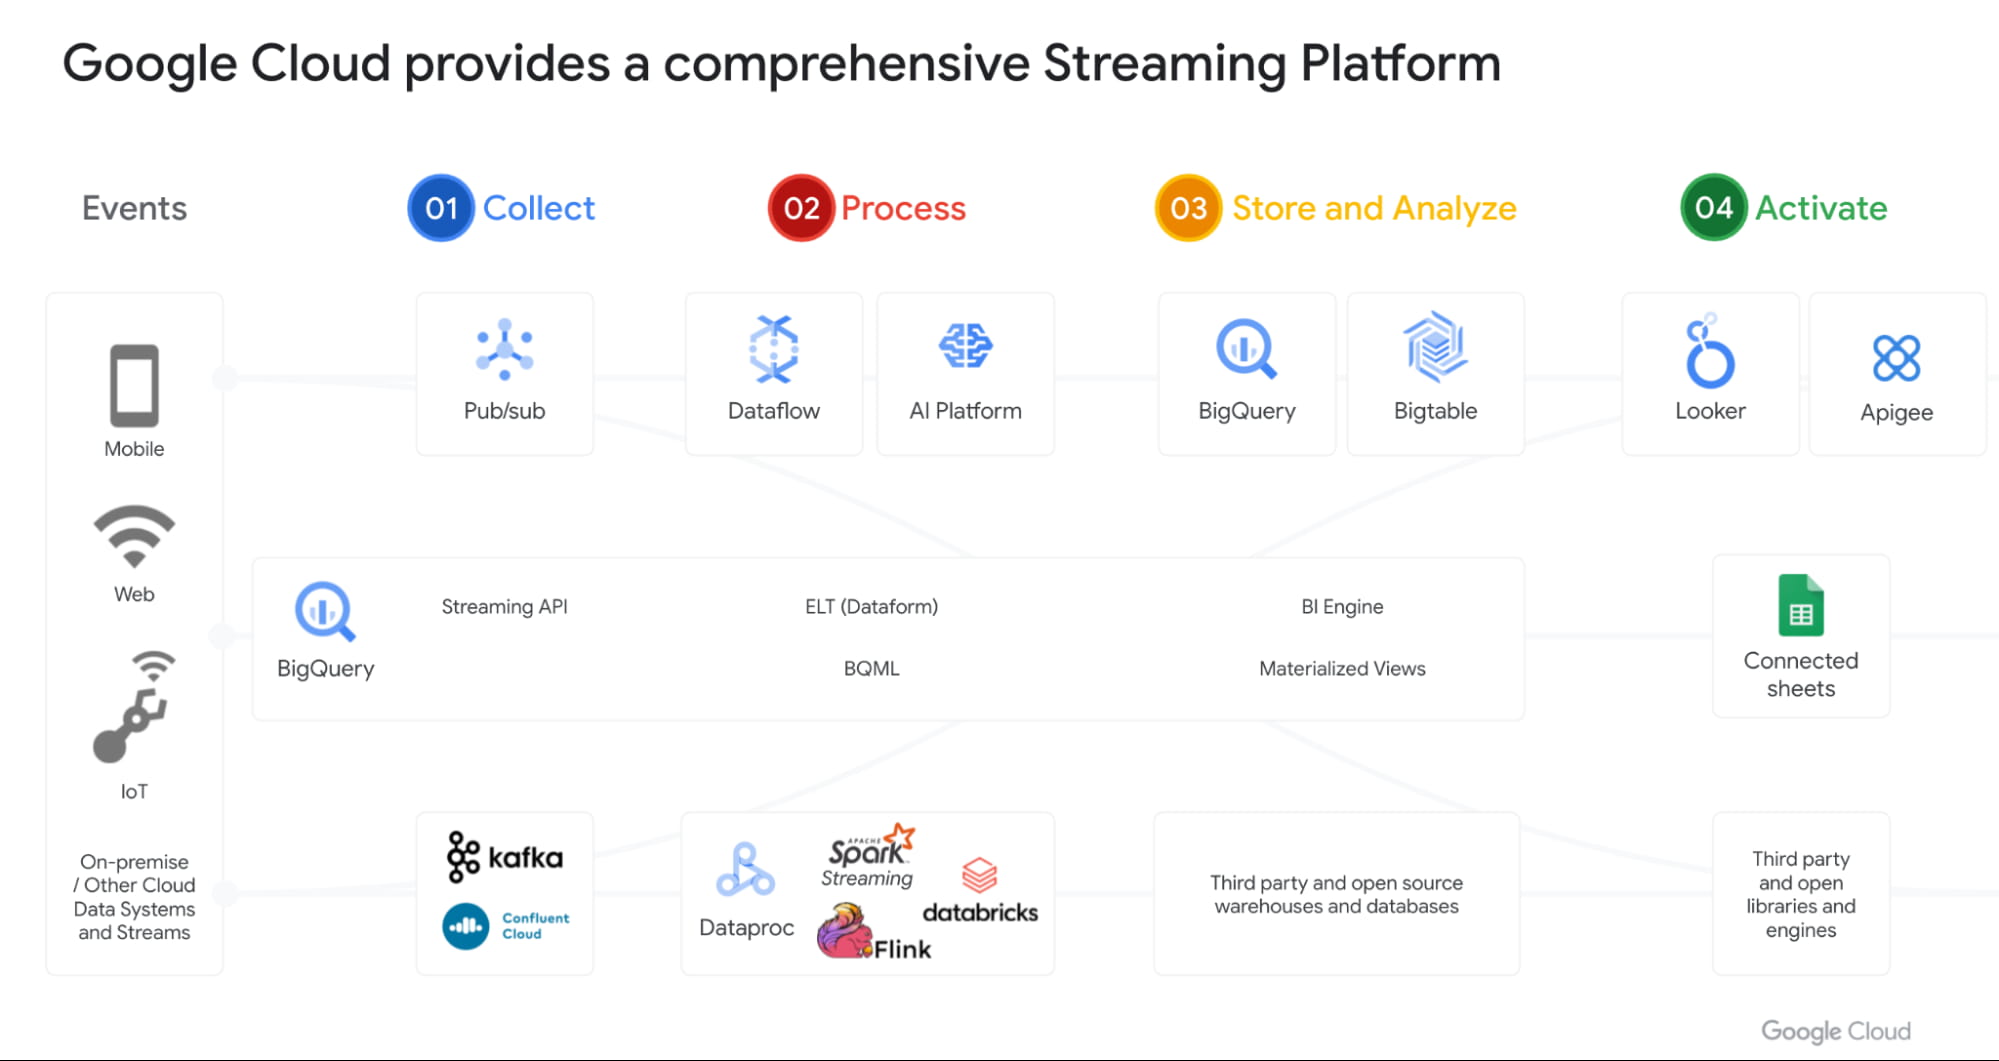
With Datastream as our change data capture service (built on Alooma technology), we have solved the last key problem space for customers. We can automatically detect changes in your operational databases like MySQL, Postgres, Oracle etc and sync them in BigQuery.
Most importantly, all these products work seamlessly with each other through a set of templates. Our goal is to make this even more seamless over next year.
Open Data Analytics with BigQuery
Google has always been a big believer in Open Source initiatives. Our customers love using various open source offerings like Spark, Flink, Presto, Airflow etc. With Dataproc & Composer our customers have been able to run various of these open source frameworks on GCP and leverage our scale, speed and security. Dataproc is a great service and delivers massive savings to customers moving from on-prem Hadoop environments. But customers want to focus on jobs and not clusters.
That’s why we launched Dataproc Serverless Spark (GA) offering at Next 2021. This new service adheres to one of our key design principles we started with: make data simple.
Just like with BigQuery, you can simply RUN QUERY. With Spark on Google Cloud, you simply RUN JOB. ZDNet did a great piece on this. I invite you to check it out!
Many of our customers are moving to Kubernetes and wanted to use that as the platform for Spark. Our upcoming Spark on GKE offering will give the ability to deploy spark workloads on existing Kubernetes clusters.
But for me the most exciting capability we have is, the ability to run Spark directly on BigQuery Storage. BigQuery storage is highly optimized analytical storage. By running Spark directly on it, we again bring compute to data and avoid moving data to compute.
BigSearch to power Log Analytics
We are bringing the power of Search to BigQuery. Customers already ingest massive amounts of log data into BigQuery and perform analytics on it. Our customers have been asking us for better support for native JSON and Search. At Next 21 we announced the upcoming availability of both these capabilities.
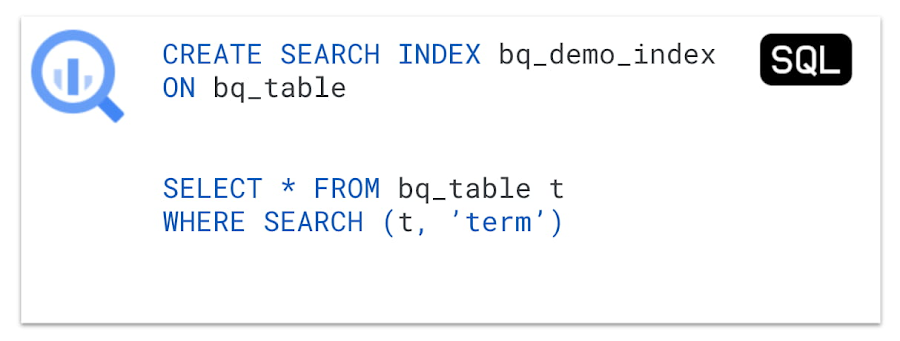
Fast cross column search will provide efficient indexing of structured, semi-structured and unstructured data. User friendly SQL functions let customers rapidly find data points without having to scan all the text in your table or even know which column the data resides in.
This will be tightly integrated with native JSON, allowing customers to get BigQuery performance and storage optimizations on JSON as well as search on unstructured or constantly changing data structures.
Multi & Cross Cloud Analytics
Research on multi cloud adoption is unequivocal — 92% of businesses in 2021 report having a multi cloud strategy. We have always believed in providing customers choice to our customers and meeting them where they are. It was clear that all our customers wanted us to take our gems like BigQuery to other clouds as their data was distributed on different clouds.
Additionally it was clear that customers wanted cross cloud analytics not multi-cloud solutions that can just run in different clouds. In short, see all their data with a single pane of glass, perform analysis on top of any data without worrying about where it is located, avoid egress costs and finally perform cross cloud analysis across datasets on different clouds.
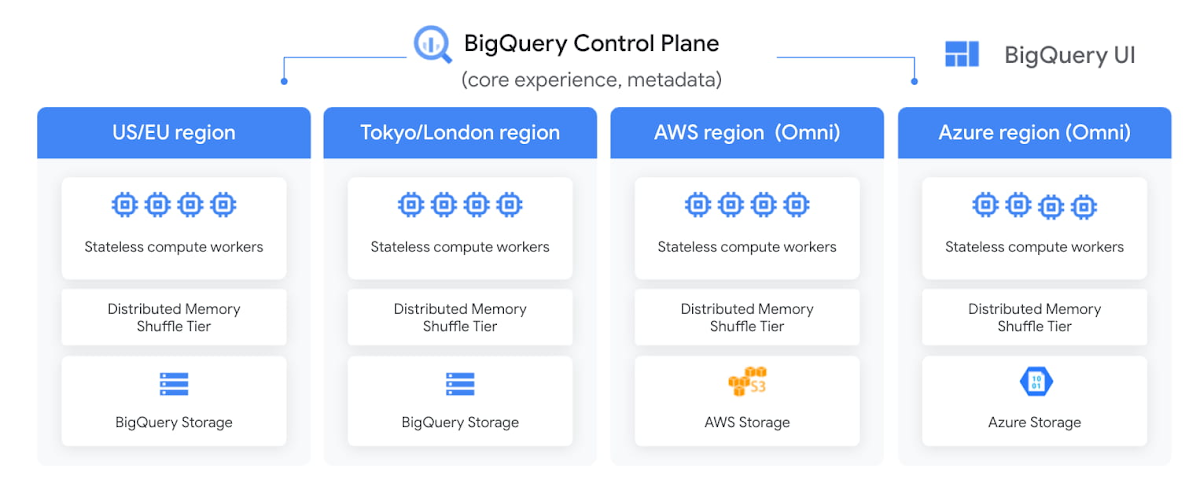
With BigQuery Omni, we deliver on this vision, with a new way of analyzing data stored in multiple public clouds. Unlike competitors, BigQuery Omni does not create silos across different clouds. BigQUery provides a single control plane that shows an analyst all data they have access to across all clouds. Analyst just writes the query and we send it to the right cloud across AWS, Azure or GCP to execute it locally. Hence no egress costs are incurred.
We announced BQ Omni GA for both AWS and Azure at Google Next 21 and I’m really proud of the team for delivering on this vision. Check out Vidya’s session and learn from Johnson and Johnson how they innovate in a multi-cloud world.
Geospatial Analytics with BigQuery and Earth Engine
We have partnered with our Google Geospatial team to deliver GIS functionality inside BigQuery over the years. At Next we announced that customers will be able to integrate Earth Engine with BigQuery, Google Cloud’s ML technologies, and Google Maps Platform.
Think about all the scenarios and use-cases your team’s going to be able to enable sustainable sourcing, saving energy or understanding business risks.
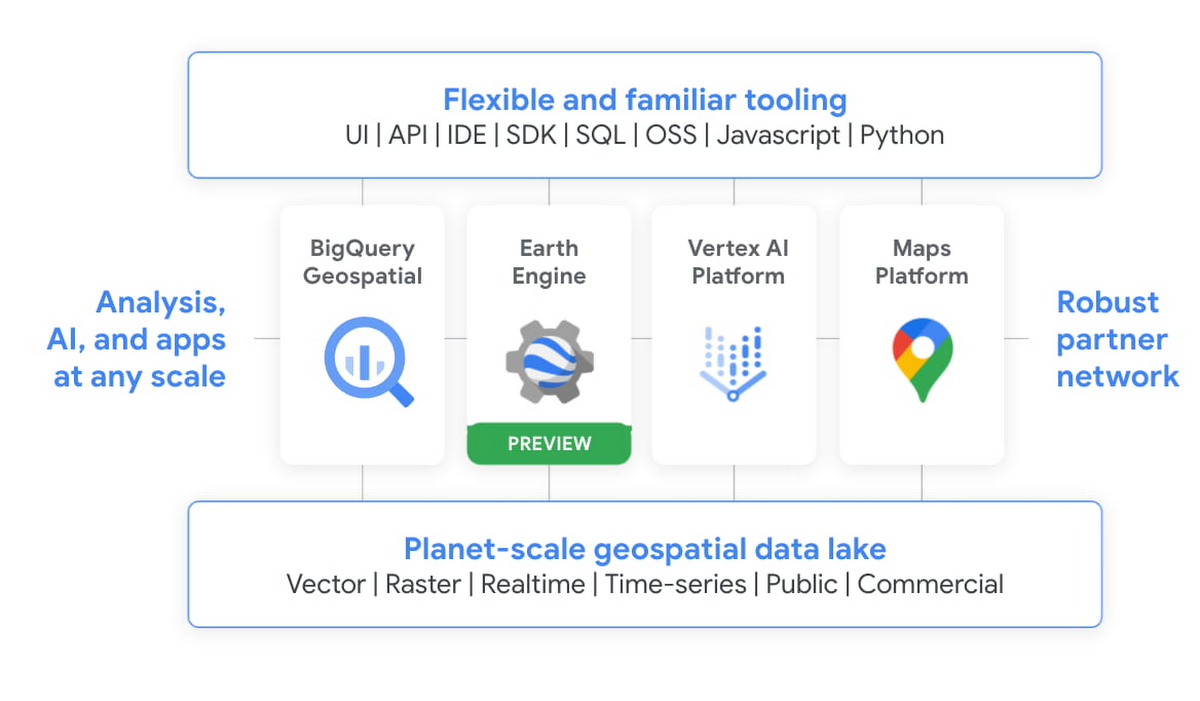
We’re integrating the best of Google and Google Cloud together to – again – make it easier to work with data to create a sustainable future for our planet.
BigQuery as a Data Exchange & Sharing Platform
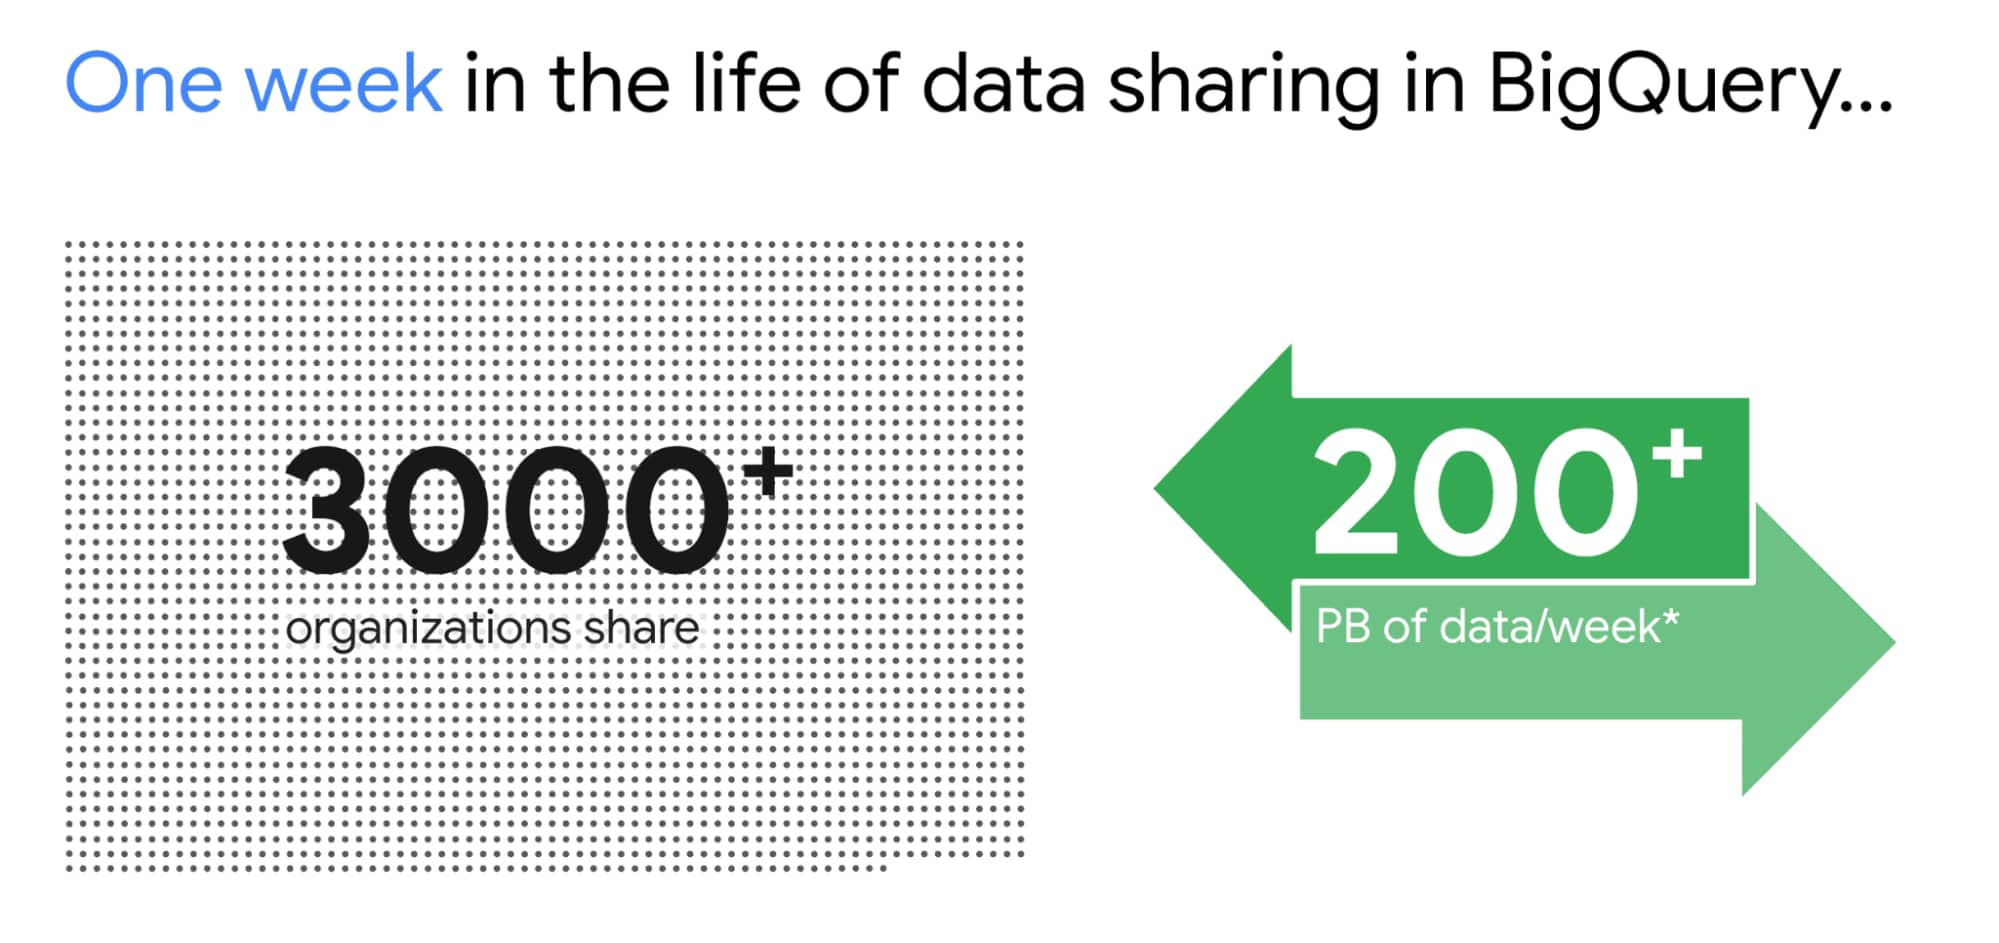
BigQuery was built to be a sharing platform. Today we have 3000+ organizations sharing more than 250 petabytes of data across organizations. Google also brings more than 150 public datasets to be used across various use cases. In addition to this, we are also bringing some of the most unique datasets like Google Trends to BigQuery. This will enable organizations to understand in real-time trends and apply to their business problems.
I am super excited about the Analytics Hub Preview announcement. Analytics Hub will provide the ability for organizations to build private and public analytics exchanges. This will include data, insights, ML Models and visualizations. This is built on top of the industry leading security capabilities of BigQuery.

Breaking Data Silos
Data is distributed across various systems in the organization and making it easy to break the data silo and make all this data accessible to all is critical. I’m also particularly excited about the Migration Factory we’re building with Informatica and the work we are doing for data movement, intelligent data wrangling with players like Trifacta and FiveTran, with whom we share over 1,000 customers (and growing!). Additionally we continue to deliver native Google service to help our customers.
We acquired Cask in 2018 and launched our self service Data Integration service in Data Fusion. Now Fusion allows customers to create complex pipelines with just simple drag and drop. This year we focused on unlocking SAP data for our customers. We have launched various SAP connectors and accelerators to achieve this.
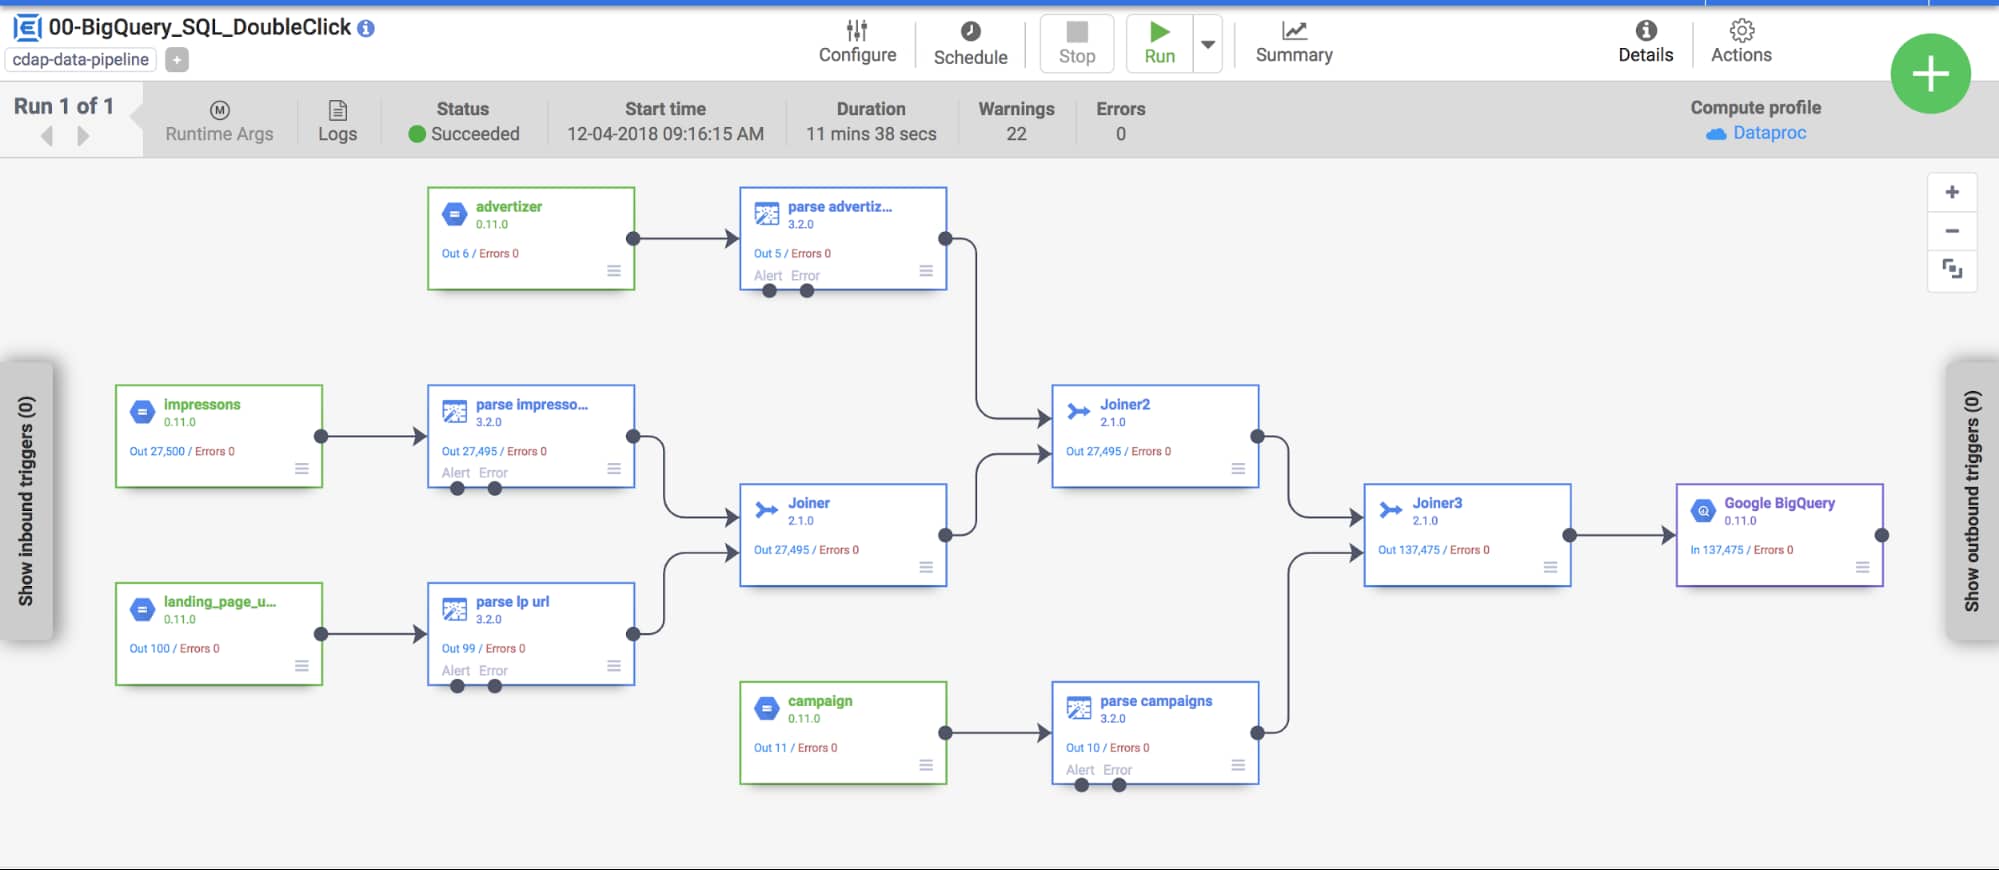
At GCP Next we also announced our BigQuery Migration service in preview. Many of our customers are migrating their legacy data warehouses and data lakes to BigQuery. BigQuery Migration Service provides end-to-end tools to simplify migrations for these customers.
And today, to make migrations to BigQuery easier for even more customers, I am super excited to announce the acquisition of CompilerWorks. CompilerWorks’ Transpiler is designed from the ground up to facilitate SQL migration in the real world and will help our customers accelerate their migrations. It supports migrations from over 10 legacy enterprises data warehouses and we will be making it available as part of our BigQuery Migration service in the coming months.
Data Democratization with BigQuery
Over the past 4 years we have focused a lot on making it very easy to derive actionable insights from data in BigQuery. Our priority has been to provide a strong ecosystem of partners that can provide you with great tools to achieve this but also deliver native Google capabilities.
With our BI engine GA announcement which we introduced in 2019, previewed earlier this year and showcased with tools like Microsoft PowerBI and Tableau, is now available for all to play with.

BigQuery + Data Studio are like peanut butter and Jelly. They just work well together. We launched BI Engine first with Data Studio and scaled it to all the users. More than 40% of our BigQuery customers use Data Studio. Once we knew BI Engine works extremely well we now have made it an integral part of BigQuery API and launched it for all our internal and partner BI tools.
We announced GA for BI Engine at Next 2021 but we were already GA with Data Studio for the past 2 years. We recently moved the Data Studio team back into Google Cloud making the partnership even stronger. If you have not used Data Studio, I encourage you to take a look and get started for free today here!!
Connected Sheets for BigQuery is one of my favorite combinations. You can give every business user in your organization the ability to analyze billions of records using standard Google Sheets experience. I personally use it everyday to analyze all our product data.
We acquired Looker in Feb 2020 with a vision of providing a semantic modeling layer to our customers with a governed BI solution. Looker is tightly integrated with BigQuery including BigQuery ML. Our latest partnership with Tableau where Tableau customers will soon be able to leverage Looker’s semantic model, enabling new levels of data governance while democratizing access to data.
Finally, I have a dream that one day we will bring Google Assistant to your enterprise data. This is the vision of Data QnA. We are in early innings on this and we will continue to work hard to make this vision a reality.
Intelligent Data Fabric to unify the platform
Another important trend that shaped our market is the Data Mesh. Earlier this year, Starburst invited me to talk about this very topic. We have been working for years on this concept, and although we would love for all data to be neatly organized in one place, we know that our customers’ reality is that it is not (If you want to know more about this, read about my debate on this topic with Fivetran’s George Fraser, a16z’s Martin Casado and Databricks’ Ali Ghodsi).
Everything I’ve learned from customers over my years in this field is that they don’t just need a data catalog or a set of data quality and governance tools, they need an intelligent data fabric. That is why we created Dataplex, whose general availability we announced at Next.
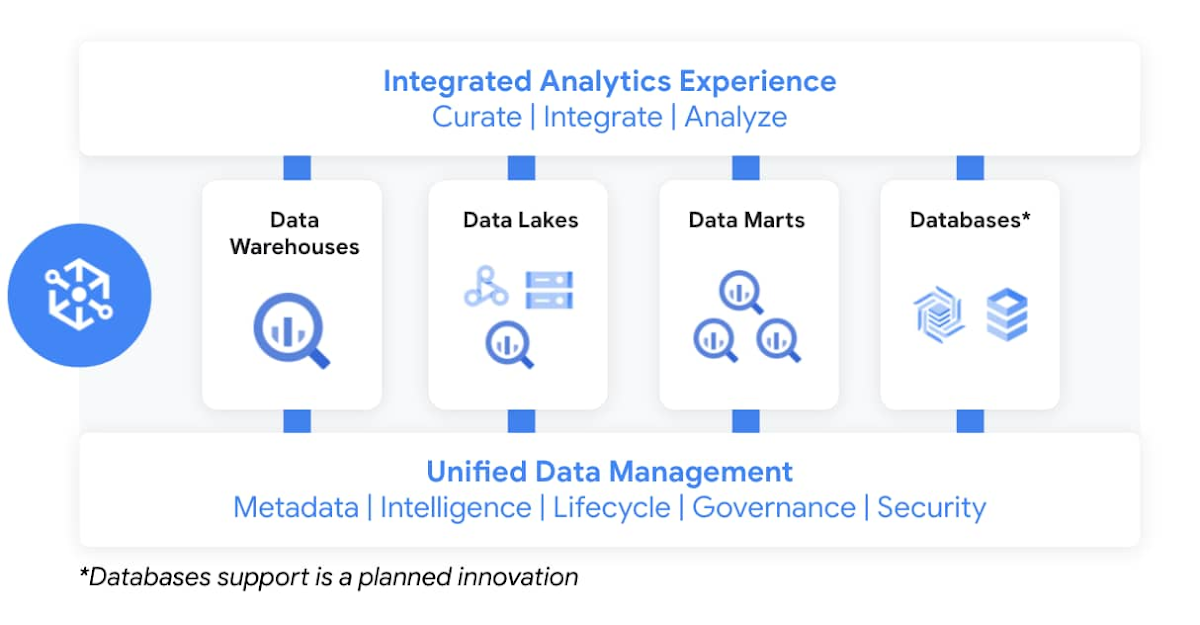
Dataplex enables customers to centrally manage, monitor, and govern data across data lakes, data warehouses, and data marts, while also ensuring data is securely accessible to a variety of analytics and data science tools. It lets customers organize and manage data in a way that makes sense for their business, without data movement or duplication. It provides logical constructs – lakes, data zones, and assets – which enable customers to abstract away the underlying storage systems to build a foundation for setting policies around data access, security, lifecycle management, and so on. Check out Prajakta Damle’s session and learn from Deutsche Bank how they are thinking about a unified data mesh across distributed data.
Closing Thoughts
Analysts have recognized our momentum and, as I look back at this year, I couldn’t thank our customers and partners enough for the support they provided my team and I across our large Data Analytics portfolio: in March, Google BigQuery was named a Leader in The Forrester Wave™: Cloud Data Warehouse, Q1 2021. And in June, Dataflow was named a Leader in The Forrester Wave™: Streaming Analytics, Q2 2021 report.
If you want to get a taste for why customers choose us over other hyperscalers or cloud data warehousing, I suggest you watch the Data Journey series we’ve just launched, which documents the stories of organizations modernizing to the cloud with us.
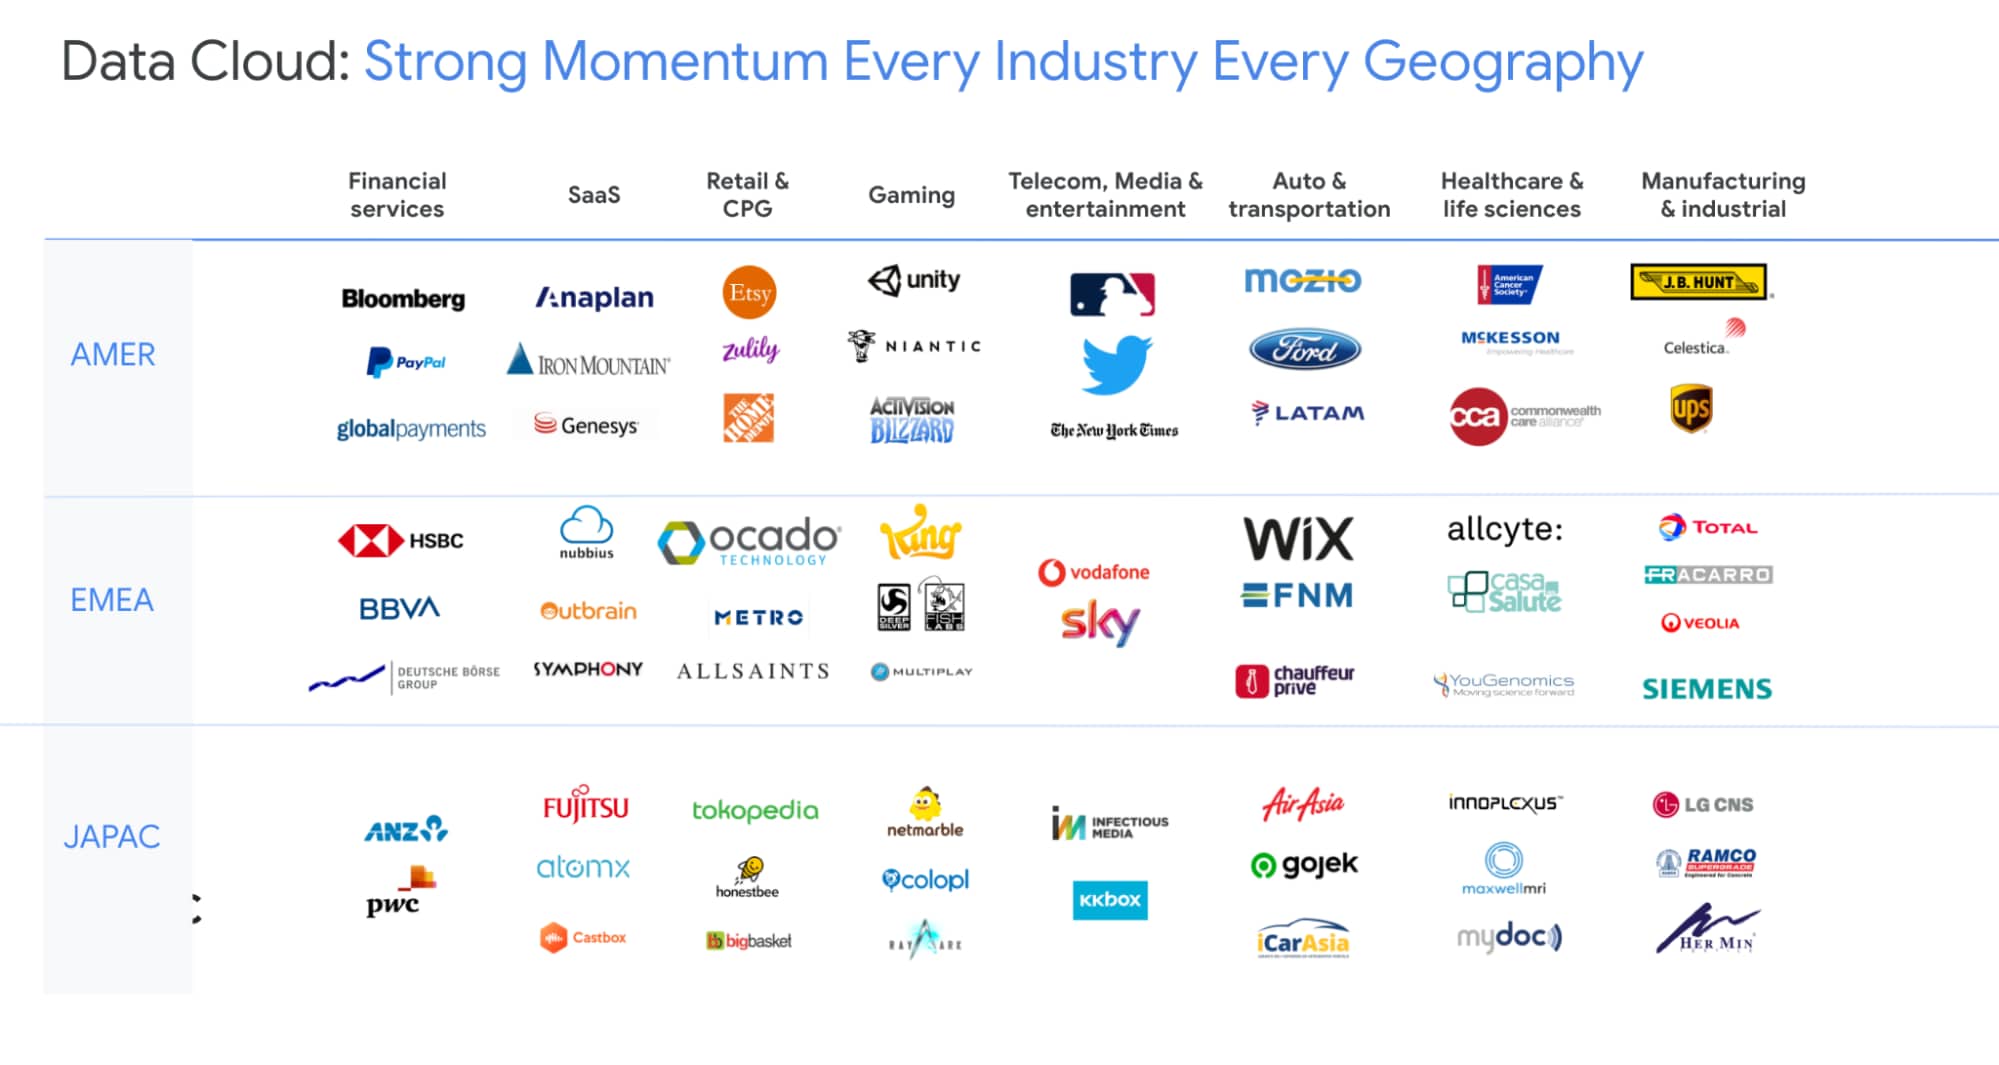
The Google Cloud Data Analytics portfolio has become a leading force in the industry and I couldn’t be more excited to have been part of it. I do miss you, my customers and partners, and I’m frankly bummed that we didn’t get to meet in person like we’ve done so many times before (see a photo of my last in-person talk before the pandemic), but this Google Next was extra special, so let’s dive into the product innovation and their themes.
I hope that I will get to see you in person next time we run Google Next!
More Relevant Stories for Your Company

The Query Execution Graph: Your Key to Better BigQuery Analytics
BigQuery offers strong query performance, but it is also a complex distributed system with many internal and external factors that can affect query speed. When your queries are running slower than expected or are slower than prior runs, understanding what happened can be a challenge. The query execution graph provides

Google Leads the Pack in Big Data NoSQL Market: Forrester Research
NoSQL has become critical for all businesses to support modern business applications. It has gone from supporting simple schemaless apps to becoming a mission-critical data platform for large Fortune 1000 companies. It has already disrupted the database market, which was dominated for decades by relational database vendors. Today, half of

Three New Features in Cloud SQL for SQL Server Extends its Functionality
As a product with a long history in the database ecosystem, SQL Server offers numerous native capabilities that help provide scalability and security to its users. However, it can be time consuming and complex to take advantage of these features. Google Cloud SQL for SQL Server saves your team time

Quick Recap on Google Cloud: Latest News, Launches, Updates, Events and More
Want to know the latest from Google Cloud? Find it here in one handy location. Check back regularly for our newest updates, announcements, resources, events, learning opportunities, and more. Tip: Not sure where to find what you’re looking for on the Google Cloud blog? Start here: Google Cloud blog 101: Full list
