





Explore Google Cloud SQL’s 3 Fault Tolerance Mechanism to Ease Data Pro

5208
Of your peers have already read this article.
2:00 Minutes
The most insightful time you'll spend today!
If you’re managing a crucial application that has to be fully fault-tolerant, you need your system to be able to handle every fault, no matter the type and scope of failure, with minimal downtime and data loss. Protecting against these faults means juggling numerous variables that can impact performance as well as recovery time and cost.
Today’s managed database services take over the operational complexity that used to exist for database administrators. Growing your organization’s tolerance required adding machines, compute, and storage, plus the operational costs of IT management: performing backups, writing scripts, creating dashboards, and carrying out testing to make sure your platform is ready when problems arise–all in a secure way.
At Google, our Cloud SQL managed database service offers three fault tolerance mechanisms —backup, high availability, and replication—and there are three major factors to consider for each of them:
- RTO (recovery time objective): When a failure happens, how much time can be lost before significant harm occurs?
- RPO (recovery point objective): When a failure happens, how much data can be lost before significant harm occurs?
- Cost: How cost-effective is this solution?
We’ve heard from customers like Major League Baseball, HSBC, and Equifax that they have strict data-protection needs and require highly fault-tolerant multi-region applications—and they’ve all chosen Cloud SQL to meet those needs.
Let’s take a closer look at how the decision-making process plays out for each recovery solution.
High availability (HA)
If your application is business critical, you require minimum RTO and zero RPO— a high availability configuration ensures that you and your customers are protected. If the primary instance fails, there’s another standby instance ready to take over with no data loss. There’s an additional cost here, but doing this manually brings a great operational cost, since you have to detect and verify the fault, do the failover, and make sure it’s correct—you can’t have two primary instances or you risk data corruption—then finally connect the application to the new database.
Cloud SQL removes all that complexity. Choose high availability for a given instance and we’ll replicate the data across multiple zones, synchronously, to each zone’s persistent disk. If an HA instance has a failure, you don’t have to think about when to fail over because Cloud SQL detects the failure and automatically initiates failover, for a full recovery and no data loss within minutes. Cloud SQL also moves the IP address during failover so your application can easily reconnect. MLB, for example, uses Cloud SQL high availability to serve prediction data to live games with minimal downtime. Dev/test instances don’t need those same guarantees, but can use local backups to recover from any potential failure.
Cross-region replica
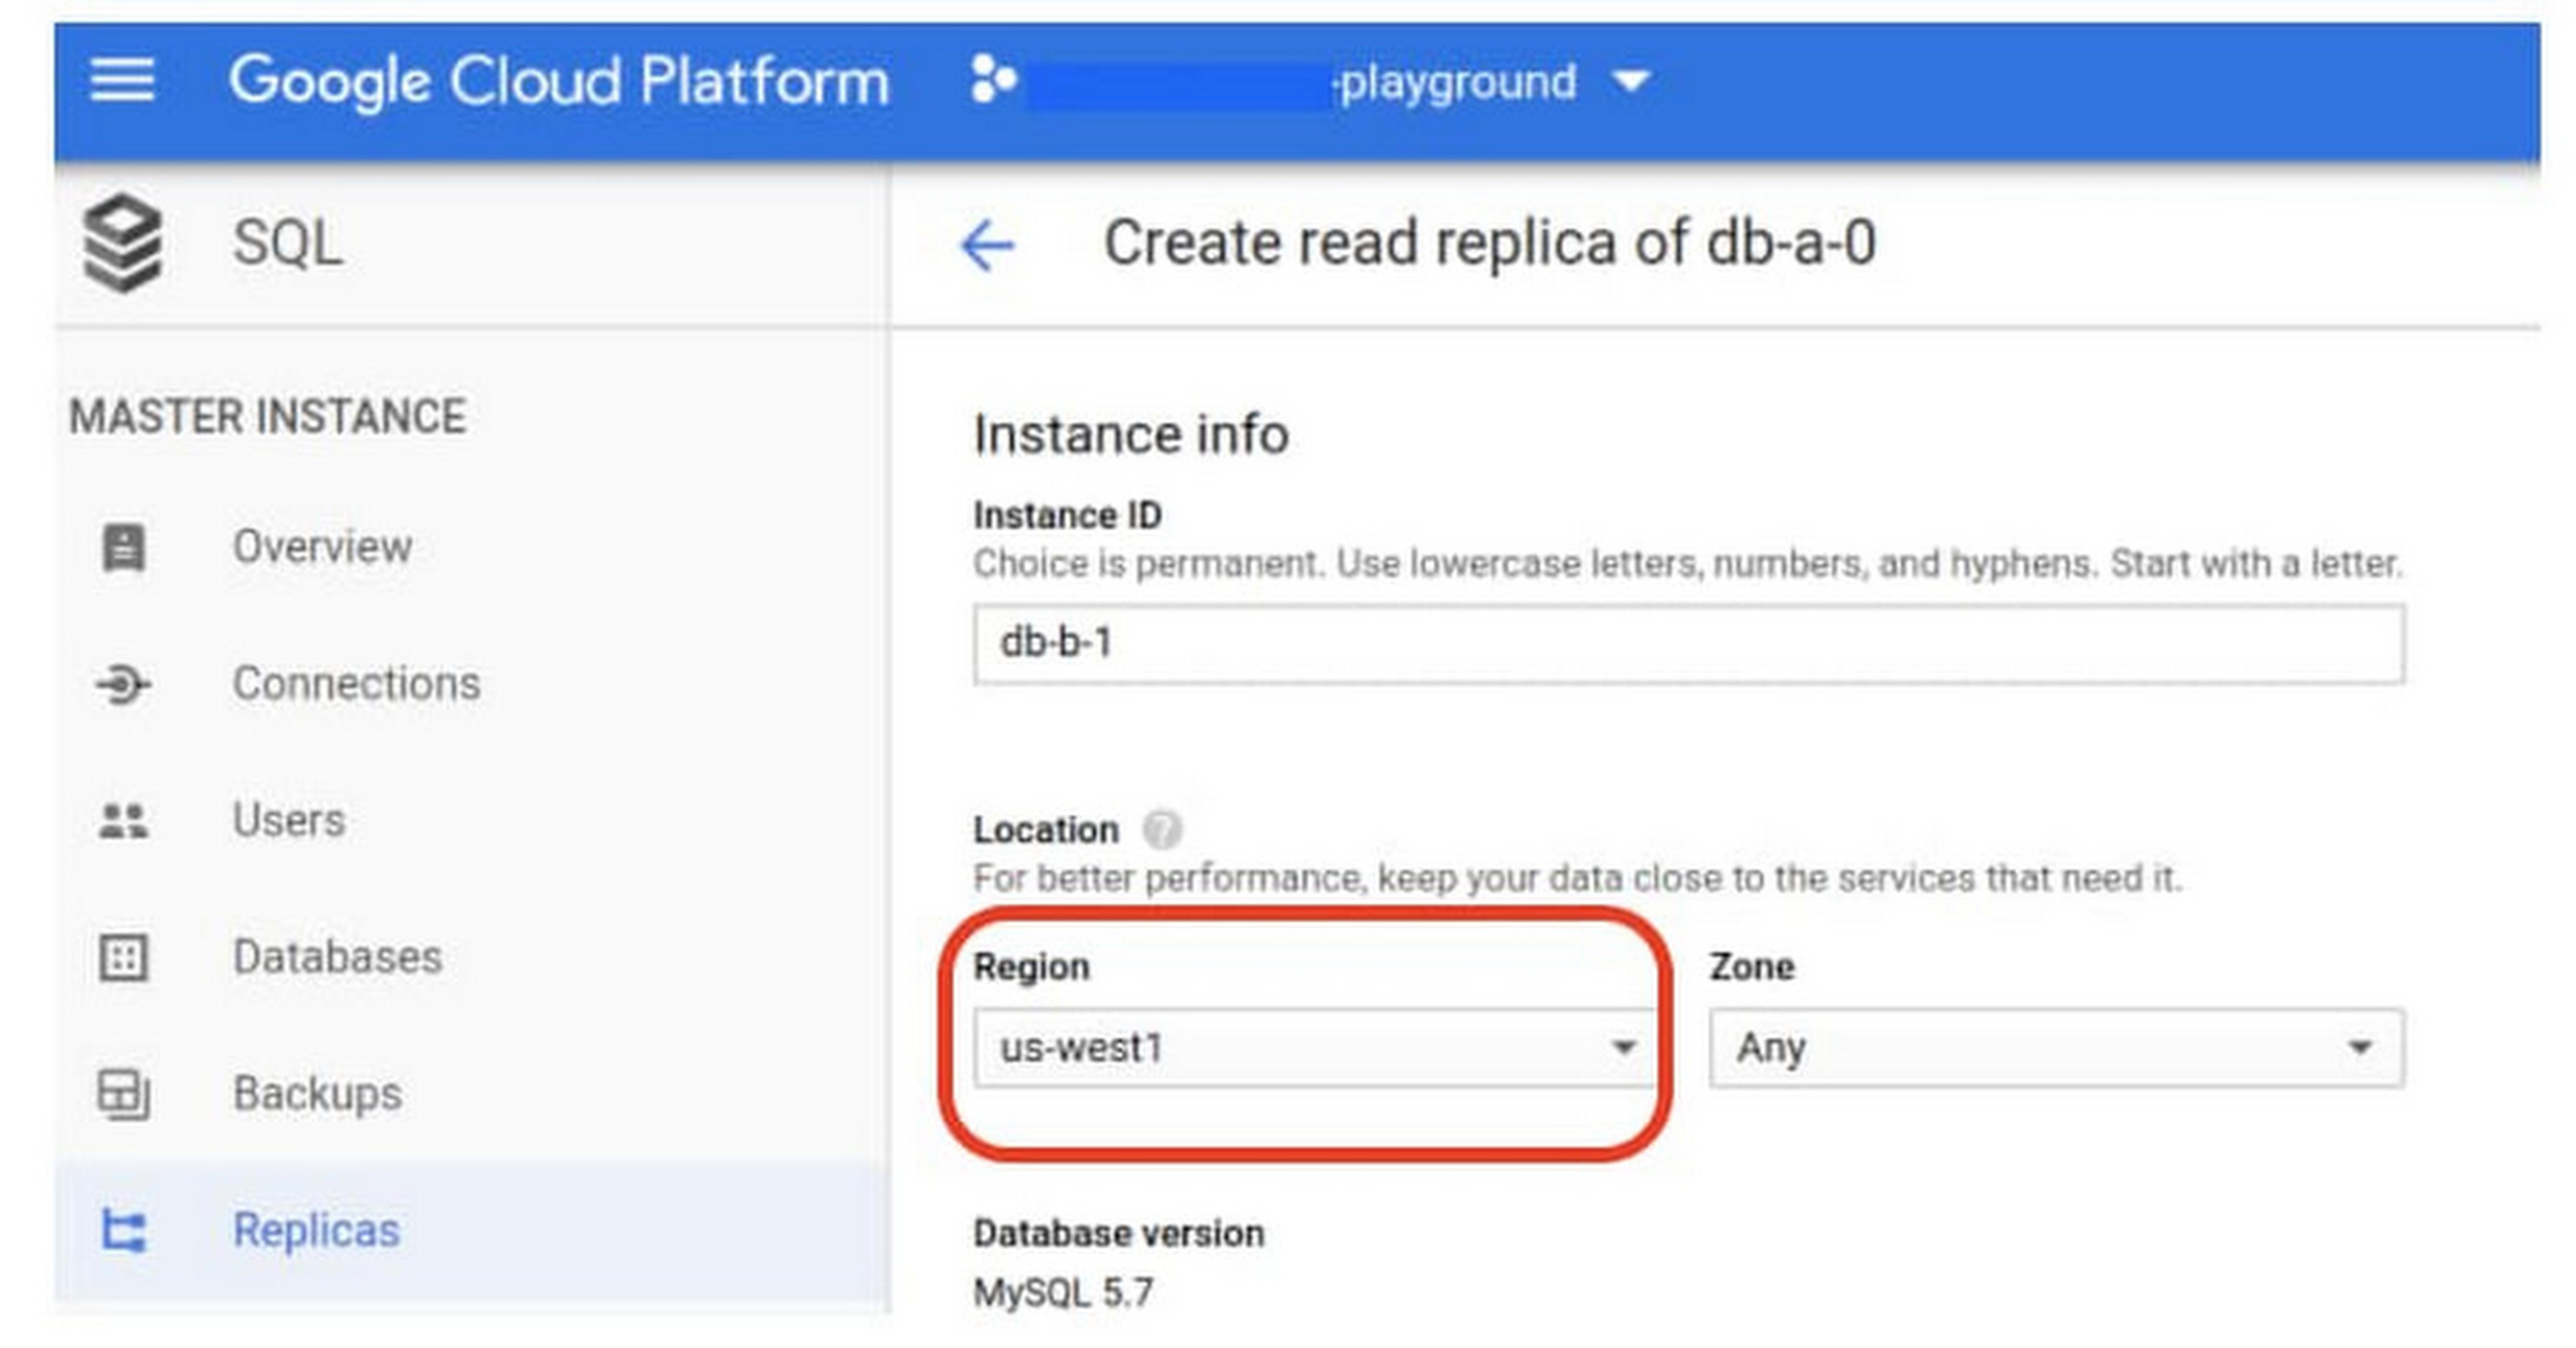
If a whole Google Cloud region goes down you still need your business to continue to run. That’s where cross-region replication comes in, a hot standby replica in another Google Cloud region provides RTO of minutes and RPO typically less than a minute . If you create a read replica in a region separate from your primary instance and you get hit with a regional outage, your application and database can start serving customers from another region within minutes. But this solution can be complex and enabling it yourself can be difficult and time-consuming. Securing cross-geography traffic demands end-to-end encryption and can bring connectivity issues too.
This is where the fully managed Cloud SQL solution shines. We offer MySQL, PostgreSQL and SQL Server database engines as a cross-region replication solution that’s easily configured and bolstered by Google’s interconnected global network. Just say, “I’m in U.S. East, I want to create a replica in U.S. West,” and it’s done, reliably and securely.
Backup
When you suffer data loss because of an operations error (for example, a bug in a script dropped your tables) or human error (for example, someone dropped the wrong table by accident), backups help you restore lost data to your Cloud SQL instance. Our low cost backup mechanism features point-in-time, granular recovery, meaning that if you accidentally delete data or something else goes wrong, you can ask for recovery of, for example, the state of that database down to the millisecond, such as Monday at 12:53pm. Your valuable data is replicated multiple times in multiple geographic locations automatically. This enables the automatic handling of failover in cases of major failure. You can always rest assured that your database is available and data is secure, even in the times of major failure crises.
Cloud SQL provides automated and on-demand backups. With automated backups, Google manages the backups so that you can easily restore them when required. Also, the scheduled backing is automatically taken by default. With on-demand backup, you can create a backup at any time. This could be useful if you are about to perform a risky operation on your database, as Cloud SQL lets you select a custom location for your backup data. When the backup is stored in multiple regions, and there’s an outage in the region that contains the source instance, you can restore a backup to a new or existing instance in a different region. This is also useful if your organization needs to comply with data residency regulations that require you to keep your backups within a specific geographic boundary.
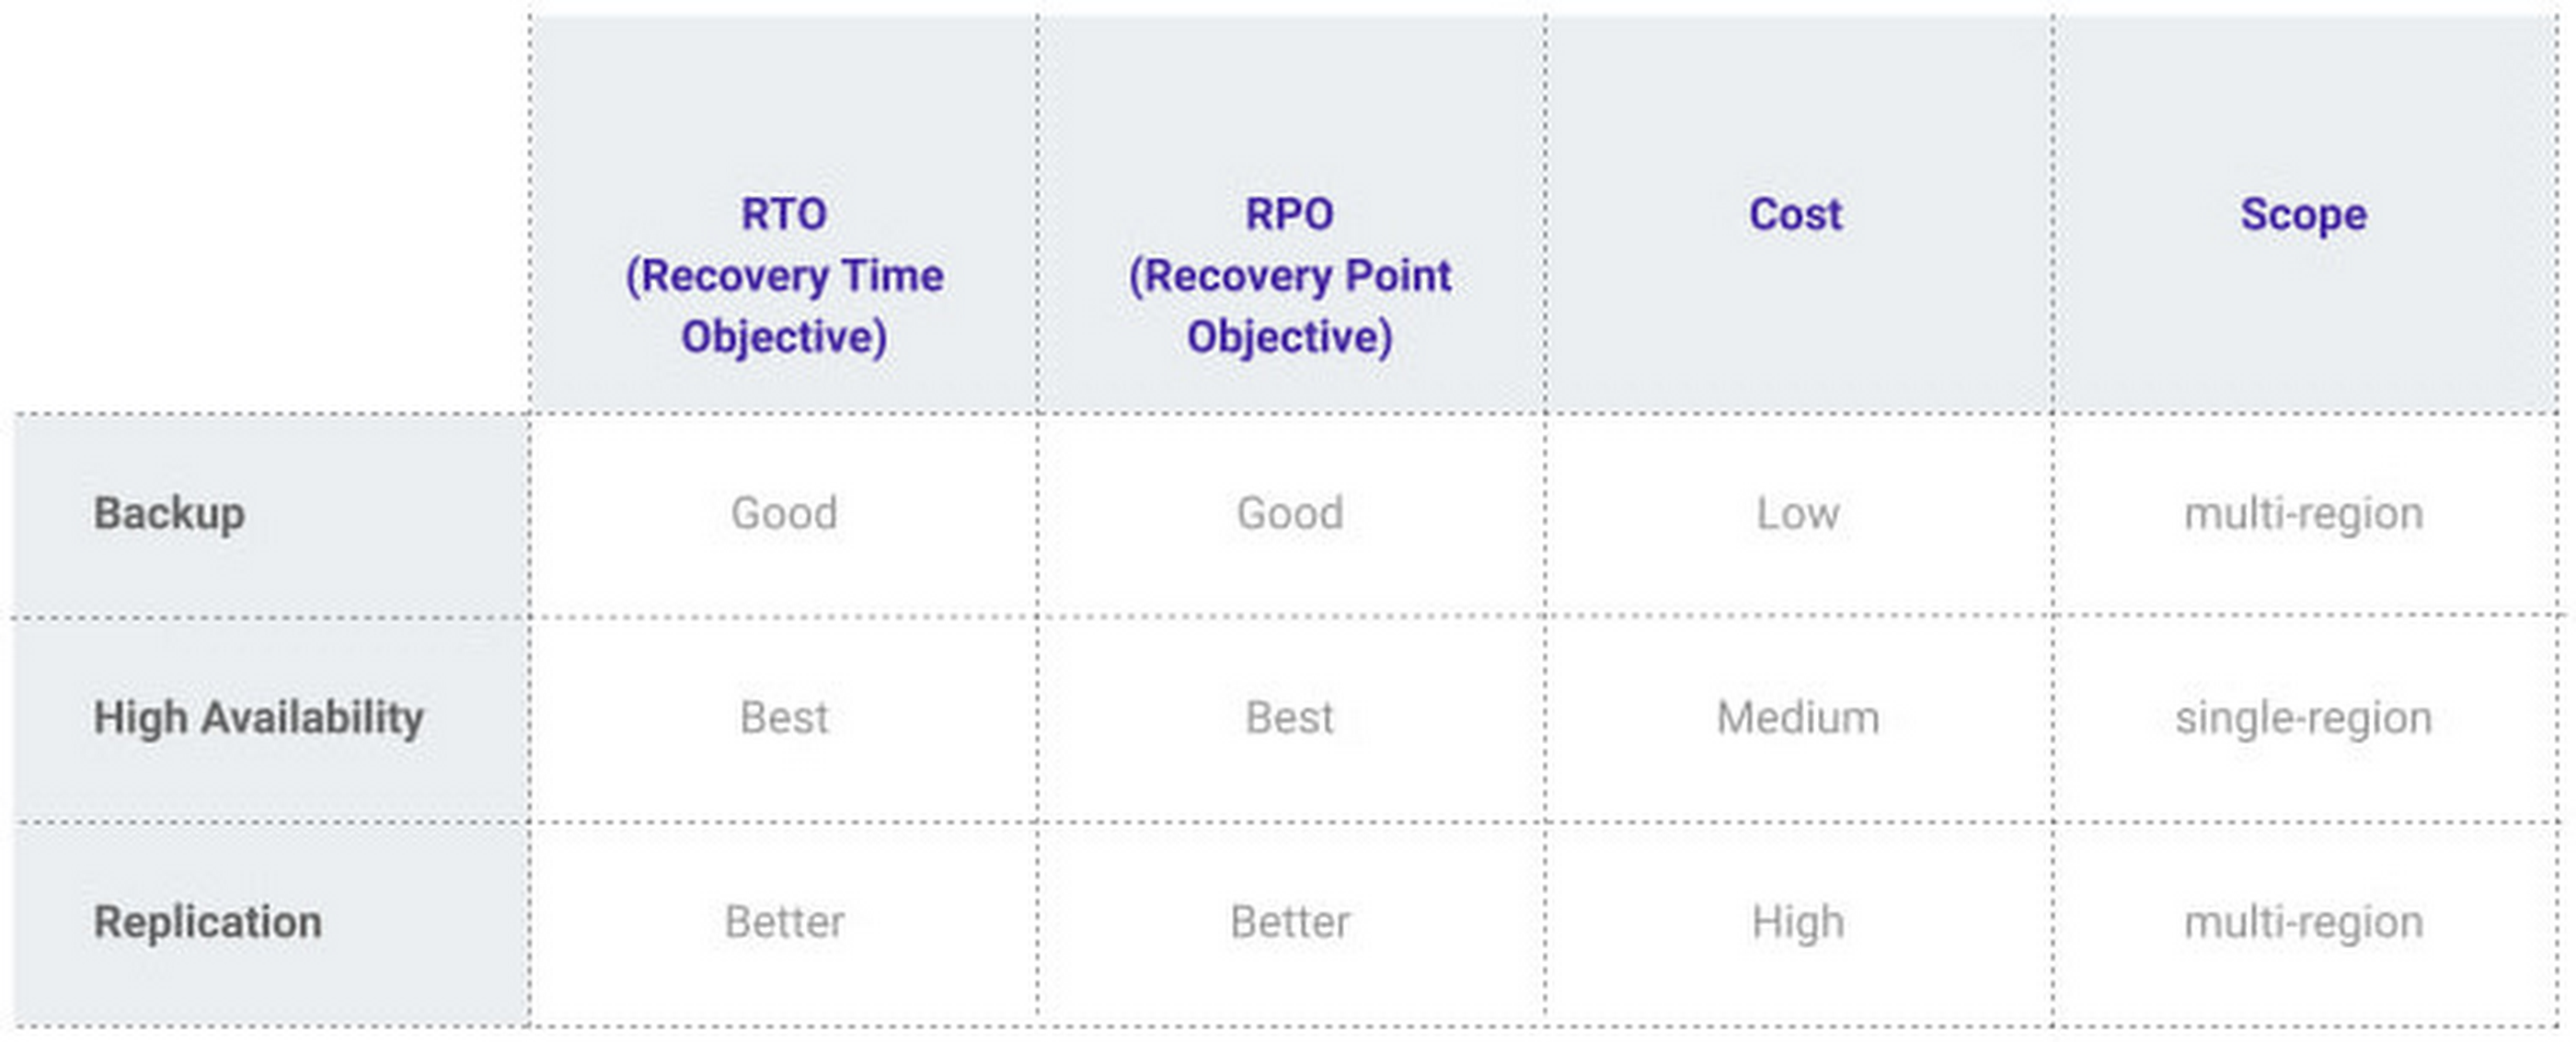
Putting it all together
For critical workloads, MLB configures their Cloud SQL instances with backups, high availability, and cross-region replication. Doing so ensures they can recover from many failure types.
- To recover from human error (“Oops, I didn’t mean to delete that”), MLB uses backups and point-in-time recovery to recovery to a millisecond or specific database transaction
- To automatically recover from primary instance failures and zonal outages, MLB uses Cloud SQL’s high availability configuration
- To protect against regional outages, MLB uses cross-region replication
Creating a robust configuration, like MLB did, takes just a few minutes. Get started in our Console or review documentation.
6694
Of your peers have already downloaded this article
4:30 Minutes
The most insightful time you'll spend today!
Unlocking the Power of Data and Creativity with
the Cloud: The WPP Story
Meesho’s Zero Downtime Success: Cloud CDN Migration Made Easy

1978
Of your peers have already read this article.
4:30 Minutes
The most insightful time you'll spend today!
Meesho is an Indian online marketplace that serves millions of customers every day. Recently, the company decided to adopt a multi-cloud strategy, leveraging Google Cloud’s scalable and reliable infrastructure to drive operational efficiency, modernize and scale for growth. To do so, they needed to migrate billions of static files and images to Google Cloud, to render the static content that serves their web and mobile applications. But with over a petabyte of data in their object storage system, and 10 billion requests per day, Meesho needed to perform this gigantic migration gradually, with zero downtime — a huge challenge.
In this blog post, we look at how Meesho did this using Storage Transfer Service, Cloud Storage and Cloud CDN. We also look at how it saved on storage capacity by resizing static images as needed on the fly, using Cloud Run.
CDN migration requirements
Migrating from one cloud to another isn’t easy. To pull it off, Meesho identified the following requirements:
- Petabyte-scale data transfer: Meesho needed to migrate billions of image files from their existing object storage server to Cloud Storage.
- Dynamic image resizing: To save on storage costs, Meesho wanted the ability to dynamically resize the images based on the end user platform and store the smaller images in the Cloud CDN cache.
- High-throughput data transfer: To support consumer demand, Meesho needed images to be served at a throughput of thousands of requests per second.
- Zero downtime: Since any downtime involves potential loss of revenue, Meesho needed to perform the migration without taking any systems offline.
Migration architecture
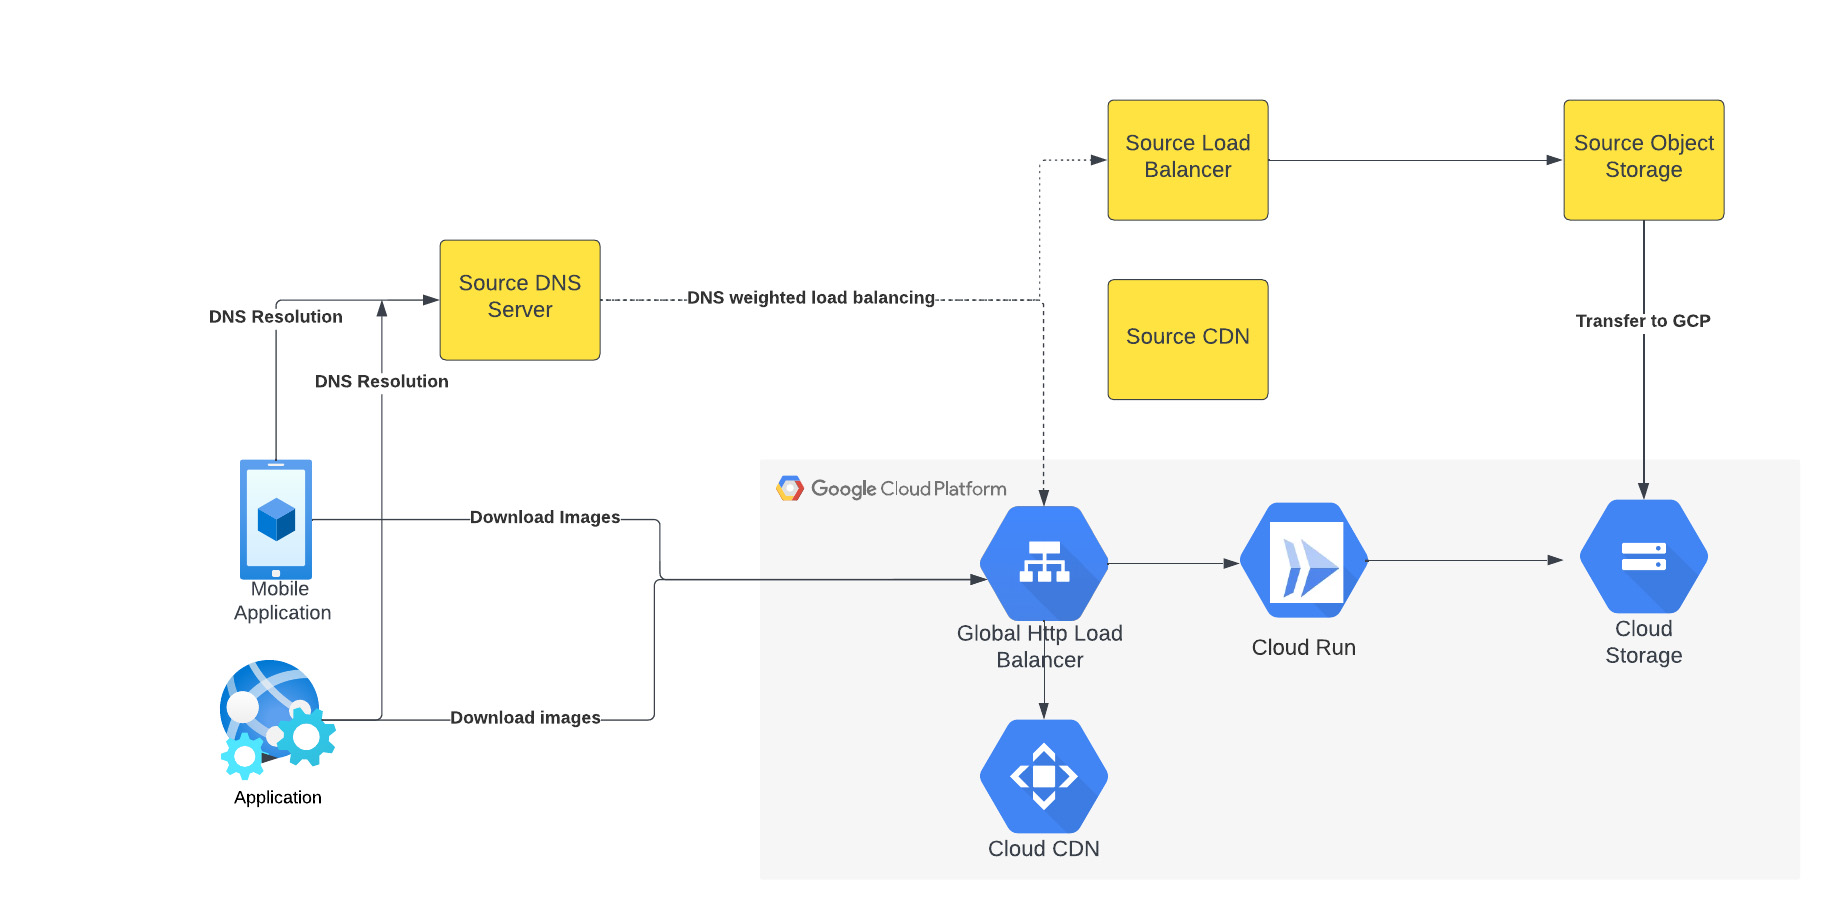
The above figure depicts the CDN migration architecture implemented in Meesho. The existing DNS server points to both the source load balancer as well as Google External HTTP Load Balancer with weighted distribution. The source load balancer points to the source object storage. Images were transferred from the source object storage to Google Cloud Storage.
The Google External HTTP Load Balancer was deployed with Cloud CDN to serve static images that are stored in the CDN cache to users. The Google Load Balancer public IP is configured as an end point on their existing DNS server. The Load Balancer is connected to Cloud Run, which talks to the Cloud Storage bucket. When a request reaches the Load Balancer in the edge, it first checks if the content is available in Cloud CDN, and returns the object from the closest edge network. If the image is not available in the Cloud CDN cache, the request is sent to Cloud Run which obtains the image from the Cloud Storage bucket and performs dynamic resizing of the image if necessary.
Data transfer
Meesho used Google Cloud’s Storage Transfer Service to transfer data from their current object storage to Cloud storage bucket over the internet. Since the number of files and total size of the data to be transferred was huge, Meesho executed multiple parallel transfers by specifying folders and subfolders as prefixes in a Storage Transfer Service job.
Dynamic image resizing
Meesho delivers static images to multiple end user platforms — mobile, laptop — at multiple resolutions. Rather than store each image at multiple image resolutions, Meesho opted to store a single high-resolution mezzanine image. It then attached Cloud Run as a serverless network endpoint group to a Cloud Load Balancer. Application requests for images specify the name of the object, the format of the image, and its resolution (for example, abc.jpeg with 750*450 resolution). If the specific image exists for the requested resolution, then it is returned from the Cloud Storage bucket to the end user and stored in the Cloud CDN cache. If an image for a specified resolution and/or format is not found, the mezzanine image (in our example, abc.jpeg) is resized to the specified resolution and format, then stored in Cloud Storage bucket and returned to the end user. The dynamic resizing and formatting is only performed the first time for a specific resolution.
In this architecture, it is important to configure Cloud Run to scale appropriately as it handles a bulk of “CDN cache-miss” requests. Meesho performed the following configuration steps:
- Configured the number of concurrent requests that a single instance of Cloud Run can handle
- Ensured a sufficient minimum of Cloud Run instances were available to serve user traffic to avoid cold-start latency
- Reviewed limits of Cloud Run maximum instance size for the region and increased the limits if necessary to handle peak load
- Set up smaller start-up times for Cloud Run containers, so that the application could quickly autoscale to handle a surge in traffic
- Optimized the memory and CPU configuration to handle processing requirements
CDN configuration
Cloud CDN was configured to ensure a high cache hit ratio > 99 %. This not only sped up the rendering of the images, but also reduced the load on Cloud Run, saving cost and improving performance.
Achieving zero downtime
Meesho followed well-established DevOps principles to achieve a zero-downtime migration:
- Metrics and alerts were configured in Cloud Monitoring to oversee the load balancer.
- The DNS server was configured to point to Cloud Load Balancer IP addresses in addition to their current load balancer, which served status assets.
- Weight-based DNS load balancing was employed to gradually shift the traffic to Google Cloud, while monitoring application performance and HTTP response codes.
- The initial migration process distributed .1% of traffic during non-peak hours. The metrics, end user performance and response codes were continuously monitored.
- Traffic was gradually incremented over a two-week period by increasing the weight of the Google Cloud Load balancer in DNS. By gradually shifting traffic, Meesho ensured a healthy cache-hit ratio, allowing Cloud Run to learn traffic patterns gradually and scale seamlessly.
Meesho learned a lot through this experience, and has the following advice for anyone undertaking a similar migration:
- While transferring data using Storage Transfer Service of Google Cloud, split the transfer process into multiple transfers.
- Ensure that applications do not pin certificates, which could create problems while migrating to the newer certificates in Google Cloud.
- Plan a gradual migration process to gradually increase the traffic to Google Cloud.
Summary
When all is said and done, Meesho considers its migration to Google Cloud a big success. After migrating the static images to Cloud CDN, Meesho held two major sales that each had three times the normal peak traffic, all with no issues. The CDN migration helped Meesho reduce its costs, improve performance and reduce load balancer errors when fetching static images. To learn more about Cloud CDN and how you can use it in your environment, check out the documentation.
Datashare for Financial Services: Securing the Publishers and Consumers’ Access to Market Data

8553
Of your peers have already read this article.
4:30 Minutes
The most insightful time you'll spend today!
Access to the cloud has advanced the distribution and consumption of financial information on a global scale. In parallel, the global financial data landscape has been transformed by an influx of alternative data sources, including social media, meteorological data, satellite imagery, and other data. Exchanges and market data providers now find they need to include these new datasets to enrich their products and compete, which has meant they now must consider cloud-based models to keep up with the demands of their customers who expect easy, quick, flexible and cost-efficient ways to consume market data.
To address these needs, today we’re announcing the general availability of Datashare for financial services, a new Google Cloud solution that brings together the entire capital markets ecosystem—data publishers, and data consumers—to exchange market data securely and easily.
Datashare helps organize third-party financial information, making it accessible and useful to market data publishers and data consumers. We open-sourced the entire Datashare solution so market data publishers can now onboard their licensed datasets to Google Cloud securely, quickly and easily, while data consumers can consume that data as a service in tools of their preference, such as BigQuery.
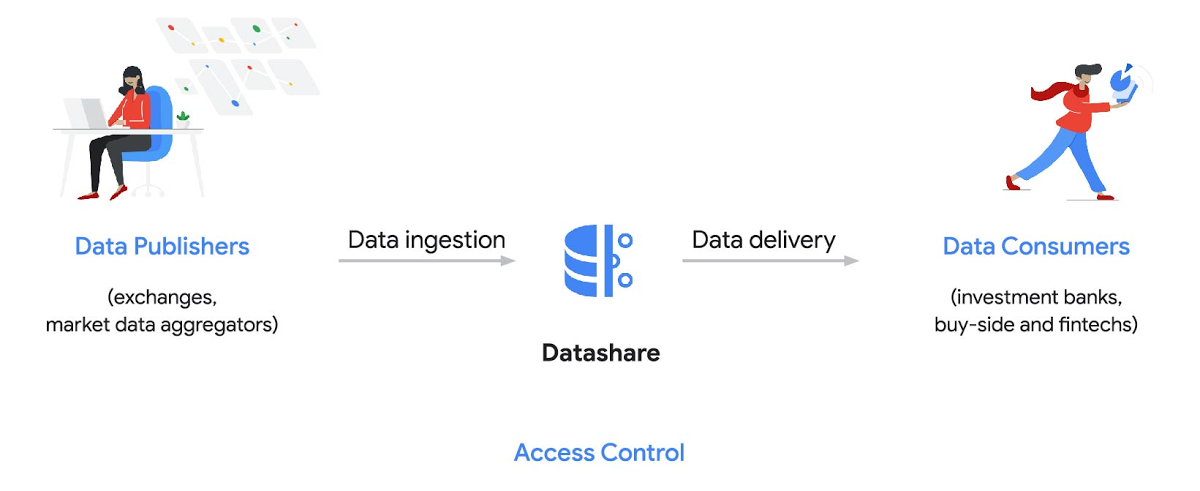
Three ways to distribute and consume your data
Batch data delivery
Datashare provides a batch data delivery mechanism for data publishers to deliver their reference data, historical tick data, alternative market data sources and more via BigQuery, reducing the administrative burden on data consumers to extract insights from data.
Real-time data streaming delivery
By using this event-based data delivery channel for rapidly changing instrument prices, tick data, orders, news and others via Pub/Sub, data consumers can reliably process individual messages or rewind to a point in time to replay a prior market scenario and test model changes.
Monetizing licensed datasets
Market data publishers can onboard their licensed datasets to Google Cloud and make them available via a one-stop-shop on Google Cloud Marketplace, enabling a new sales channel to expand market reach.
Reference architecture
Check out the diagram below to see how you can share your batch and real-time data directly to your Google Cloud customers with BigQuery and Pub/Sub.

As you can see in the above reference architecture, both publishers and consumers can derive several benefits from the solution:
Benefits for data publishers
- You no longer have to maintain your own delivery and licensing infrastructure.
- You can easily package and deliver granular data products and experiments with SQL.
- You can have a solution that scales with your business as data volumes and number of customers grow.
Benefits for data consumers
- Your data is ready for analysis and machine learning (ML)— you no longer have to maintain extract, transform, and load (ETL) pipelines to load files and transform data.
- You can avoid the expense and burden of maintaining multiple copies of large data files.
- You can be more targeted with consumption of data using BigQuery queries, improving performance, and compliance, and reducing cost.
Accessing the datasets
Google Cloud has been working with multiple industry firms on innovating in the market data space. By using Datashare for publishing, data publishers can make their entire datasets available on Google Cloud. Early adopters of Datashare include firms such as OneTick and Accern. OneTick’s datasets include reference and historical futures data (that can be accessed in our console with your login). Accern’s datasets include alternative data such as market sentiment and credit analysis data (that can be accessed in our console with your login).
To make it more helpful, we partnered with Accern to create a hypothetical scenario to describe the data acquisition and analytics process step-by-step.
Accern use case
As a sustainability analyst, you require an economic, social and governance (ESG) dataset to determine which sector is the most widely covered ESG sector by analysts, and to also identify the sector with the lowest ESG sentiment score. Now, you can discover and acquire an ESG dataset in Google Cloud.
Step 1. Navigate to the Financial Services solutions page in the Google Cloud console:

Step 2. Click a dataset, for example Accern AI-Generated ESG Insights, then review the overview details, plans and pricing, documentation and support information. To view the available pricing tiers, click ‘View All Plans’. Once you’ve decided on a tier that you would like to subscribe to, click ‘Select’, choose a billing account and review and accept the terms of service to complete the subscription. Once the steps are complete, click ‘Subscribe’ at the bottom. An overlay window will appear, click ‘Register with Accern’ to activate and complete the subscription.
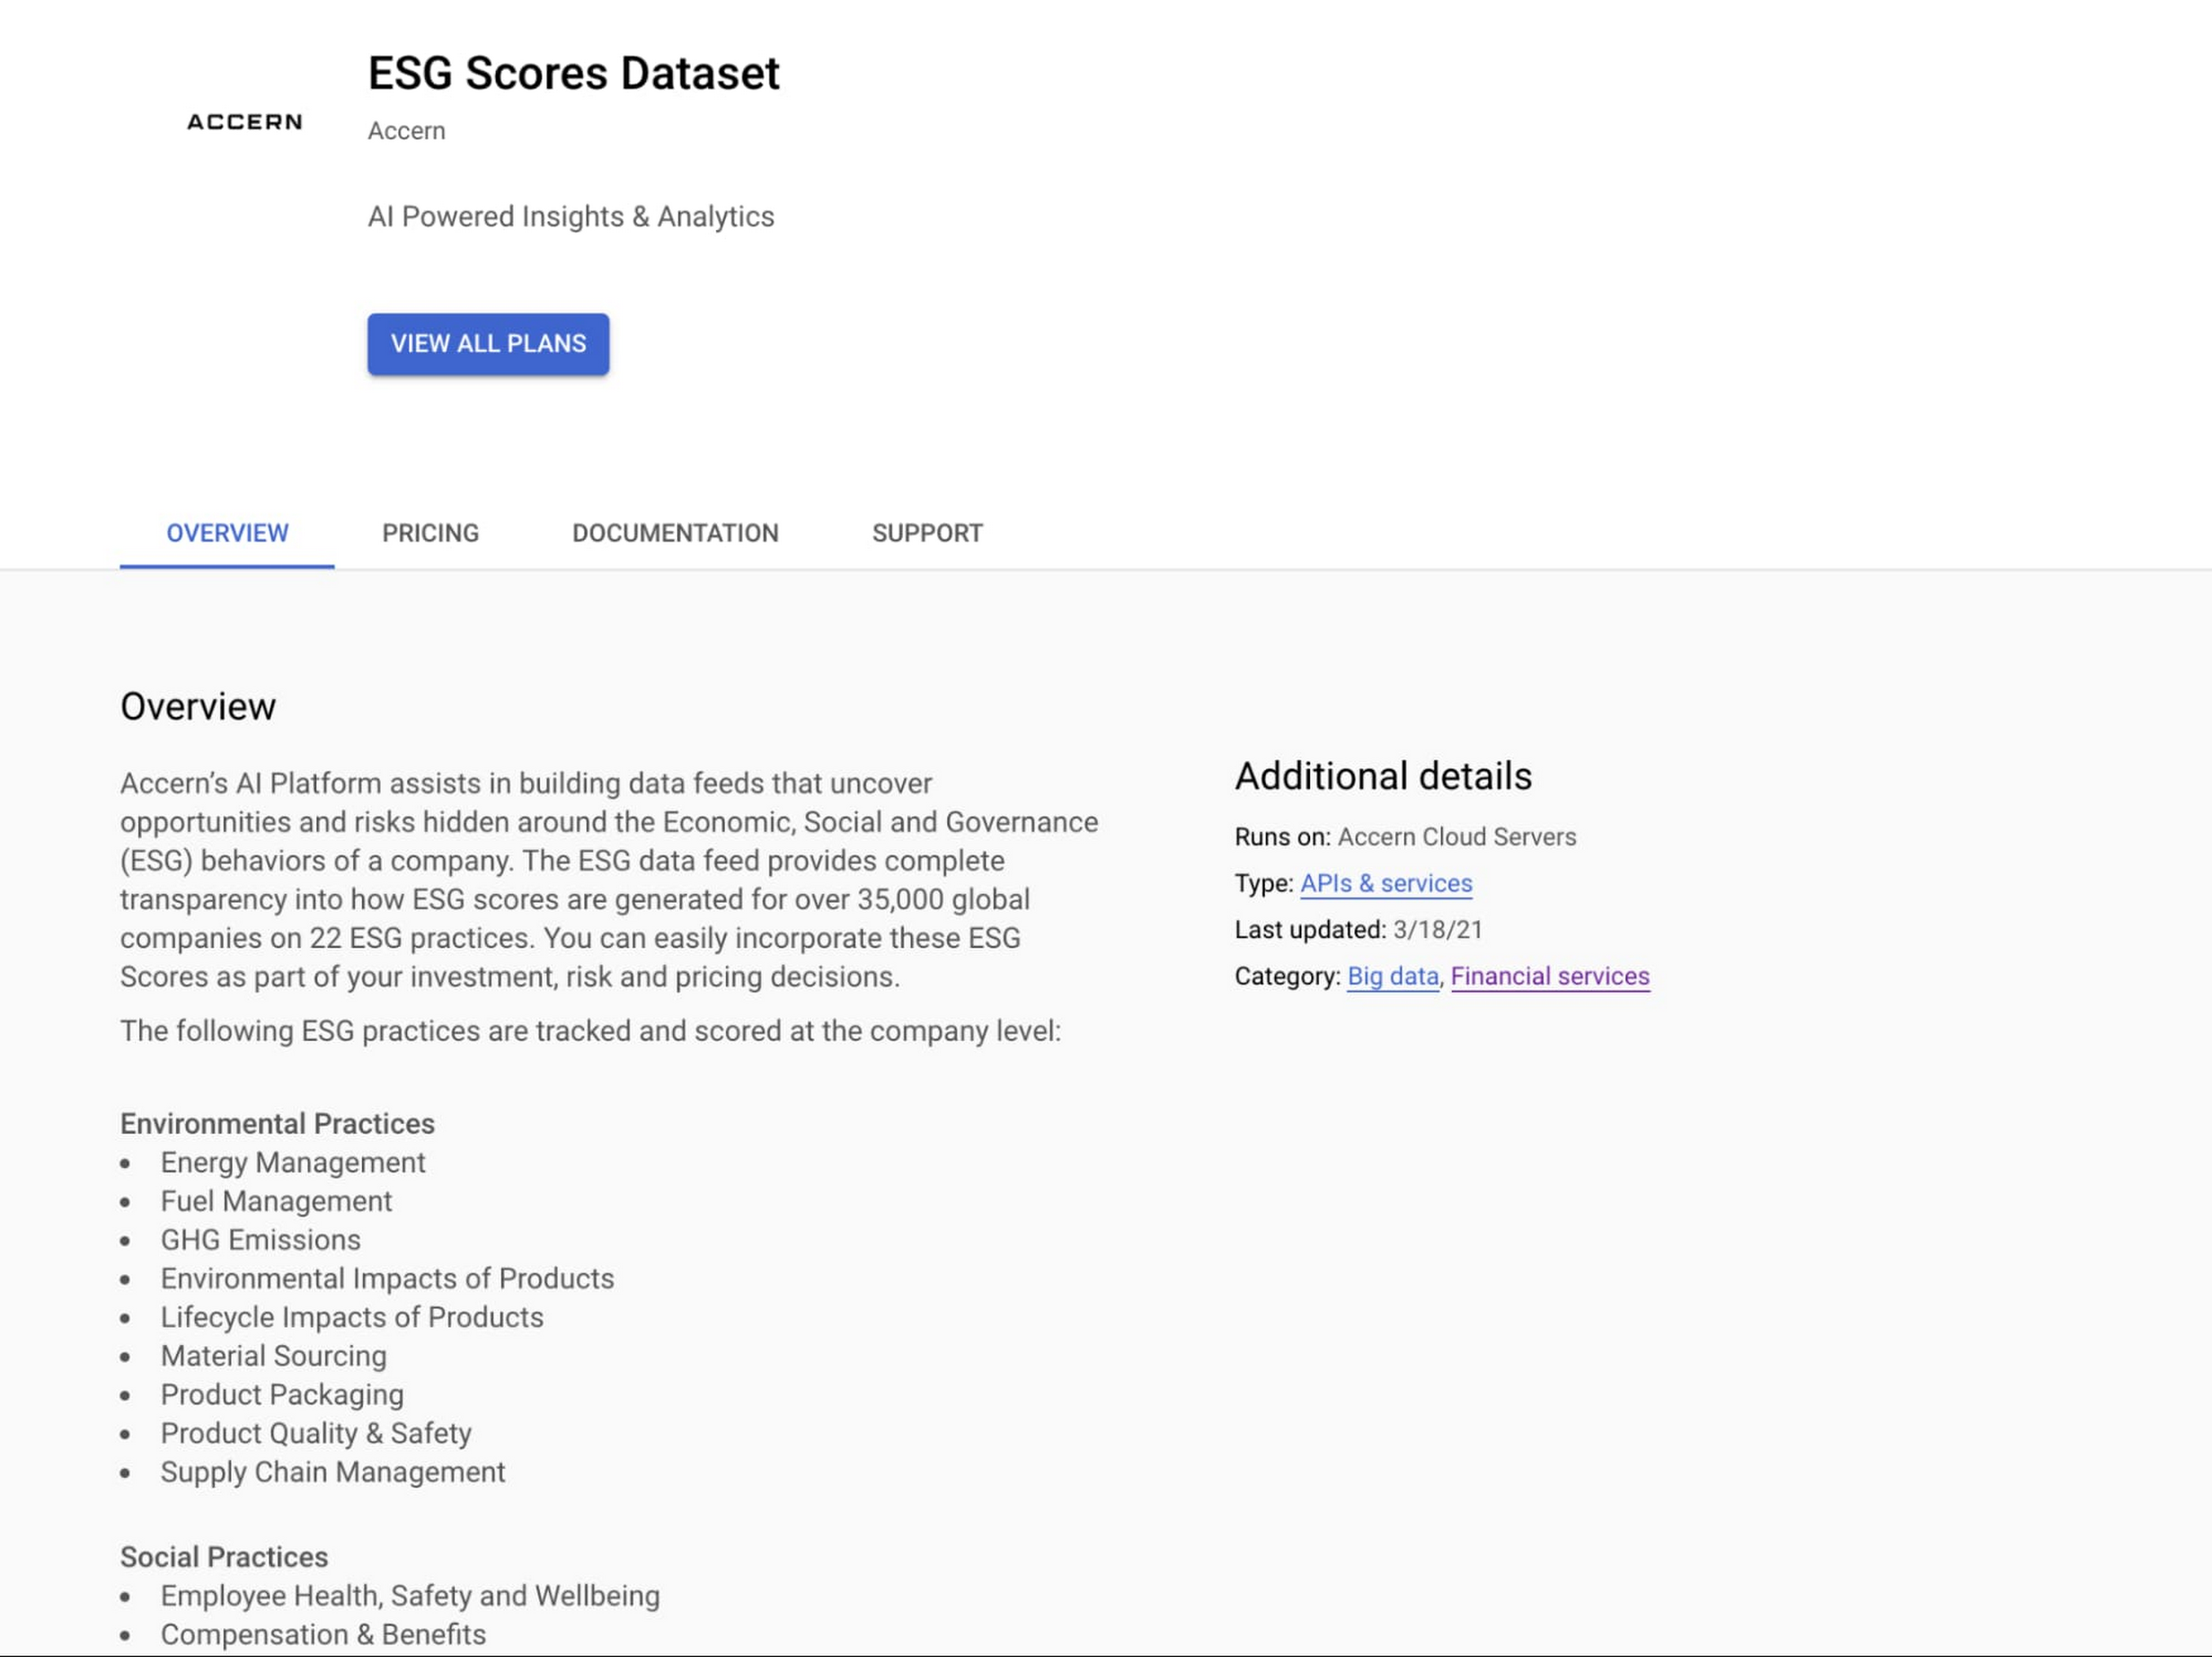

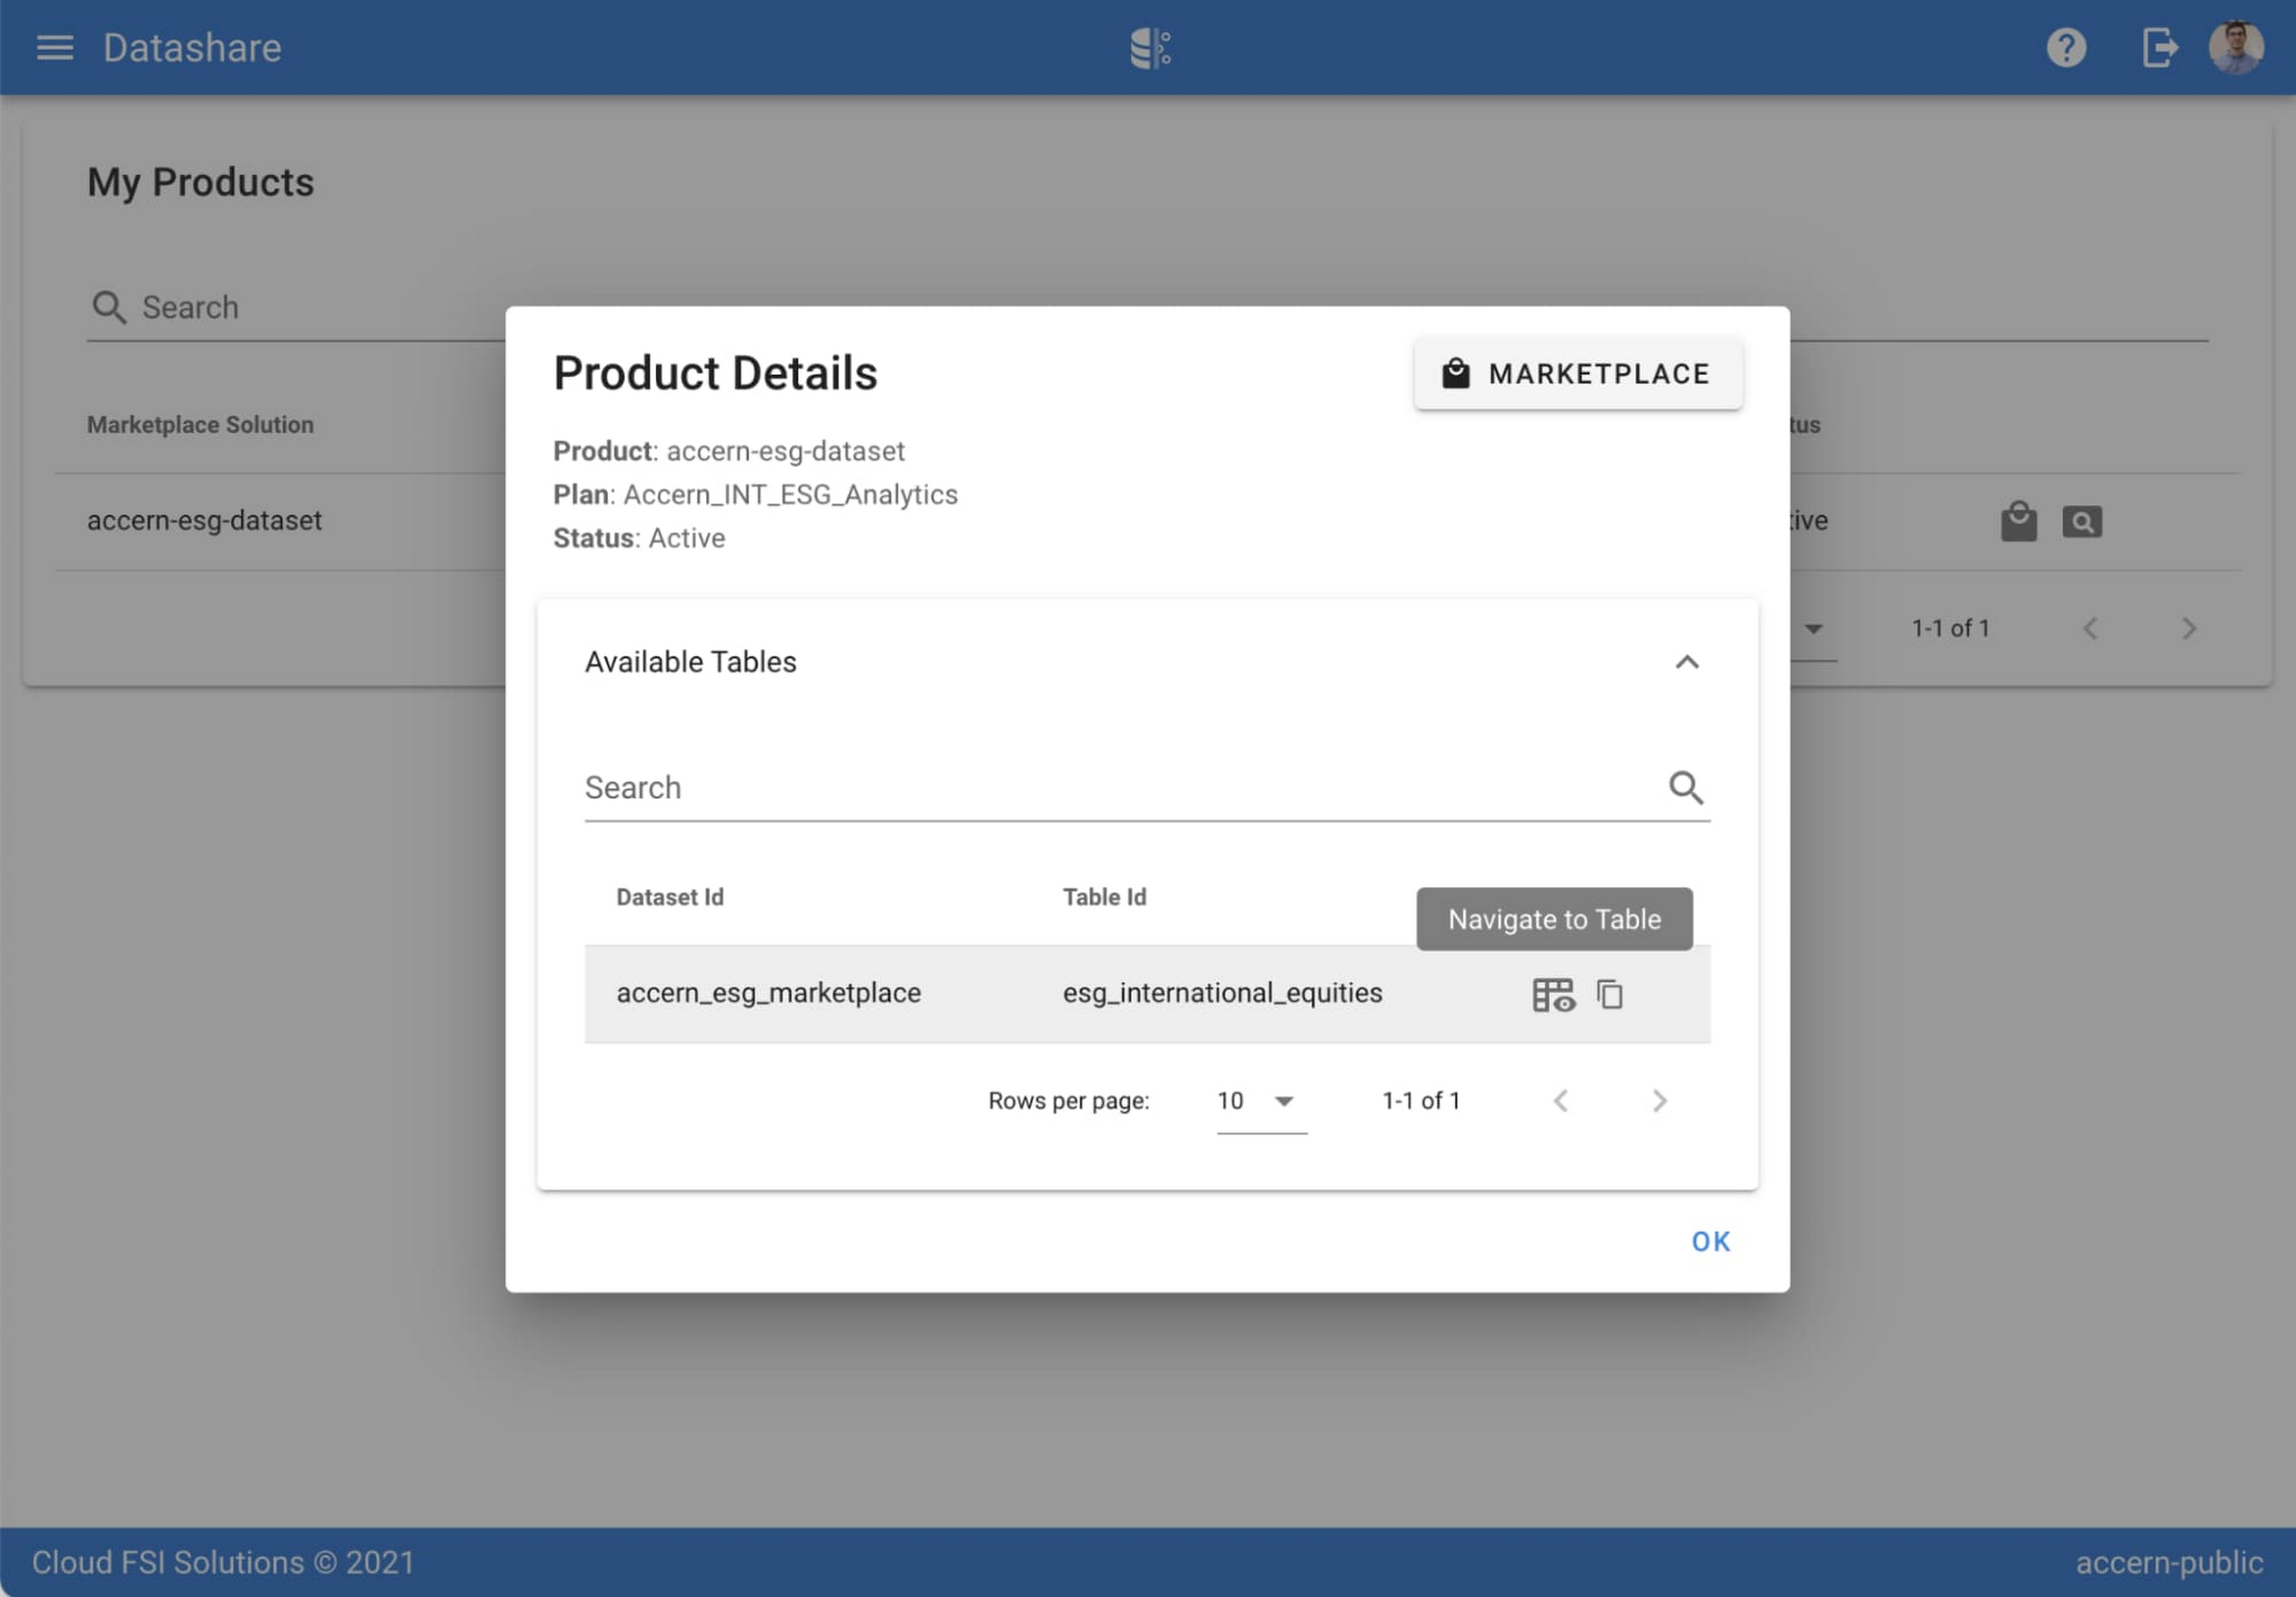
Step 3. Once activation is complete, you’ll be directed to the Datashare ‘My Products’ screen. Voila! You are now subscribed to Accern’s ESG Scores dataset and can access it in your Google Cloud instance using BigQuery. To access the data, click the hour glass icon on the corresponding ‘My Products’ record that you just purchased. An overlay will present you with the details on the dataset and/or table. Click the ‘Navigate to Table’ button to navigate through to the BigQuery console.


Step 4. Now that you have access and are in the BigQuery console, it’s time to generate data insights.
For this example, we’ve eliminated the company identifying information that is included as part of the subscription and aggregated company ESG in a view where each row represents a day, an industry sector, a specific identified ‘ESG Issues’ (event_group and event) and the respective ‘ESG Sentiment’ per issue.

For example, row 1 indicates that within the ‘Healthcare’ sector, there was a ‘Social – Civil Society’ issue identified and it had a negative ESG sentiment score of -15.35.
Step 5. Generate a report by exporting it to Data Studio to build visualizations and conduct additional analysis on the ESG data.
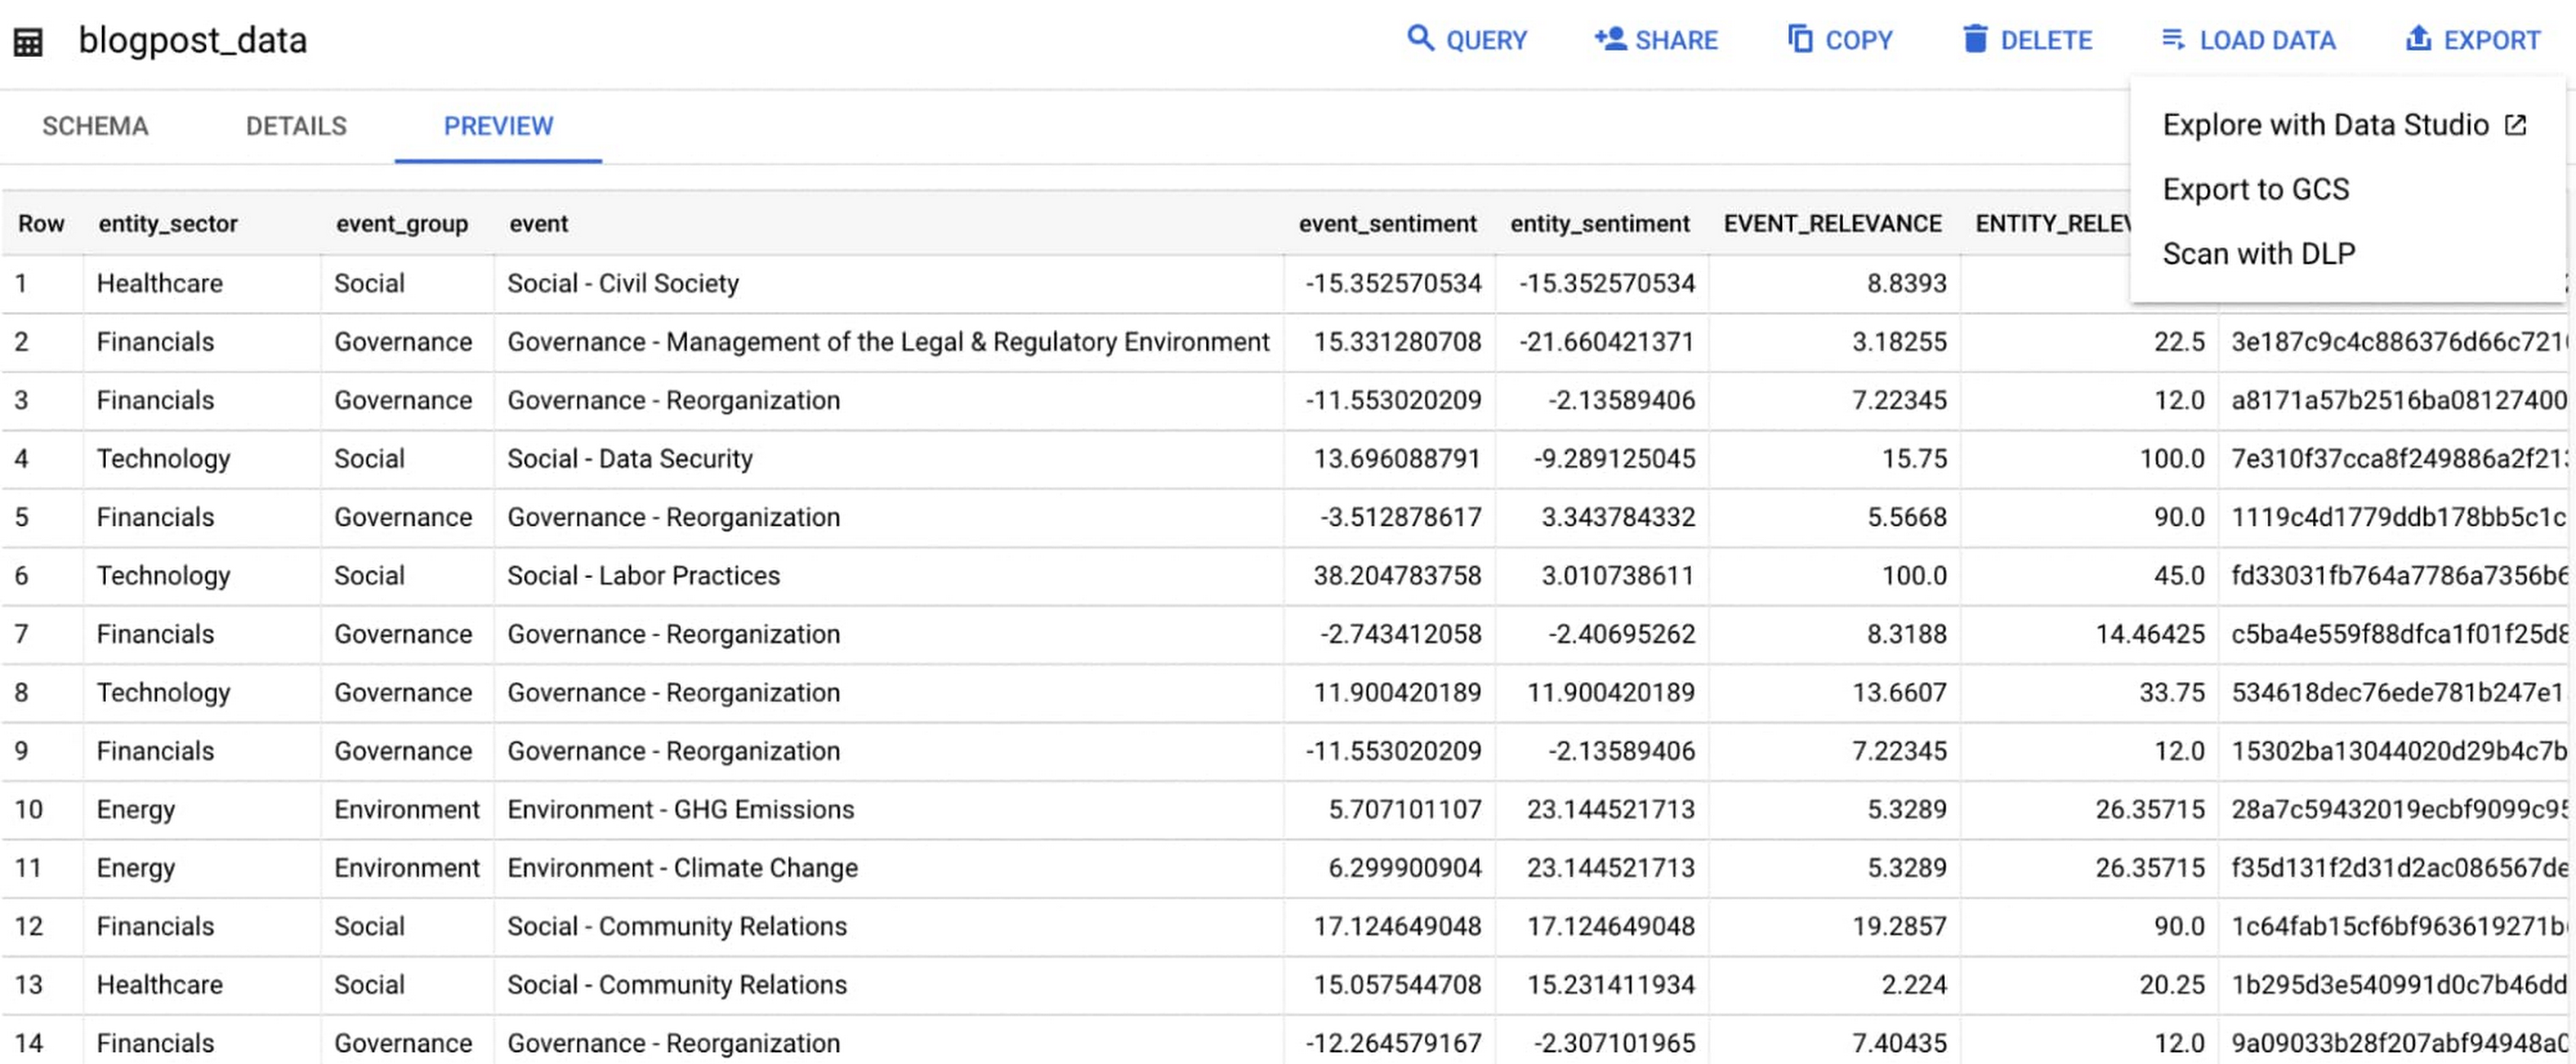
Select ‘Export’ and ‘Explore with Data Studio’.
Step 6. Build a simple/basic report.
Now that the ESG data appears in Data Studio, you can start by building a simple chart to help you understand which industry sectors have the highest volume of discussions around ESG and the overall ESG Sentiment per industry sector.
To build the chart:
- Select the chart type ‘Table’.
- Include
Entity_Sectoras your dimension to aggregate results by ‘Industry Sector.’ - Include
Signal_IDas a measure to count the number of ESG passages identified per ‘Industry Sector.’ - Include
AVG(Event_Sentiment)as a measure to display the overall ESG Sentiment per ‘Industry Sector’ across ESG Issues.

You can see sectors that are most discussed when it comes to ESG related topics and their corresponding ‘ESG Sentiment’ scores.
Step 7. Build your final report in Data Studio.
As a next step you can further drill into the data to understand ESG data specific to each ‘Industry Sector’ and identify positive and negative ESG practices.
Accern has built a more complex sample dashboard and made it available publicly here. You can interact with this report and play around with the data. The dashboard can help to identify material ESG insights for each sector to inform your investment and risk processes. If you have additional questions, you can reach out to Accern directly.

Discovering, accessing and analyzing licensed datasets is quick and easy. Stay tuned for more updates on new licensed datasets.
Publishing your data via Datashare
If you are a publisher of market data, alternative, or exotic data, you can use Datashare to get it published on Google Cloud Marketplace.
Start by joining the Partner Advantage program by registering for the Partner Advantage Portal and applying for the Partner Advantage Build Model engagement. Visit our getting started guide for information to get started on publishing licensed datasets in the Marketplace. Stay tuned for a future blog post about using Datashare to publish datasets in the Marketplace.
More solutions for capital markets
Check out other Google Cloud solutions for capital markets.
Case Study: When Database Choice Powers New Revenue-driving Product Features

4159
Of your peers have already read this article.
4:30 Minutes
The most insightful time you'll spend today!
Editor’s note: Streak makes a CRM add-on for Gmail, and recently adopted Cloud Spanner to take advantage of its scalability and SQL capabilities to implement a graph data model. Read on to learn about their decision, what they love about the system, and the ways in which it still needs work.]
Streak is a customer relationship management (CRM) tool built directly into Gmail. It is used for sales, marketing, hiring, and just about anything else you can think of.
We built it because out of the box, email is actually a really crummy team sharing system. By adding a layer of organization on top of email, Streak lets you add email threads directly into its spreadsheet view, making it useful as a workflow tool with capabilities including task creation, email template management, and easy data entry.
Streak has been integrated with G Suite (originally Google Apps For Your Domain) since its inception so when choosing a cloud, it made sense to colocate our server stack with Google Cloud.
Likewise, Streak was on Google App Engine from the start, and we slowly added other GCP services as the offerings improved or as our use cases became more complex.
In addition to App Engine, we use Google Kubernetes Engine to run a bunch of our compute workload, including both application servers and our offline processes like indexers and task queue consumers.
We use Cloud Dataflow for both streaming event processing and logs ETL, and BigQuery for all of our analytics queries. We use Cloud Pub/Sub for interacting with the Gmail watch API, as well as Stackdriver (logging, tracing, monitoring, errors) and OpenCensus to dig into any operational issues as they arise.
Then, on the database front, we recently started using Cloud Spanner, Google Cloud’s scalable relational database service. Before that, we stored most of our business data in Cloud Datastore, Google Cloud’s NoSQL document database.
Partially, that was historical, since Cloud Datastore was GCP’s only managed database when we wrote the Streak backend. And we’ve been very happy with how easy Cloud Datastore is to maintain. Between Google App Engine and Cloud Datastore, we’ve never had to have an explicit infrastructure on-call rotation.
But as more users rely on Streak to collaborate with larger and larger teams, we were feeling the pain of not having a fully relational database. We found ourselves having to manually join data in our application, which increased application latency and increased the time developers spent coding workarounds and debugging that complexity.
We found we needed two things out of our database: a scalable relational store and a graph store that could power next-gen Streak features. At the same time, we wanted a single database that could handle both use cases and wouldn’t increase our operational burden. This meant finding a managed service to give us more query flexibility, so we decided to give Cloud Spanner a try.
Of course, we didn’t want to migrate our existing stack to a new data platform without first testing it out (never a smart strategy). But since most of our existing data model required transactional updates with other entities, pulling out a single entity to test was challenging. We did have a feature in our pipeline that necessitated a graph data store and that was removed from our other data: our email metadata indexing system.
How your client software handles email metadata indexing can make or break the useability of a system. Think about how many times somebody forgets to reply-all or that you receive a forwarded thread with thirty emails in reverse-chronological order. Within our own inboxes, we rely on Gmail’s UI to nicely organize email threads, but that organization breaks down when working with a team or across organizational boundaries.
We decided to fix that in the Streak product by organizing metadata (i.e., headers but not message content) from users’ email by using Cloud Spanner as a graph database. Using a graph database lets us answer questions like “What are all the emails on this thread in the inboxes of everybody on my team?” and “Who on my team has previously talked with the organization that this prospect works at?”
In our model, the nodes of the graph are either an email message, a person (email address) or a company (a domain). Then we have four different types of “edges”— properties by which nodes in a graph connect to one another:
- Message to message (thread): messages that are on the same thread have an edge between them. The reason we do this is because we want to show users a list of threads to answer their questions, not messages, so we need to be able to get the spanning set of messages.
- Message to message (same RFC id): A core value proposition of Streak is being able to see the “unified” version of a thread that shows each person on a team’s version of the email thread. To make sure we are getting each user’s version of a thread when we issue a query, there needs to be an edge between a message in the queryer’s inbox and the same message in their team’s inbox. In case you’re curious, Streak uses the RFC message id to determine that two messages across inboxes are actually the same.
- Email address to message: a message has an edge to an email address if it was either the from, to, cc, or bcc on the message. This edge is crucial for queries that start with: “Show me all threads between this person and our team.”
Domain to message: a message has an edge to a domain if the domain is present in any of the from, to, cc, or bcc addresses on the message. This edge is similarly used for queries that start with “Show me all threads between this company and our team.”
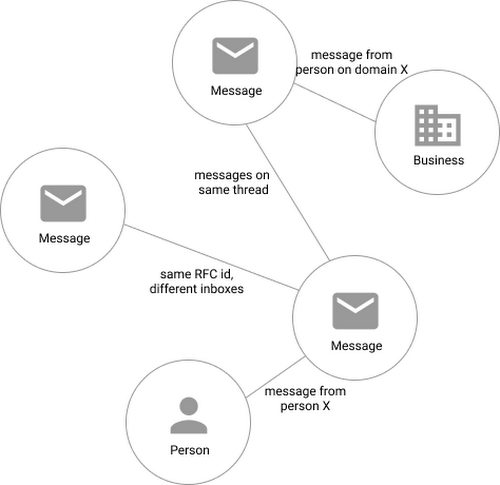
Using Cloud Spanner’s distributed SQL capabilities and scalability to build a graph database also let us answer the important follow-up question: “Which threads have I been granted permission to view?” And while a lot of these questions could be answered per-user by a traditional relational database, scale limitations have to be taken into consideration, especially as we plan for 10x or more data volume growth as both our user base grows and as their inboxes accumulate more emails. A graph database model is simply a better fit for Streak’s collaboration model with many-to-many mappings between users and teams, and will allow us to query the data in any number of configurations, without worrying about scale limitations or having to manually shard a relational database. Cloud Spanner gives us queryability and scalability.
Taking the Cloud Spanner plunge
With so many advantages to it, we went ahead and began building out our metadata system with Cloud Spanner as a back-end.
Adopting Cloud Spanner has been great. Here are some of the high points:
- The fast distributed queries and transactions are absolutely real. We have global indexes across our entire dataset and we haven’t had to spend very much time at all thinking about co-locating data. In particular, we only use interleaved tables for values that would be repeated fields in Cloud Datastore, and that hasn’t been a problem for us yet.
- We haven’t had any reliability problems whatsoever, despite averaging 20K writes/sec in steady state.
- Once we optimized our queries on realistic data, Cloud Spanner scaled up in a surprisingly predictable way. You need to run queries after you’ve populated data, do the explain to figure out how the query planner is executing the query, and add indexes/modify queries to make sure they’re performant.
- Compared to the hoops some traditional relational databases make you jump through, Cloud Spanner’s online schema changes and index builds are magical. There is no downtime for these operations.
Overall, the experience has been encouraging, and we’re planning to move 20 TB of existing data in Cloud Datastore to Cloud Spanner as well. We built out an ORM library for Java on top of Cloud Spanner called Ratchet and are testing a framework for dual-writing entities to both Cloud Datastore and Cloud Spanner to support the rest of the migration. We now store about 40 TB of email metadata in Cloud Spanner, which makes us a large user of Cloud Spanner.
In short, if you’re starting to outgrow your NoSQL database, and want to move to a managed SQL database, give Cloud Spanner a try. You definitely want to model out your costs and try out a proof of concept, both to see how it works on your workload and to get familiar with the quirks of the system. But you don’t need to spend much time worrying about the reliability of the product: it’s there.
Google Cloud Migration Speeds Up The New York Times’ Journey to New Normal
5787
Of your peers have already read this article.
2:30 Minutes
The most insightful time you'll spend today!
Like virtually every business across the globe, The New York Times had to quickly adapt to the challenges of the coronavirus pandemic last year. Fortunately, our data system with Google Cloud positioned us to perform quickly and efficiently in the new normal.
How we use data
We have an end-to-end type of data platform; on one side we work very closely with our product teams to collect the right level of data that they’re interested in, such as which articles people are reading, and how long they’re staying onsite. We frequently measure our audience to understand our user segments, and how they come onsite or use our apps. We then provide that data to analysts for end-to-end analytics.
On the other side, the newsroom is also focused on audience, and we build tools to help them understand how Google Search or different social promotions play a role in a person’s decision to read The New York Times, and also to get a better sense of their behavior on our pages. With this data, the newsroom can make decisions about information that should be displayed on our homepage or in push notifications.
Ultimately, we’re interested in behavioral analytics—how people engage with our site and our apps. We want to understand different behavioral patterns, and which factors or features will encourage users to register and subscribe with us.
We also use data to create or curate preferences around personalization, to ensure we’re delivering to our users fresh content, or content that they may not have normally read. Likewise, our data also gets used in our targeting system, so that we can send out the right messaging about our various subscription packages to the right users.
Choosing to migrate to Google Cloud
When I came to The New York Times over five years ago, our data architecture was not working for us. Our infrastructure was gathering data that proved harder for analysts to crunch on a daily basis. We were also hitting hang ups with how that data was streaming into our system and environment. Back then we’d run a query and then go grab some coffee, hoping that the query would finish or give us the right data by the time we came back to our desks. Sometimes it would, sometimes it wouldn’t.
We realized that Hadoop was definitely not going to be the on-premises solution for us, and that’s when we started talking with the Google Cloud team. We began our digital transformation with a migration to BigQuery, their fully managed, serverless database warehouse. We were under a pretty aggressive migration timeline, focusing first on moving over analytics. We made sure our analysts got a top-of-the-line system that treated them the way that they themselves would want to treat the data.
One significant prominent requirement in our data architecture choice was to enable analysts to be able to work as quickly as they needed to provide high-quality deliverables for their business partners. For our analysts, the transition to BigQuery was night and day. I still remember when my manager ran his very first query on BigQuery and was ready to go grab his coffee, but the query finished by the time he got up from his chair. Our analysts talk about that to this day.
While we were doing the BigQuery transition, we did have concerns about our other systems not scaling correctly. Two years ago, we weren’t sure we’d be able to scale up to the audience we expected on that election day. We were able to band-aid a solution back then, but we knew we only had two more years to figure out a real, dependable solution.
During that time, we moved our streaming pipeline over to Google Cloud, primarily using App Engine, which has been a flexible environment that enabled quick scaling changes and requirements as needed. Dataflow and Pub/Sub also played significant roles in managing the data. In Q4 of 2020 we had our most significant traffic ever recorded, at 273 million global readers, and four straight days of the highest traffic we’ve had compared to other election weeks. We were proud to see that there was no data loss.
A couple of years ago, on our legacy system, I was up until three in the morning one night trying to keep data running for their needs. This year, for election night, I relaxed and ate a pint of ice cream because I was able to more easily manage our data environment, allowing us to set and meet higher expectations for data ingestion, analysis and insight among our partners in the newsroom.
How COVID-19 changed our 2020 roadmap
The coronavirus pandemic definitely wasn’t on my team’s roadmap for 2020, and it’s important to mention here that The New York Times is not fundamentally a data company. Our job is to get the news out to our users every single day in paper, on apps, and onsite. Our newsroom didn’t expect the need to build out a giant coronavirus database that would enrich the news they share every day.
Our newsroom moves quickly, and our engineers have built one of the most comprehensive datasets on COVID-19 in the U.S. With Google, The New York Times decided to make our data publicly available on BigQuery Google’s COVID-19 public dataset. Check out this webinar for more details on our evolution architecture:https://www.youtube.com/embed/mtNlrFpschU?enablejsapi=1&
Flexible approach
We have many different teams that work within Google Cloud, and they’ve been able to pick from the range of available services and tailor project requirements keeping those tools available in mind.
One challenge we think about with the data platform at The New York Times is determining the priorities of what we build. Our ability to engage with product teams at Google though the Data Analytics Customer Council allows us to see into the BigQuery roadmap, or the data analytics roadmap, and plays a significant role in determining where we focus our own development. For example, we’ve built tools like our Data Reporting API, which reads data directly from BigQuery, in order to take advantage of tools like BigQuery BI Engine. This approach encourages our analysts to be better managers of their domains around dimensions and metrics, but not have to focus on building caching mechanisms of their data. Getting that kind of clarity helps us plan how to build The New York Times in the new normal and beyond.
If you are interested to learn more about the data teams at the New York Times, take a look at our open tech roles here and you’ll find many interesting articles at NYT data blog.
More Relevant Stories for Your Company

Blue Apron: Offering a better recipe for modern analytics
When Blue Apron had issues running its data warehouse on another cloud provider, it built an analytics platform using Looker and Google BigQuery to enable faster business decisions about food inventory. Google Cloud Results Enables near real-time business decisions to better manage food inventory and delivery by reducing query times

How Data Teams in EdTech Firms Make Most of the Educational Data at All Levels
Education data can inform strategy, enhance both teaching and learning, and help us better understand customer needs. But that data is only as useful as an organization’s ability to access, analyze, and act upon it. Education Technology (EdTech) companies with a strong data warehouse management policy can help to make

How Arvind Fashions Ltd leads the fashion industry with powerful data analytics on BigQuery
Arvind Ltd has been in the apparel industry for more than 90 years, with its retail powerhouse Arvind Fashions Ltd being the backbone of well-known names in the retail fashion industry in India. Arvind Fashions Ltd (Arvind) has seen significant growth in its portfolio with new franchises being added every

Unifying Data and AI: Bringing Unstructured Data Analytics to BigQuery
Over one third of organizations believe that data analytics and machine learning have the most potential to significantly alter the way they run business over the next 3 to 5 years. However, only 26% of organizations are data driven. One of the biggest reasons for this gap is that a
