





New Histogram Features in Cloud Logging Make it Easier to Track Log Volumes, Errors and Anomalies!

3393
Of your peers have already read this article.
2:30 Minutes
The most insightful time you'll spend today!
Visualizing trends in your logs is critical when troubleshooting an issue with your application. Using the histogram in Logs Explorer, you can quickly visualize log volumes over time to help spot anomalies, detect when errors started and see a breakdown of log volumes. But static visualizations are not as helpful as having more options for customization during your investigations.
That’s why we’re excited to announce that we recently added three new query controls along with separate colors for log severity to the histogram. These new features make it even easier to refine and analyze your logs by time range. The new histogram controls help find logs before or after the current period, jump to a specific time range represented in a histogram bar and zoom in/out of the current time window in the histogram.
Histogram colors
The histogram now makes it easier to view the breakdown of logs by severity with the introduction of color coding. For example, the severity colors make it easy to spot an increasing number of errors even when the volume of requests is relatively constant. Looking at the histogram below, the red vs blue shading makes it clear that there has been an increase in overall log volume and provides a visual breakdown of errors within that log volume.

Pan left/right to scroll through time
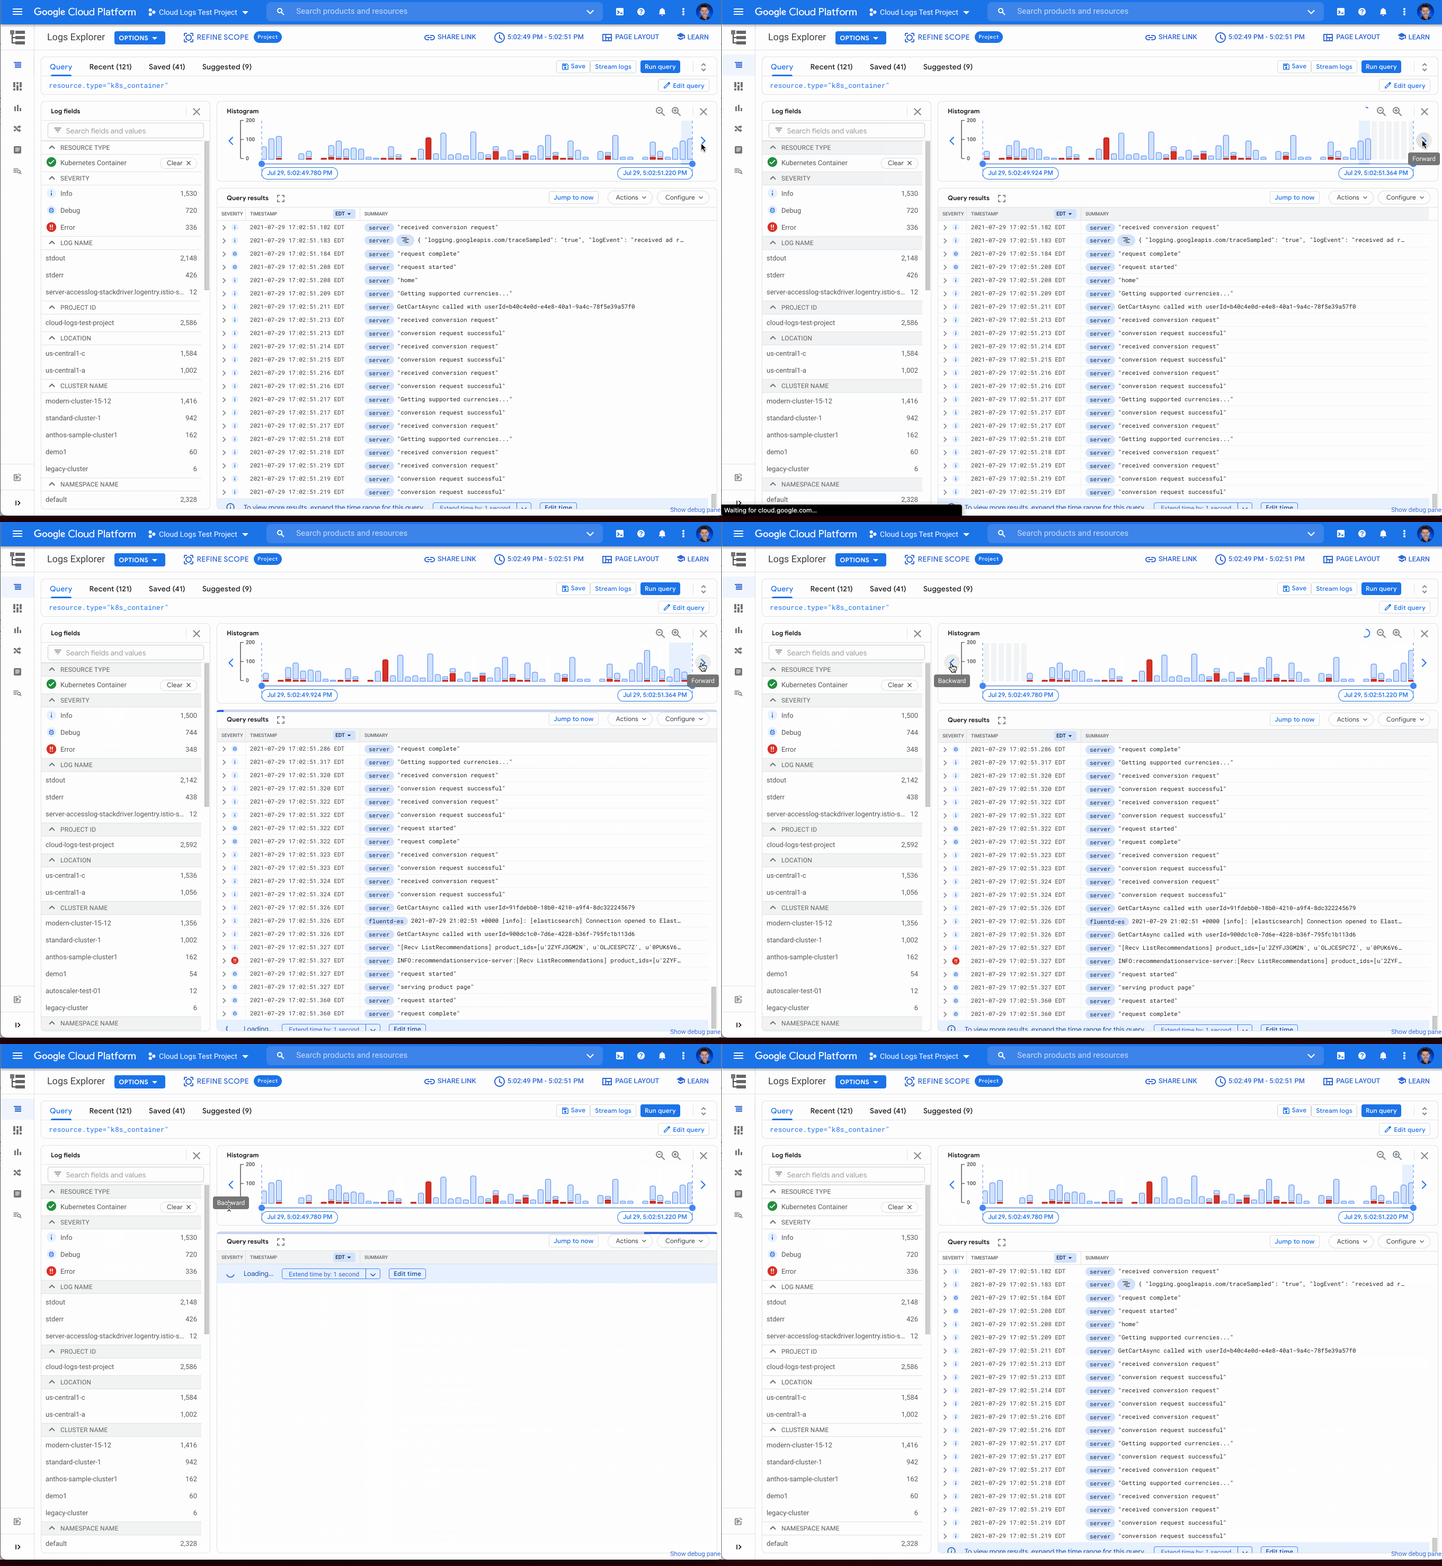
Sometimes in your troubleshooting journey, you may want to look at the logs directly before or after the current set of logs. Perhaps there was an unexpected spike in errors at the beginning of the time range and you need to see the logs in the time period directly preceding the current time range. Pressing the left arrow on the left side of the histogram shifts the time range earlier while the arrow on the right side of the histogram shifts the time range ahead. Either arrow will refine the time range in the query and rerun the query to return the logs in the new time range.
Zooming in or out
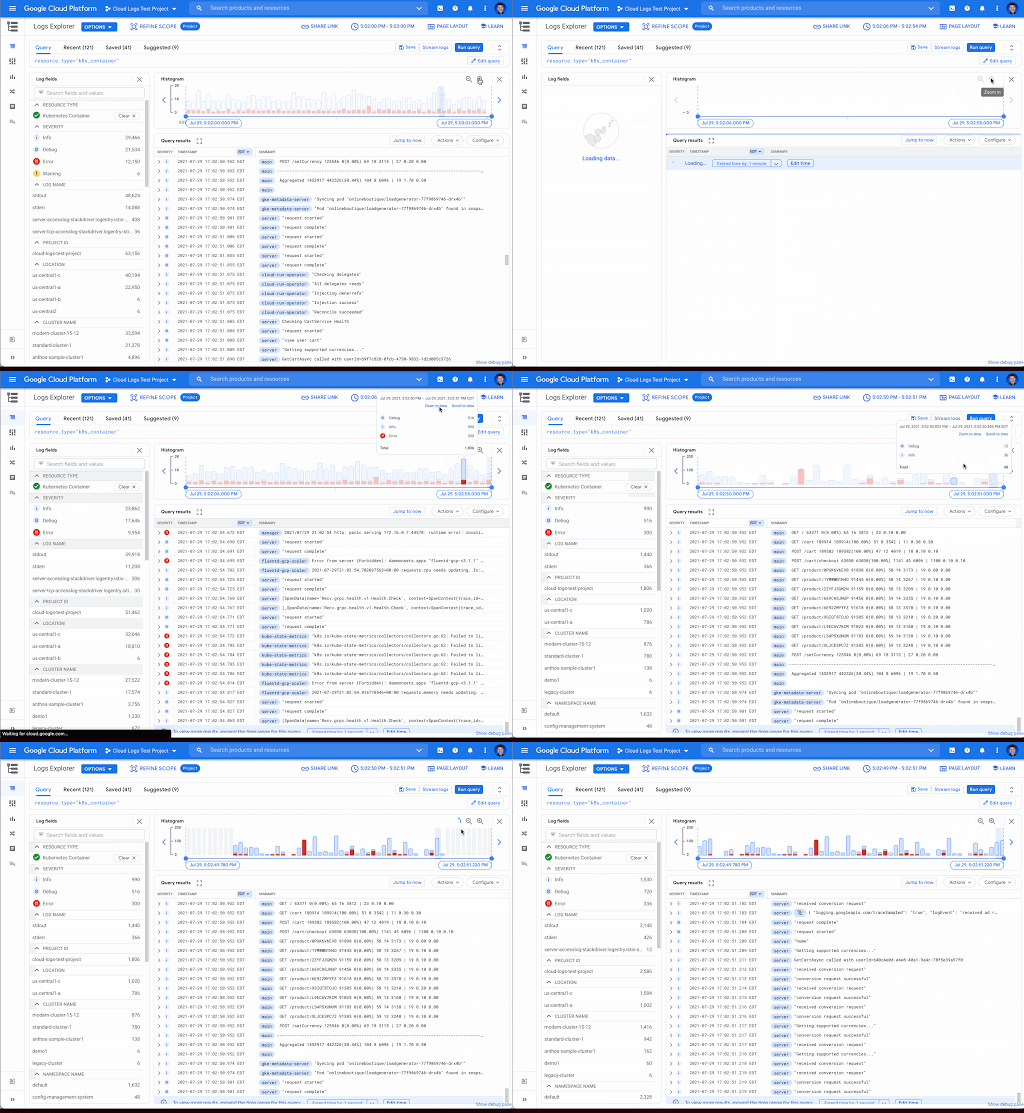
Zooming in or out from a given time range may be useful to visualize fine-grained details or a broader trend Clicking the zoom in or out icons in the upper right corner of the histogram refines the time range in the query and then reruns the query, returning the logs in the newly defined time range.
Scrolling to time
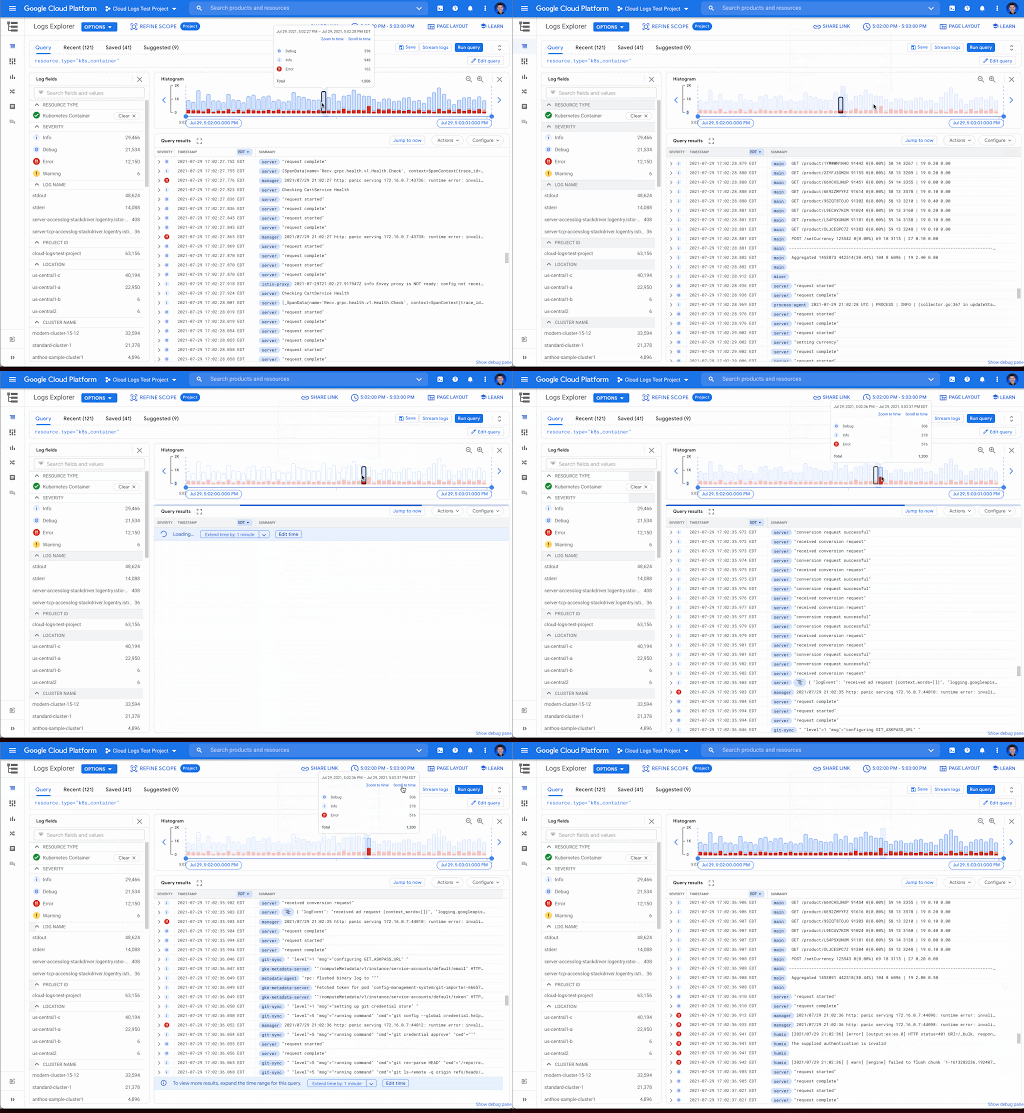
If you see a large spike in logs volume in the histogram, it’s useful to quickly review the logs generated during that spike. Clicking on the histogram bar that contains the spike now scrolls you to the logs generated during that time period.
Where to find the histogram
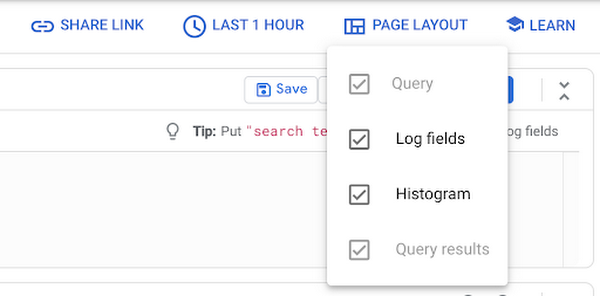
The histogram is a panel in Logs Explorer that can be displayed or hidden using the controls in the Page Layout menu. When you no longer want to display the histogram, click the “X” button in the upper right corner to quickly close it. To open it again, use the same Page Layout menu to enable the histogram display.
Get started with the histogram
These improvements move the histogram from a utility for visualization to an integral part of the troubleshooting journey. We are continuously working to launch new features that make Cloud Logging the best place to troubleshoot your Google Cloud logs. If you are not already a Cloud Logging user, review this getting started documentation or watch a quick video on troubleshooting services on Google Kubernetes Engine (GKE) to learn more. If you have specific questions or feedback, please join the discussion on our Google Cloud Community, Cloud Operations page.
3418
Of your peers have already watched this video.
1:30 Minutes
The most insightful time you'll spend today!
Google Cloud Cortex Framework: Innovate on Cloud with Less Risk, Cost and Complexity!
Google Cloud Cortex Framework is a comprehensive approach to cloud innovation that enables users to accelerate value with less risk, complexity and cost! The Cortex Framework includes a comprehensive tools and know-how to build, design and deploy cloud solutions to address business challenges and achieve desired outcomes. Watch the video to get started with Google Cloud Cortex Framework.
Guide to Google’s Underwater Infrastructure
5657
Of your peers have already read this article.
1:00 Minutes
The most insightful time you'll spend today!
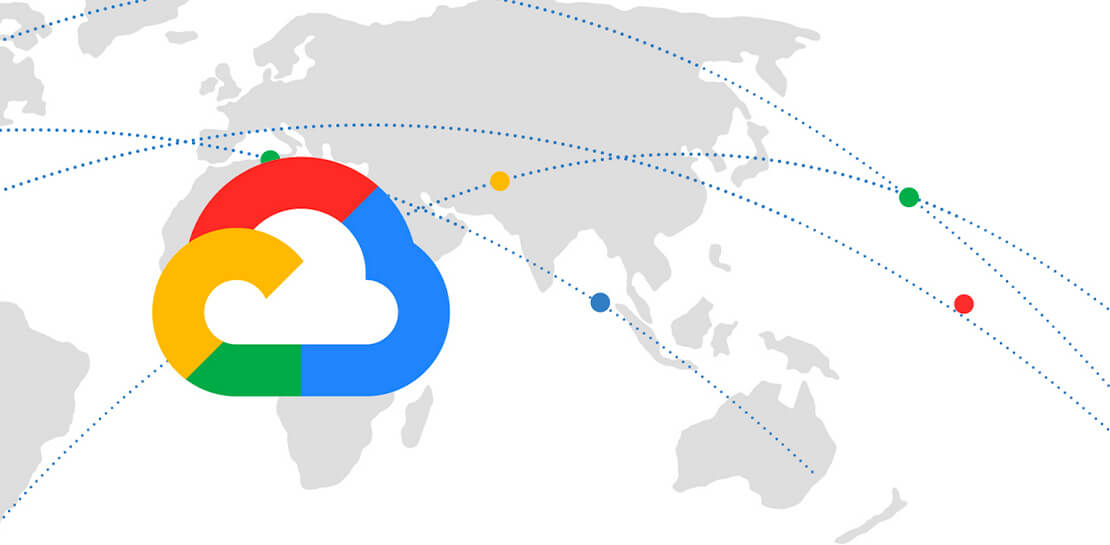
From data centers and cloud regions to subsea cables, Google is committed to connecting the world. Our investments in infrastructure aim to further improve our network—one of the world’s largest—which helps improve global connectivity, supporting users and Google Cloud customers. Our subsea cables play a starring role in this work, linking up cloud infrastructure that includes more than 100 network edge locations and over 7,500 edge caching nodes.
As it turns out, readers of this blog seem to find what happens under the sea just as fascinating as what’s going on in the cloud. Posts on our cables are consistently among our most popular, which is why we brought them together for you here so you can take a deeper dive (pun intended).
Here’s a list our most popular posts on our underwater infrastructure:
2021
- Hola, South America! Announcing the Firmina subsea cable
- This bears repeating: Introducing the Echo subsea cable
- The Dunant subsea cable, connecting the US and mainland Europe, is ready for service
2020
2019
- Introducing Equiano, a subsea cable from Portugal to South Africa
- A quick hop across the pond: Supercharging the Dunant subsea cable with SDM technology
- Curie subsea cable set to transmit to Chile, with a pit stop to Panama
2018
- Expanding our cloud network for a faster, more reliable experience between Australia and Southeast Asia
- Delivering increased connectivity with our first private trans-Atlantic subsea cable
2017
2016
- New undersea cable expands capacity for Google APAC customers and users
- Google Cloud customers run at the speed of light with new FASTER undersea pipe
- A journey to the bottom of the internet
Our cable systems provide the speed, capacity and reliability Google is known for worldwide, and at Google Cloud, our customers can make use of the same network infrastructure that powers Google’s own services. To learn more, you can view our network on a map, or read more about our network.
5872
Of your peers have already watched this video.
1:30 Minutes
The most insightful time you'll spend today!
FFF Enterprises See 80% Improvements in Speed at Lower Cost by Moving SAP Data to Google Cloud
FFF Enterprises, a pharmaceutical distributor of lifesaving biopharma products, vaccines and plasma products deployed SAP on Google Cloud to leverage its ability to scale server demands, reduce costs and improve speed and performance. Learn how the migration helps FFF empower healthcare to care!
3234
Of your peers have already watched this video.
20:00 Minutes
The most insightful time you'll spend today!
The Transformative Journeys of Financial Firms on Google Cloud: Watch Video
The reliance on cloud-based architectures, high performance computing, big data and more are accelerating in the banking, capital, insurance and financial services industries. Google Cloud had a strong role in transforming many businesses especially in the pandemic to smoothly transition into the digital space and understand their customers. Two years since then, financial firms have been able to design better products based on intelligent, real-time insights and leverage many capabilities of Google Cloud to deliver tailored experiences. So, how big of an impact Google Cloud has on the future of the financial services? The answer is huge and endless.
Watch this video to dive into the state of global financial services companies that leveraged modern cloud architecture for their sensitive data, platforms, devices and products while they increase revenues, stay compliant and curb costs.

5485
Of your peers have already downloaded this article
1:30 Minutes
The most insightful time you'll spend today!
IDC recently examined the benefits of implementing BigQuery for SAP data. The findings reveal massive improvements to the SAP customers’ overall business results due to faster access to data insights, lower data warehouse operation cost, and increased productivity among the data warehouse and development teams. Download the report now!
More Relevant Stories for Your Company

IT Team Figures Out Easiest Way to Build Data Pipelines and Create ML Models
Building a strong brand in today's hyper-competitive business environment takes vision. It also requires a flexible, easily managed approach to digital asset management (DAM), so marketing professionals and other stakeholders can easily share, store, track, and manipulate assets to build the brand. Many of today's leading companies, including JetBlue, Slack,



Managing Change in an SAP World
Change is a constant for SAP customers. Now more than ever, SAP customers need solutions that provide them business agility, rock solid availability, enhanced security, and true economic value. Learn how Google Cloud can guide your SAP journey to the cloud with simple and no cost migrations, powerful infrastructure, and
Rely on Google Cloud for SAP
Reduce risks, increase uptime, and free up working capital with Google Cloud’s SAP Business Continuity Program. Working closely with our experienced partner community, we will ease the lift and shift of your on premises or hosted SAP environments with simple, no-cost migrations. Gain a future-proof digital business platform with integrated
What You Can Learn from ‘Up or Out’ Framework for Cloud Adoption
In times of significant disruption, organizations are faced with three choices: Retrench within legacy solutions, pause and do nothing while waiting for more data or different circumstances, or press ahead, potentially even accelerating to realize the desired outcome. In such an environment, it is critical to ensure you’re delivering the
